2869 N Colby Dr · Bloomingdale, IN
Flood risk 1/10 · Minimal
- FEMA flood zone
- X (unshaded)
- Chance of flooding over 30 yrs
- 0.0%
- Est. flood insurance / yr
- $507 – $1,088
Fire risk 1/10 · Minimal
- Est. fire insurance / yr
- $717 – $1,331
Heat risk 3/10 · Minor
- Hot days now (above 105°F)
- 7 days/yr
- Hot days in 30 yrs
- 18 days/yr
Wind risk 2/10 · Minimal
- Chance of severe wind over 30 yrs
- 2.0%
Air-quality risk 2/10 · Minimal
- Unhealthy air days now
- 1 days/yr
- Unhealthy air days in 30 yrs
- 2 days/yr
Risk factors via First Street. Map © Google.
Why this score? — see what drove the D+ grade
The composite is a weighted blend of 9 inputs, each scored 0–100. Each bar is that input's sub-score; the figure is the points it added to the 100-point composite (weight × sub-score).
- Cash flow +15.6/30.0
- ARV discount +7.5/15.0
- Appreciation +5.0/10.0
- DSCR +4.8/10.0
- 1% rule +2.9/10.0
- Schools +2.9/10.0
- Livability +2.9/5.0
- Rent growth +2.5/5.0
- Condition / age +2.5/5.0
$159,000
🖨 Deal sheet (PDF) 📄 Offer letter ✓ Due diligence
Listing remarks MLS
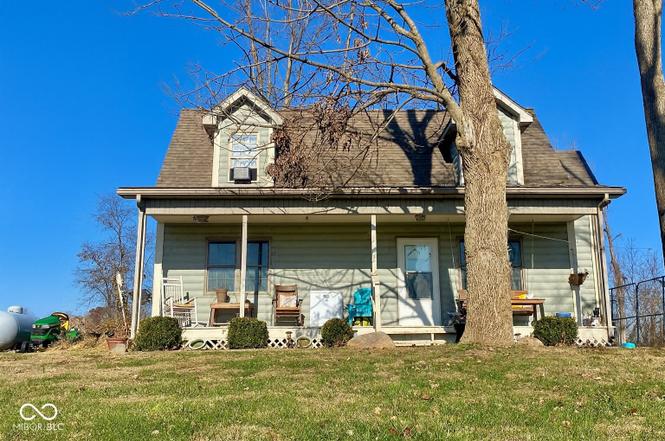
Escape the hustle and retreat to your very own log cabin. This 2 bdr, 2 bath cabin could be your weekend getaway or full time home. Living/dining room combo with gas log fireplace. Kitchen w/stainless steel appliances. Full covered front porch, a perfect place for your rocking chairs so that you can watch the sunset over the pond. Rear deck has room for your grill! Mature trees shade the home. **Home had a pipe burst in January. Repairs have not been made to the home. Approximate repair cost is $6250. A copy of needed repairs and estimate is available.** Repairs need to be made in the kitchen, bathroom and bedroom. Sellers wish to sell the house in "as is" condition. ***
Key facts
- 0.73-acre lot
- Outdoor area
- Rich wood accents
Tags
Property features AI
Finance
- Other: Approximately 0.73-acre lot (about 1/2–1 acre)
Exterior
- Parking: Gravel parking
- Utilities: Septic system; Private/other water source
- Home design: Single-family residence; One-and-a-half story
- Construction: Wood siding; Crawl space foundation
- Exterior features: Covered deck; Mature trees on the lot
Interior
- Kitchen: Gas oven; Refrigerator; Breakfast bar
- Bedrooms: Two bedrooms total — one on the main level and one on the upper level; Upper-level loft (14x11)
- Bathrooms: Two full bathrooms — one on the main level and one on the upper level
- Heating & cooling: Forced air heating (propane); Central air conditioning
- Interior features: Vaulted ceilings; Breakfast bar; Fireplace with insert
- Laundry & utility: Washer and dryer included; Water softener (owned); Electric water heater; Upper-level laundry
Neighborhood map
What this means for you Summary
Snapshot
- This is a 3-bed/1.0-bath single-family listed at $159k.
Deal economics
- At list price, monthly cash flow is $66 ($795/yr) — positive.
- The deal already cash-flows at list — no discount required.
- To meet the 1% rule (rent ≥ 1% of price), the offer needs to be $126k (20.9% below list).
- Recommended offer: $126k (20.9% below list) — sets the bar for 1% rule.
Location & tenants
- Location reads 58/100 on livability (#590 in IN) — a working-class tenant base; expect higher turnover. Strengths: cost of living A+, housing A-; Watch: crime D, employment D, amenities F.
- North Central Parke Comm School Corporation (town): math 30% / reading 39% proficiency, ranked #198 of 301 in IN (top 66%) — families likely to look elsewhere, expect single-tenant / working-renter base with shorter leases.
- Zoned schools: Turkey Run Elementary School (math 57% / reading 47%, grade C-, #237 of 994 statewide, top 26%, 249 students, 61% FRL); Parke Heritage Middle School (math 16% / reading 33%, grade F, #251 of 330 statewide, top 77%, 263 students, 61% FRL); Parke Heritage High School (math 12% / reading 57%, grade F, #270 of 369 statewide, top 77%, 341 students, 57% FRL).
- Market conditions: 4 active listings in the ZIP; 61 units permitted in Parke County in 2024 (0 in 5+ unit buildings).
Forward outlook
- In year one you build about $6k of equity ($1k loan paydown + $5k appreciation (3.0% local appreciation)).
- Parke County population projected at -10% by 2050 — secular population decline; favor cash flow + early exit over multi-decade hold.
- At projected returns (3.0% appreciation + 3.0% rent growth), your $45k cash investment doubles in ~6 years — after that, you're playing with house money.
- By year 6, paydown + projected appreciation supports a ~$31k cash-out refi (75% LTV) — recoverable capital for the next deal without selling this one.
Negotiation context
- It's been on market 210 days — a 12% lower offer ($140k) is reasonable based on typical stale-listing flexibility.
- 5 sale attempts since 16y ago; this cycle's ask has dropped $11k (6%) from the opening price — seller is motivated, your offer sets the floor, not the list.
- Current owner paid $80k; list at $159k implies a 99% gain — meaningful room to come down on a strong offer.
Questions for the listing agent
- It's been on market 210 days. Have you received any prior offers? Is the seller open to a 21% concession, seller financing, or rate buy-down credit?
- Why hasn't it sold? Are there any deal-killer items the seller is aware of (foundation, flood, title, zoning, code violations)?
- Is there a deadline driving the sale (1031 exchange, divorce, estate, relocation)? That informs how much negotiation room exists.
- Schools are F-rated, which usually means shorter tenancies and higher turnover. Who's the typical renter profile here, and what's been the actual vacancy rate?
- Crime grade is D in this area — have there been break-ins, vandalism, or insurance claims at this property in the last 3 years? What carrier currently insures it and at what premium?
- The area grade is low — what's the realistic commute time and amenity access for the typical tenant pool here? Any planned neighborhood developments (good or bad) we should know about?
- What's the average days-on-market for RENTAL listings here right now (not sales)? A rising rental-DOM trend means longer vacancies and softer asking-rent achievability than the comps imply.
- What's the recent tenant-quality profile in this submarket — average credit score on applications, eviction rate, late-payment / NSF rate, and stable-employment percentage? A property-management company in the area should have these aggregated.
- How much new for-sale + rental construction is in the pipeline within 1–3 miles? Heavy new supply typically softens prices + rents 12–24 months out; constrained supply supports both.
Investment metrics
- 1% rule
- 0.79% ✗
- Cap rate
- 6.79%
- Cash-on-cash
- 1.79%
- DSCR
- 1.08
- GRM
- 10.5
CMA / ARV
No comps found within radius.
Projected returns pro-forma
3.0% appreciation · 3.0% rent growth · sell at horizon
- IRR
- 9.1%
- Equity multiple
- 1.52×
- Total profit
- $23,288
- Equity at exit
- $71,493
- IRR
- 11.6%
- Equity multiple
- 2.73×
- Total profit
- $76,895
- Equity at exit
- $110,180
Cash invested: $44,520 (down + closing). Projections, not guarantees.
Landlord ↔ Tenant lean methodology
- Overall (STATE)
- 90 Strongly Landlord-Friendly
- State Indiana
- 90 Strongly Landlord-Friendly · R+11
- County
- — inherits STATE
- City
- — inherits STATE
ZIP-level market 47859
- Active inventory
- 4
- Price-to-rent
- 10.5×
Monthly cashflow live
- Estimated rent
- $1,258 medium interval (Pro) →
- Mortgage (P&I)
- −$834
- Tax from tax record
- −$28 /mo · $333/yr
- Insurance
- −$66
- HOA
- −$0
- Vacancy / Maint / Mgmt
- −$264
- Net cashflow
- $66
Break-even live
Sensitivity live
| Price | -10% $156 | -5% $111 | +0% $66 | +5% $-160 | +10% $-215 |
|---|---|---|---|---|---|
| Rent | -10% $-33 | -5% $17 | +0% $66 | +5% $116 | +10% $166 |
| Rate | -1.0pp $146 | -0.5pp $107 | base $66 | +0.5pp $25 | +1.0pp $-17 |
UW: 25.0% down · 7.5% · 30yr · 1.5% tax · 5.0% vac · 8.0% maint · 8.0% mgmt
Financing live
Cash to close
- Down payment
- $39,750
- Closing costs
- $4,770
- Reserves months
- —
- Total cash needed
- —
Loan-product check · same deal, 3 products live
Conventional
25% down · 7.5% · 30yr
- Down + closing
- —
- Monthly P&I
- —
- Monthly cashflow
- —
- DSCR
- —
- Eligible?
- —
Personal DTI + credit; lowest rate.
DSCR
20% down · 8.5% · 30yr
- Down + closing
- —
- Monthly P&I
- —
- Monthly cashflow
- —
- DSCR
- —
- Eligible?
- —
No personal income docs; deal must DSCR.
Hard money
10% down · 12.0% · 12mo
- Down + closing
- —
- Monthly P&I
- —
- Monthly cashflow
- —
- DSCR
- —
- Eligible?
- —
Short-term bridge; refi at stabilization.
Listing history 29 events
-
2026-06-22days on market $159,000 Active 210 DOM
-
2026-06-19days on market $159,000 Active 207 DOM
-
2026-06-18days on market $159,000 Active 206 DOM
-
2026-06-17days on market $159,000 Active 205 DOM
-
2026-06-16days on market $159,000 Active 204 DOM
-
2026-06-15days on market $159,000 Active 203 DOM
-
2026-06-14days on market $159,000 Active 201 DOM
-
2026-06-12days on market $159,000 Active 200 DOM
-
2026-06-09days on market $159,000 Active 197 DOM
-
2026-06-08days on market $159,000 Active 196 DOM
-
2026-06-07days on market $159,000 Active 195 DOM
-
2026-06-05days on market $159,000 Active 192 DOM
-
2026-06-03days on market $159,000 Active 191 DOM
-
2026-06-02days on market $159,000 Active 190 DOM
-
2026-06-01days on market $159,000 Active 189 DOM
-
2026-05-31days on market $159,000 Active 188 DOM
-
2026-05-30days on market $159,000 Active 187 DOM
-
2026-04-20price $159,000
-
2026-03-03price $163,900
-
2025-11-23$169,900 Active
-
2022-05-23soldstatus $80,000
-
2022-05-19soldstatus $80,000 696-char remark
Show marketing remark (696 chars)
Escape the hustle and retreat to your very own log cabin. This 2 bdr, 2 bath cabin could be your weekend getaway or full time home. Living/dining room combo with gas log fireplace. Kitchen w/stainless steel appliances. Full covered front porch, a perfect place for your rocking chairs so that you can watch the sunset over the pond. Rear deck has room for your grill! Mature trees shade the home. **Home had a pipe burst in January. Repairs have not been made to the home. Approximate repair cost is $6250. A copy of needed repairs and estimate is available.** Repairs need to be made in the kitchen, bathroom and bedroom. Sellers wish to sell the house in "as is" condition. ***
-
2021-10-28$85,000 696-char remark
Show marketing remark (696 chars)
Escape the hustle and retreat to your very own log cabin. This 2 bdr, 2 bath cabin could be your weekend getaway or full time home. Living/dining room combo with gas log fireplace. Kitchen w/stainless steel appliances. Full covered front porch, a perfect place for your rocking chairs so that you can watch the sunset over the pond. Rear deck has room for your grill! Mature trees shade the home. **Home had a pipe burst in January. Repairs have not been made to the home. Approximate repair cost is $6250. A copy of needed repairs and estimate is available.** Repairs need to be made in the kitchen, bathroom and bedroom. Sellers wish to sell the house in "as is" condition. ***
-
2016-12-05soldstatus $76,850 489-char remark
Show marketing remark (489 chars)
Escape the hustle and retreat to your very own log cabin overlooking a pond. This 2 bdr, 2 bath cabin could be your weekend getaway or full time home. Built in 2004 and offering 1138 SF. L shaped living/dining room combo with gas log fireplace. Kitchen w/stainless steel appliances. Full covered front porch, a perfect place for your rocking chairs so that you can watch the sunset over the pond. Rear deck has room for your grill! Mature trees shade the home. Picturesque setting!
-
2016-07-22$77,000 489-char remark
Show marketing remark (489 chars)
Escape the hustle and retreat to your very own log cabin overlooking a pond. This 2 bdr, 2 bath cabin could be your weekend getaway or full time home. Built in 2004 and offering 1138 SF. L shaped living/dining room combo with gas log fireplace. Kitchen w/stainless steel appliances. Full covered front porch, a perfect place for your rocking chairs so that you can watch the sunset over the pond. Rear deck has room for your grill! Mature trees shade the home. Picturesque setting!
-
2015-08-08historical
-
2014-09-17$78,000
-
2011-02-18historical
-
2010-08-16$99,900
ⓘ Source: listings_history table (triggers on properties + properties_extension) + one-shot
backfill from property_details.listing_events for pre-trigger history.
Tax reassessment forecast IN · Partial reset (capped growth)
- Current annual tax
- $333 · $28/mo
- Projected year-2 tax
- $842 · $70/mo
- Expected delta
- +$509/yr (+$42/mo · 152.6%)
ⓘ Screening estimate from a state-policy table — verify with the county assessor before closing.
Climate risk First Street
- Flood 1/10 Low FEMA zone X (unshaded) · 0% chance over 30 yrs
- Wildfire 1/10 Low
- Heat 3/10 Moderate 7 d/yr ≥105°F today · 18 d/yr by 30 yrs out
- Wind 2/10 Low 2% chance of damaging wind over 30 yrs
- Air quality 2/10 Low 1 unhealthy d/yr today · 2 by 30 yrs out
Nearby sold comps map
Loading sold comps map…
Walkable amenities ~0.75 mi
Loading nearby amenities…
Taxation est. · year 1
- Rental income
- $15,100
- − Mortgage interest
- −$8,906
- − Property taxes
- −$333
- − Insurance
- −$795
- − Repairs & maintenance
- −$1,208
- − Management
- −$1,208
- − Depreciation
- −$4,625
- Taxable loss
- −$1,976
- Est. tax savings @ 24.0%
- +$474
- After-tax cash flow
- $1,269/yr
For passive investors: Depreciation is non-cash, so a rental often shows a tax loss while cash-flowing — sheltering income. Rental losses are passive: they offset passive income freely, and up to $25,000/yr can offset ordinary (W-2) income if you actively participate and your MAGI is under $100k (phasing out to $0 by $150k); unused losses carry forward. On sale, claimed depreciation is recaptured at up to 25%, and gains may owe capital-gains tax (a 1031 exchange can defer both). Figures are a year-1 estimate at your 24.0% rate — not tax advice; consult a CPA.
Schools (NCES district)
- District
- North Central Parke Comm School Corporation
- NCES district ID
- 1800118
- Math proficiency
- 30% ▼ -8.00%
- Reading proficiency
- 39% ▼ -4.00%
- Median HH income
- $43,739
- Composite
- 29.31/100
- National rank
- #6553
- State rank
- #198 of 301 in IN
Livability — Bloomingdale
- Score
- 58/100
- State rank
- #590
- US rank
- #21154
Category grades
Schools grade is shown separately in the Schools card above.
Census & demographics
- Population (ZIP)
- 1,078
Population outlook (Parke County) Hauer SSP2
- Today (2025)
- 15,937 people
- By 2030
- 15,467 · -2.9%
- By 2040
- 14,793 · -7.2%
- By 2050
- 14,318 · -10.2%
- By 2075
- 13,484 · -15.4%
- By 2100
- 12,236 · -23.2%
Race, ethnicity, and origin ACS 2023
- Neighborhood character
- Predominantly White (94%)
- Race & ethnicity
- White 94% Black 6%
- Common ancestry
- Polish 4% Slovak 1%
- Foreign-born
- 0%
- Languages at home
- 66% English-only · German/W. Germanic 34%
Political lean MEDSL · Parke
- 2024 margin
- Solid R (+56.9) · D 20.6% · R 77.5% · Other 1.9%
- 2008→2024 swing
- -42.8pp toward R · 2008: -14.1pp · 2024: -56.9pp
- All cycles
- 2024: R+56.9 2020: R+55.5 2016: R+52.0 2012: R+32.6 2008: R+14.1
Not yet ingested
- Civics
- —
Market trends
- HPI YoY
- —
- Current HPI
- —
- Rent YoY
- —
- Metro
- —
- State GDP YoY
- ▲ 2.90%
- F500 in state
- 18
Industry mix (Fortune 500 HQ in IN)
| Industry | F500 HQs | Revenue |
|---|---|---|
| Industrial Machinery | 2 | $37B |
|
||
| Healthcare | 1 | $177B |
|
||
| Pharmaceuticals | 1 | $45B |
|
||
| Metals / Steel | 1 | $18B |
|
||
| Agriculture | 1 | $17B |
|
||
| Packaging | 1 | $12B |
|
||
Price history
+59.2% since first listed12 events — show timeline
- 2026-04-20 Price Changed $159,000 MIBOR as Distributed by MLS Grid
- 2026-03-03 Price Changed $163,900 MIBOR as Distributed by MLS Grid
- 2025-11-23 Listed $169,900 MIBOR as Distributed by MLS Grid
- 2022-05-23 Sold (Public Records) $80,000 Public Records
- 2022-05-19 Sold (MLS) $80,000 MIBOR as Distributed by MLS Grid
- 2021-10-28 Listed $85,000 MIBOR as Distributed by MLS Grid
- 2016-12-05 Sold (MLS) $76,850 MIBOR as Distributed by MLS Grid
- 2016-07-22 Listed $77,000 MIBOR as Distributed by MLS Grid
- 2015-08-08 Listing Removed — MIBOR as Distributed by MLS Grid
- 2014-09-17 Listed $78,000 MIBOR as Distributed by MLS Grid
- 2011-02-18 Listing Removed — MIBOR as Distributed by MLS Grid
- 2010-08-16 Listed $99,900 MIBOR as Distributed by MLS Grid
Property tax history
+7.4%/yrLatest (2024): $333 · +19.9% YoY. Source: county tax records.
Cash-flow waterfall
monthlySold comps — $/sqft
last 12 mo · ≤1 miLoading sold comps…