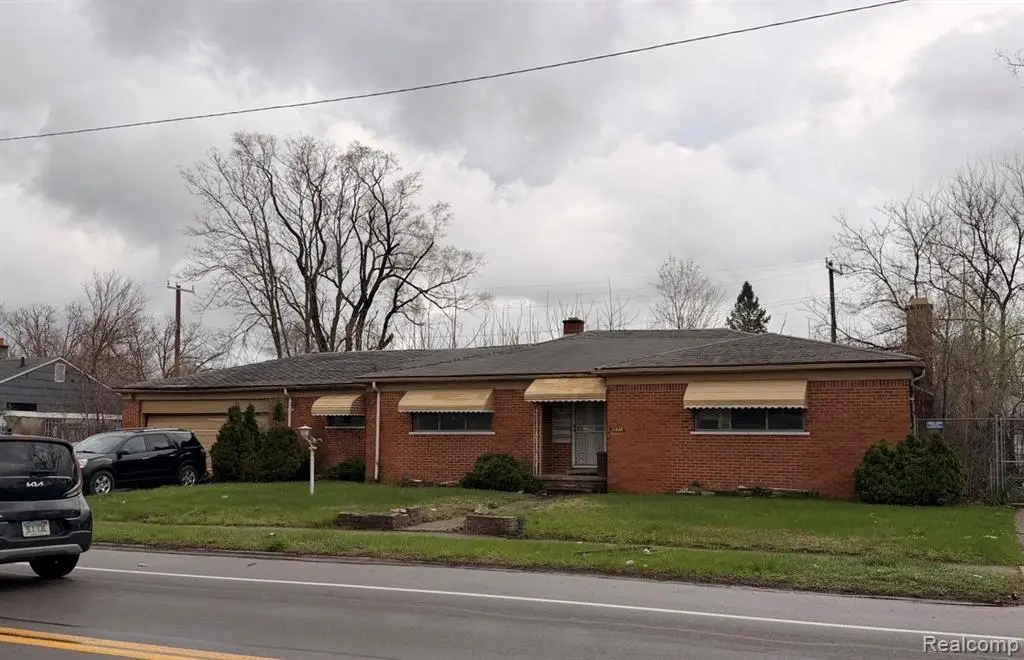
19994 Wyoming Ave · Detroit, MI
Flood risk 1/10 · Minimal
- FEMA flood zone
- X (unshaded)
- Chance of flooding over 30 yrs
- 0.0%
- Est. flood insurance / yr
- $473 – $860
Fire risk 1/10 · Minimal
- Est. fire insurance / yr
- $784 – $1,456
Heat risk 3/10 · Minor
- Hot days now (above 97°F)
- 7 days/yr
- Hot days in 30 yrs
- 15 days/yr
Wind risk 2/10 · Minimal
- Chance of severe wind over 30 yrs
- —
Air-quality risk 3/10 · Minor
- Unhealthy air days now
- 2 days/yr
- Unhealthy air days in 30 yrs
- 5 days/yr
Risk factors via First Street. Map © Google.
Why this score? — see what drove the B- grade
The composite is a weighted blend of 9 inputs, each scored 0–100. Each bar is that input's sub-score; the figure is the points it added to the 100-point composite (weight × sub-score).
- Cash flow +30.0/30.0
- 1% rule +10.0/10.0
- DSCR +10.0/10.0
- ARV discount +7.5/15.0
- Livability +3.7/5.0
- Rent growth +3.4/5.0
- Condition / age +2.5/5.0
- Schools +1.3/10.0
- Appreciation +0.0/10.0
$50,000
🖨 Deal sheet (PDF) 📄 Offer letter ✓ Due diligence
Listing remarks MLS
Investor opportunity with major upside potential! This solid brick ranch offers approximately 1,900 square feet with a basement and attached garage, situated on a spacious lot with strong curb appeal. The interior condition reflects significant deferred maintenance and extensive cleanout/renovation needs, making this a true fixer-upper being sold strictly AS-IS. Interior photos show substantial debris, damaged walls and ceilings, and conditions requiring full buyer due diligence. All measurements, square footage, and data are approximate and must be independently verified by the buyer. Buyer to obtain any required city inspections and/or certificate requirements. For safety purposes, all parties must sign a liability waiver prior to entering the property.
Key facts
- 9,583 sq ft lot
- 2 garage spots
- Built 1960
Property features AI
Exterior
- Parking: Attached 2-car garage
- Utilities: Public water; Public sewer
- Home design: Single-family residence; One level entry at ground level; Brick exterior; One story
- Construction: Brick construction; Block foundation; Asphalt roof; Built on one level
- Exterior features: Back yard with fencing; Fenced lot; Paved road access
Interior
- Bedrooms: 5 total rooms (includes bedrooms and living spaces)
- Bathrooms: 1 full bathroom; 1 half bathroom
- Heating & cooling: Forced air heating (natural gas); No central cooling
- Interior features: Full unfinished basement
Neighborhood map
What this means for you Summary
Snapshot
- This is a 3-bed/1.5-bath single-family listed at $50k.
Deal economics
- At list price, monthly cash flow is $1k ($14k/yr) — positive.
- The deal already cash-flows at list — no discount required.
- Meets the 1% rule at list price ($2k rent vs $50k).
- Cap rate 34.1% vs local median 10.0% in Detroit — top-decile yield for the area; either an underpriced asset or a hidden risk that comps aren't pricing in. Stress-test before assuming the spread holds.
Location & tenants
- Location reads 73/100 on livability (#218 in MI) — a middle-class / working-renter tenant base. Strengths: amenities A+, commute A+, cost of living A+; Watch: schools F, crime F, employment F.
- Detroit Public Schools Community District (urban): math 10% / reading 24% proficiency, ranked #499 of 540 in MI (top 92%) — low school quality limits family demand, transient renter base, plan for 1-2y turnover; 90% free/reduced lunch — lower-income household profile, screen leases tightly.
- Market conditions: Rents rising (+3.4%/yr); 349 active listings in the ZIP; 6 comparable units currently listed for rent nearby; rentals at typical pace (median 14d on market — plan ~3-4 weeks tenant-placement turnaround); 2,639 units permitted in Wayne County in 2024 (1,216 in 5+ unit buildings).
- This rent runs 39% of the median local income ($58k/yr) — at the standard rent-burdened threshold; future hikes will face affordability resistance.
Forward outlook
- Local home prices are declining (-3.0%/yr); year-one equity from $346 of loan paydown is wiped out by about $2k of value loss. Plan a longer hold.
- Wayne County population projected at -17% by 2050 — secular population decline; favor cash flow + early exit over multi-decade hold.
- At projected returns (-3.0% appreciation + 3.4% rent growth), your $14k cash investment doubles in ~2 years — after that, you're playing with house money.
Negotiation context
- Only 8 days on market — expect competitive offers; lowballing is unlikely to land.
- 2 sale attempts with the ask held roughly flat each time — persistent listings suggest the price (not the market) is what's stuck; bring a comps-based counter.
Questions for the listing agent
- Built in 1960 — when were the roof, HVAC, electrical panel, plumbing, and water heater last replaced?
- Is there a deadline driving the sale (1031 exchange, divorce, estate, relocation)? That informs how much negotiation room exists.
- Schools are F-rated, which usually means shorter tenancies and higher turnover. Who's the typical renter profile here, and what's been the actual vacancy rate?
- Crime grade is F in this area — have there been break-ins, vandalism, or insurance claims at this property in the last 3 years? What carrier currently insures it and at what premium?
- What's the average days-on-market for RENTAL listings here right now (not sales)? A rising rental-DOM trend means longer vacancies and softer asking-rent achievability than the comps imply.
- What's the recent tenant-quality profile in this submarket — average credit score on applications, eviction rate, late-payment / NSF rate, and stable-employment percentage? A property-management company in the area should have these aggregated.
- How much new for-sale + rental construction is in the pipeline within 1–3 miles? Heavy new supply typically softens prices + rents 12–24 months out; constrained supply supports both.
Investment metrics
- 1% rule
- 3.80% ✓
- Cap rate
- 34.06%
- Cash-on-cash
- 99.15%
- DSCR
- 5.41
- GRM
- 2.2
CMA / ARV
- ARV (median comp)
- $136,206
- List price
- $50,000
- Delta
- -63.29%
- Verdict
- UNDERPRICED
- Comps
- 20 within 1.0 mi
Show comp detail 12 sales within ~0.75 mi
| Address | Dist | Beds/Ba | Sqft | Sold | Price | $/sf | Match |
|---|---|---|---|---|---|---|---|
| 20525 Manor St | 0.59mi | 3/1.0 | 1,900 (+0%) | 5mo | $71,000 | $37 | 66 |
| 19943 Monte Vista St | 0.42mi | 3/2.0 | 1,760 (-7%) | 2mo | $185,000 | $105 | 65 |
| 19350 Griggs St | 0.42mi | 3/2.0 | 2,079 (+10%) | 1mo | $165,000 | $79 | 62 |
| 21040 Woodside Ave | 0.63mi | 3/1.0 | 1,858 (-2%) | 4mo | $145,000 | $78 | 61 |
| 20123 Appoline St | 0.59mi | 3/1.5 | 1,983 (+4%) | 5mo | $65,000 | $33 | 60 |
| 8620 W 7 Mile Rd | 0.61mi | 3/1.5 | 1,984 (+5%) | 6mo | $149,900 | $76 | 59 |
| 21025 Glen Lodge Rd | 0.62mi | 3/2.0 | 1,774 (-6%) | 2mo | $201,500 | $114 | 56 |
| 19994 Meyers Rd | 0.50mi | 3/1.0 | 1,700 (-10%) | 5mo | $45,000 | $26 | 54 |
| 20504 Cherrylawn St | 0.44mi | 3/2.0 | 2,150 (+13%) | 5mo | $125,000 | $58 | 51 |
| 20187 Appoline St | 0.60mi | 3/1.5 | 1,657 (-13%) | 4mo | $110,000 | $66 | 48 |
| 20242 Steel St | 0.65mi | 3/2.0 | 2,114 (+11%) | 1mo | $198,000 | $94 | 48 |
| 20121 Woodingham Dr | 0.52mi | 4/3.0 (+1) | 2,105 (+11%) | 2mo | $300,000 | $143 | 45 |
Match score weights: distance 35% · size 25% · config 20% · recency 20%. Top-matched comps best support the ARV.
Projected returns pro-forma
-3.0% appreciation · 3.44% rent growth · sell at horizon
- IRR
- —
- Equity multiple
- 5.75×
- Total profit
- $66,447
- Equity at exit
- $7,455
- IRR
- —
- Equity multiple
- 12.17×
- Total profit
- $156,347
- Equity at exit
- $4,323
Cash invested: $14,000 (down + closing). Projections, not guarantees.
Landlord ↔ Tenant lean methodology
- Overall (STATE)
- 62 Landlord-Friendly
- State Michigan
- 62 Landlord-Friendly · EVEN
- County
- — inherits STATE
- City
- — inherits STATE
ZIP-level market 48221
- Rents YoY
- 3.4%
- Active inventory
- 349
- Price-to-rent
- 2.2×
Monthly cashflow live
- Estimated rent
- $1,902 high interval (Pro) →
- Mortgage (P&I)
- −$262
- Tax est. 1.5%
- −$62 /mo · $750/yr
- Insurance
- −$21
- HOA
- −$0
- Vacancy / Maint / Mgmt
- −$399
- Net cashflow
- $1,157
Break-even live
Sensitivity live
| Price | -10% $1,191 | -5% $1,174 | +0% $1,157 | +5% $1,139 | +10% $1,122 |
|---|---|---|---|---|---|
| Rent | -10% $1,007 | -5% $1,082 | +0% $1,157 | +5% $1,232 | +10% $1,307 |
| Rate | -1.0pp $1,182 | -0.5pp $1,169 | base $1,157 | +0.5pp $1,144 | +1.0pp $1,131 |
UW: 25.0% down · 7.5% · 30yr · 1.5% tax · 5.0% vac · 8.0% maint · 8.0% mgmt
Financing live
Cash to close
- Down payment
- $12,500
- Closing costs
- $1,500
- Reserves months
- —
- Total cash needed
- —
Loan-product check · same deal, 3 products live
Conventional
25% down · 7.5% · 30yr
- Down + closing
- —
- Monthly P&I
- —
- Monthly cashflow
- —
- DSCR
- —
- Eligible?
- —
Personal DTI + credit; lowest rate.
DSCR
20% down · 8.5% · 30yr
- Down + closing
- —
- Monthly P&I
- —
- Monthly cashflow
- —
- DSCR
- —
- Eligible?
- —
No personal income docs; deal must DSCR.
Hard money
10% down · 12.0% · 12mo
- Down + closing
- —
- Monthly P&I
- —
- Monthly cashflow
- —
- DSCR
- —
- Eligible?
- —
Short-term bridge; refi at stabilization.
Rent comps 6 comps
| Address | Beds | Baths | Sqft | Rent | $/sqft | DOM | Units | Dist |
|---|---|---|---|---|---|---|---|---|
| 18935 Indiana St Detroit, MI | 3.0 | 1.0 | 1248 | $1,523 | $1.22 | 6d | 1 | 0.69mi |
| 631 Shasta Pl Ferndale, MI | 3.0 | 2.0 | 1317 | $2,100 | $1.59 | 45d | 1 | 1.05mi |
| 1557 Leroy St Ferndale, MI | 3.0 | 2.0 | 1380 | $2,523 | $1.83 | 6d | 1 | 1.20mi |
| 695 Livernois St Unit 1 Ferndale, MI | 2.0 | 2.0 | 1500 | $2,750 | $1.83 | 14d | 1 | 1.24mi |
| 20042 Freeland St Detroit, MI | 3.0 | 1.5 | 1445 | $1,300 | $0.90 | 0d | 1 | 1.31mi |
| 17530 Roselawn St Unit 1 Detroit, MI | 3.0 | 2.0 | 1600 | $2,000 | $1.25 | 26d | 1 | 1.37mi |
Listing history 2 events
-
2026-05-11$50,000 Active 765-char remark
Show marketing remark (765 chars)
Investor opportunity with major upside potential! This solid brick ranch offers approximately 1,900 square feet with a basement and attached garage, situated on a spacious lot with strong curb appeal. The interior condition reflects significant deferred maintenance and extensive cleanout/renovation needs, making this a true fixer-upper being sold strictly AS-IS. Interior photos show substantial debris, damaged walls and ceilings, and conditions requiring full buyer due diligence. All measurements, square footage, and data are approximate and must be independently verified by the buyer. Buyer to obtain any required city inspections and/or certificate requirements. For safety purposes, all parties must sign a liability waiver prior to entering the property.
ⓘ Source: listings_history table (triggers on properties + properties_extension) + one-shot
backfill from property_details.listing_events for pre-trigger history.
Climate risk First Street
- Flood 1/10 Low FEMA zone X (unshaded) · 0% chance over 30 yrs
- Wildfire 1/10 Low
- Heat 3/10 Moderate 7 d/yr ≥97°F today · 15 d/yr by 30 yrs out
- Wind 2/10 Low
- Air quality 3/10 Moderate 2 unhealthy d/yr today · 5 by 30 yrs out
Nearby sold comps map
Loading sold comps map…
Walkable amenities ~0.75 mi
Loading nearby amenities…
Taxation est. · year 1
- Rental income
- $22,820
- − Mortgage interest
- −$2,801
- − Property taxes
- −$750
- − Insurance
- −$250
- − Repairs & maintenance
- −$1,826
- − Management
- −$1,826
- − Depreciation
- −$1,455
- Taxable income
- $13,913
- Est. tax owed @ 24.0%
- −$3,339
- After-tax cash flow
- $10,542/yr
For passive investors: Depreciation is non-cash, so a rental often shows a tax loss while cash-flowing — sheltering income. Rental losses are passive: they offset passive income freely, and up to $25,000/yr can offset ordinary (W-2) income if you actively participate and your MAGI is under $100k (phasing out to $0 by $150k); unused losses carry forward. On sale, claimed depreciation is recaptured at up to 25%, and gains may owe capital-gains tax (a 1031 exchange can defer both). Figures are a year-1 estimate at your 24.0% rate — not tax advice; consult a CPA.
Schools (NCES district)
- District
- Detroit Public Schools Community District
- NCES district ID
- 2601103
- Math proficiency
- 10% ▼ -2.00%
- Reading proficiency
- 24% ▲ 6.00%
- Median HH income
- $25,815
- Composite
- 13.06/100
- National rank
- #9564
- State rank
- #499 of 540 in MI
Livability — Detroit
- Score
- 73/100
- State rank
- #218
- US rank
- #5427
Category grades
Schools grade is shown separately in the Schools card above.
Census & demographics
- Census place
- Detroit, MI
- County
- Wayne County · 1,562,939 people
- City population
- 572,865
- Metro
- Detroit-Warren-Dearborn, MI
- Population (ZIP)
- 41,392
- Household income
- $57,878
- Rent vs Own
- Severe rent burden
- 1646.0
Population outlook (Wayne County) Hauer SSP2
- Today (2025)
- 1,675,273 people
- By 2030
- 1,620,300 · -3.3%
- By 2040
- 1,502,341 · -10.3%
- By 2050
- 1,384,039 · -17.4%
- By 2075
- 1,124,592 · -32.9%
- By 2100
- 881,193 · -47.4%
Race, ethnicity, and origin ACS 2023
- Neighborhood character
- Predominantly Black (85%)
- Race & ethnicity
- Black 85% White 8% Two or more races 4% Asian 1%
- Common ancestry
- Romanian 1% Lithuanian 1%
- Foreign-born
- 2% · Canada
- Languages at home
- 97% English-only · Spanish 1% Other Indo-European 1%
Political lean MEDSL · Wayne
- 2024 margin
- Strong D (+29.0) · D 62.7% · R 33.7% · Other 3.6%
- 2008→2024 swing
- -20.5pp toward R · 2008: 49.5pp · 2024: 29.0pp
- All cycles
- 2024: D+29.0 2020: D+38.1 2016: D+37.3 2012: D+46.9 2008: D+49.5
Not yet ingested
- Civics
- —
Market trends
- HPI YoY
- ▼ -433.14%
- Current HPI
- 280.5434
- Rent YoY
- ▲ 3.44%
- Metro
- Detroit-Warren-Dearborn, MI
- State GDP YoY
- ▲ 1.37%
- F500 in state
- 28
Industry mix (Fortune 500 HQ in MI)
| Industry | F500 HQs | Revenue |
|---|---|---|
| Automotive Parts | 3 | $48B |
|
||
| Automotive | 2 | $372B |
|
||
| Chemicals | 1 | $45B |
|
||
| Automotive Retail | 1 | $29B |
|
||
| Healthcare / Medical Devices | 1 | $23B |
|
||
| Automotive Technology | 1 | $20B |
|
||
Price history
+0.0% since first listed4 events — show timeline
- 2026-05-19 Pending — MiRealSource-MiMLS
- 2026-05-19 Pending — REALCOMP
- 2026-05-11 Listed $50,000 REALCOMP
- 2026-05-11 Listed $50,000 MiRealSource-MiMLS
Property tax history
+3.7%/yrLatest (2025): $3,676 · +0.6% YoY. Source: county tax records.
Cash-flow waterfall
monthlySold comps — $/sqft
last 12 mo · ≤1 miLoading sold comps…