22302 Red River Dr · Houston, TX
Flood risk 3/10 · Minor
- FEMA flood zone
- X (unshaded)
- Chance of flooding over 30 yrs
- 0.2%
- Est. flood insurance / yr
- $507 – $1,088
Fire risk 1/10 · Minimal
- Est. fire insurance / yr
- $1,222 – $2,270
Heat risk 9/10 · Severe
- Hot days now (above 110°F)
- 7 days/yr
- Hot days in 30 yrs
- 21 days/yr
Wind risk 9/10 · Severe
- Chance of severe wind over 30 yrs
- 99.0%
Air-quality risk 2/10 · Minimal
- Unhealthy air days now
- 1 days/yr
- Unhealthy air days in 30 yrs
- 2 days/yr
Risk factors via First Street. Map © Google.
Why this score? — see what drove the D- grade
The composite is a weighted blend of 9 inputs, each scored 0–100. Each bar is that input's sub-score; the figure is the points it added to the 100-point composite (weight × sub-score).
- ARV discount +11.0/15.0
- Cash flow +8.6/30.0
- Schools +5.7/10.0
- Livability +3.7/5.0
- 1% rule +3.6/10.0
- Rent growth +2.5/5.0
- Condition / age +2.5/5.0
- DSCR +2.4/10.0
- Appreciation +0.0/10.0
$249,000
🖨 Deal sheet 📄 Offer letter ✓ Due diligence
Listing remarks MLS
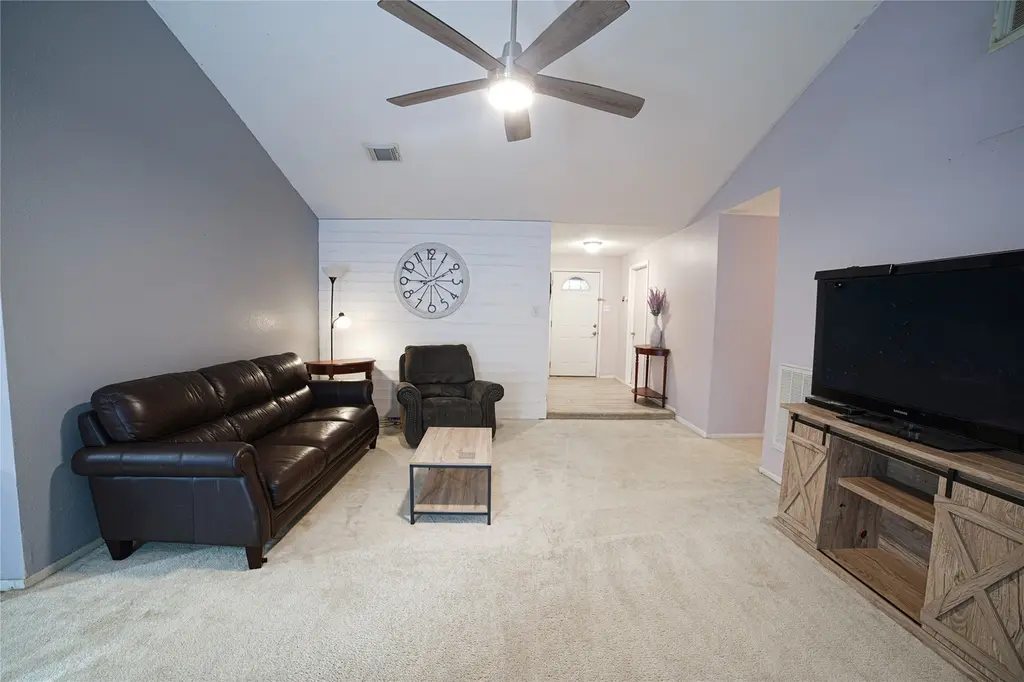
Location! Location! Location! This 4-bedroom, 2-bath Southwest-facing home is located in the established Cimarron subdivision. The functional layout features a living area open to the dining space, offering a comfortable flow for everyday living. French doors with built-in blinds offer access to the back patio. The kitchen includes an updated tile backsplash, canister lights, and pantry storage cabinet perfect for storing small appliances. Kitchen dining windows are "easy-clean" double pane and installed in 2021 per seller. The owner’s suite features neutral gray paint. Secondary bath includes just installed white bead board wainscoting paneling. Per seller: Roof replaced 2022, Hot water heater replaced March 2025, and Attic insulation added 2023. Washer, Dryer, Refrigerator included. Katy ISD schools. Conveniently located with easy access to major roads, shopping, and dining. Cimarron subdivision offers a community pool, park and tennis courts. Don’t miss this opportunity!
Key facts
- Cimarron subdivision
- 7,200 sq ft lot
- 2 garage spots
Tags
Neighborhood map
What this means for you Summary
Snapshot
- This is a 4-bed/2.0-bath single-family listed at $249k.
Deal economics
- At list price, monthly cash flow is $-214 ($-3k/yr) — negative.
- To cash-flow at today's rent, offer at most $211k (15.2% below list).
- To meet the 1% rule (rent ≥ 1% of price), the offer needs to be $215k (13.8% below list).
- Recommended offer: $211k (15.2% below list) — sets the bar for cash-flow.
- Cap rate 5.3% vs local median 3.2% in Houston — top-decile yield for the area; either an underpriced asset or a hidden risk that comps aren't pricing in. Stress-test before assuming the spread holds.
Location & tenants
- Location reads 74/100 on livability (#184 in TX, #4,771 nationally) — a middle-class / working-renter tenant base. Strengths: amenities A+, cost of living A+, housing A+; Watch: schools D, crime F.
- Katy ISD (suburban): math 61% / reading 63% proficiency, ranked #29 of 826 in TX (top 4%) — acceptable for families but not a draw, mixed tenant base, ~2y average lease.
- Market conditions: Rents soft (-0.1%/yr); 385 active listings in the ZIP; 26 comparable units currently listed for rent nearby; rentals leasing fast (median 13d on market — plan ~1-2 weeks tenant-placement turnaround); solid renter incomes; 29,883 units permitted in Harris County in 2024 (8,621 in 5+ unit buildings).
Forward outlook
- Local home prices are declining (-3.0%/yr); year-one equity from $2k of loan paydown is wiped out by about $7k of value loss. Plan a longer hold.
- Harris County population projected at +47% by 2050 — long-run rental-demand tailwind backs the buy-and-hold thesis.
Negotiation context
- It's been on market 67 days — a 6% lower offer ($234k) is reasonable based on typical stale-listing flexibility.
- Current owner paid $55k; list at $249k implies a 349% gain — meaningful room to come down on a strong offer.
Risks & watch-outs
- Climate carrying-cost: severe wind risk, 99% chance of damaging wind over 30y; extreme-heat days projected 7→21/yr by 2055 (HVAC capex compounding) — expect insurance premiums to compound above CPI over the hold.
Questions for the listing agent
- What do current leases actually rent for vs. the listed asking? Can we see a recent rent roll and the last 12 months of T-12 income?
- It's been on market 67 days. Have you received any prior offers? Is the seller open to a 15% concession, seller financing, or rate buy-down credit?
- Built in 1976 — when were the roof, HVAC, electrical panel, plumbing, and water heater last replaced?
- What does the HOA fee cover, when was the last increase, and are there any pending special assessments or reserve-fund shortfalls?
- Why hasn't it sold? Are there any deal-killer items the seller is aware of (foundation, flood, title, zoning, code violations)?
- Is there a deadline driving the sale (1031 exchange, divorce, estate, relocation)? That informs how much negotiation room exists.
- Schools are D-rated, which usually means shorter tenancies and higher turnover. Who's the typical renter profile here, and what's been the actual vacancy rate?
- Crime grade is F in this area — have there been break-ins, vandalism, or insurance claims at this property in the last 3 years? What carrier currently insures it and at what premium?
- The area grade is low — what's the realistic commute time and amenity access for the typical tenant pool here? Any planned neighborhood developments (good or bad) we should know about?
- What's the average days-on-market for RENTAL listings here right now (not sales)? A rising rental-DOM trend means longer vacancies and softer asking-rent achievability than the comps imply.
- What's the recent tenant-quality profile in this submarket — average credit score on applications, eviction rate, late-payment / NSF rate, and stable-employment percentage? A property-management company in the area should have these aggregated.
- How much new for-sale + rental construction is in the pipeline within 1–3 miles? Heavy new supply typically softens prices + rents 12–24 months out; constrained supply supports both.
Investment metrics
- 1% rule
- 0.86% ✗
- Cap rate
- 5.26%
- Cash-on-cash
- -3.68%
- DSCR
- 0.84
- GRM
- 9.7
CMA / ARV
- ARV (median comp)
- $269,874
- List price
- $249,000
- Delta
- -7.73%
- Verdict
- FAIR
- Comps
- 20 within 1.0 mi
Show comp detail 12 sales within ~0.75 mi
| Address | Dist | Beds/Ba | Sqft | Sold | Price | $/sf | Match |
|---|---|---|---|---|---|---|---|
| 22531 Smokey Hill Dr | 0.33mi | 3/2.0 (-1) | 1,673 (+2%) | 3mo | $289,000 | $173 | 74 |
| 22315 Indian Ridge Dr | 0.21mi | 3/2.0 (-1) | 1,496 (-9%) | 2mo | $220,000 | $147 | 69 |
| 834 Red Rock Canyon Dr | 0.26mi | 3/2.0 (-1) | 1,496 (-9%) | 1mo | $242,000 | $162 | 67 |
| 22210 Woodrose Dr | 0.30mi | 3/2.0 (-1) | 1,780 (+8%) | 1mo | $329,900 | $185 | 66 |
| 1115 Western Springs Dr | 0.52mi | 3/2.0 (-1) | 1,730 (+5%) | 2mo | $200,000 | $116 | 60 |
| 1106 Western Springs Dr | 0.54mi | 4/2.0 | 1,787 (+9%) | 0mo | $285,000 | $159 | 60 |
| 1043 Sierra Shadows Dr | 0.62mi | 3/2.0 (-1) | 1,564 (-5%) | 1mo | $245,000 | $157 | 58 |
| 510 Coppersmith Dr | 0.58mi | 3/2.0 (-1) | 1,746 (+6%) | 2mo | $235,000 | $135 | 56 |
| 214 Buckeye Dr | 0.73mi | 3/2.0 (-1) | 1,710 (+4%) | 2mo | $270,000 | $158 | 53 |
| 1206 Silver Morning Dr | 0.62mi | 3/2.0 (-1) | 1,484 (-10%) | 1mo | $305,995 | $206 | 49 |
| 1035 Golden Nugget Ct | 0.56mi | 3/2.0 (-1) | 1,436 (-13%) | 1mo | $265,000 | $185 | 47 |
| 1307 Grand Junction Dr | 0.75mi | 3/2.5 (-1) | 1,877 (+14%) | 2mo | $200,000 | $107 | 33 |
Match score weights: distance 35% · size 25% · config 20% · recency 20%. Top-matched comps best support the ARV.
Projected returns pro-forma
-3.0% appreciation · 0.0% rent growth · sell at horizon
- IRR
- -26.2%
- Equity multiple
- 0.14×
- Total profit
- $-60,110
- Equity at exit
- $37,127
- IRR
- -40.0%
- Equity multiple
- -0.34×
- Total profit
- $-93,579
- Equity at exit
- $21,529
Cash invested: $69,720 (down + closing). Projections, not guarantees.
Landlord ↔ Tenant lean methodology
- Overall (STATE)
- 87 Strongly Landlord-Friendly
- State Texas
- 87 Strongly Landlord-Friendly · R+5
- County
- — inherits STATE
- City
- — inherits STATE
ZIP-level market 77450
- Home prices YoY
- -28.1%
- Rents YoY
- -0.1%
- Active inventory
- 385
- Price-to-rent
- 9.7×
Monthly cashflow live
- Estimated rent
- $2,145 high interval (Pro) →
- Mortgage (P&I)
- −$1,306
- Tax from tax record
- −$460 /mo · $5,521/yr
- Insurance
- −$104
- HOA
- −$39
- Vacancy / Maint / Mgmt
- −$450
- Net cashflow
- $-214
Break-even live
UW: 25.0% down · 7.5% · 30yr · 1.5% tax · 5.0% vac · 8.0% maint · 8.0% mgmt
Financing live
Cash to close
- Down payment
- $62,250
- Closing costs
- $7,470
- Reserves months
- —
- Total cash needed
- —
Loan-product check · same deal, 3 products live
Conventional
25% down · 7.5% · 30yr
- Down + closing
- —
- Monthly P&I
- —
- Monthly cashflow
- —
- DSCR
- —
- Eligible?
- —
Personal DTI + credit; lowest rate.
DSCR
20% down · 8.5% · 30yr
- Down + closing
- —
- Monthly P&I
- —
- Monthly cashflow
- —
- DSCR
- —
- Eligible?
- —
No personal income docs; deal must DSCR.
Hard money
10% down · 12.0% · 12mo
- Down + closing
- —
- Monthly P&I
- —
- Monthly cashflow
- —
- DSCR
- —
- Eligible?
- —
Short-term bridge; refi at stabilization.
Rent comps 26 comps
| Address | Beds | Baths | Sqft | Rent | $/sqft | DOM | Units | Dist |
|---|---|---|---|---|---|---|---|---|
| 1046 Apache Falls Dr Katy, TX | 3.0 | 2.0 | 1805 | $2,400 | $1.33 | 24d | 1 | 0.35mi |
| 423 Pickford Dr Katy, TX | 3.0 | 2.0 | 1523 | $1,745 | $1.15 | 13d | 1 | 0.40mi |
| 918 Cheyenne Meadows Dr Katy, TX | 3.0 | 2.0 | 1802 | $1,821 | $1.01 | 22d | 1 | 0.44mi |
| 451 Gentilly Dr Katy, TX | 3.0 | 2.0 | 1818 | $1,875 | $1.03 | 5d | 1 | 0.50mi |
| 21610 Park Wick Ln Katy, TX | 4.0 | 2.5 | 2150 | $2,150 | $1.00 | 13d | 1 | 0.83mi |
| 21707 Park Bend Dr Katy, TX | 3.0 | 2.0 | 1500 | $2,300 | $1.53 | 44d | 1 | 0.90mi |
| 222 Mason Creek Dr Unit 3174 Katy, TX | 3.0 | 2.0 | 1235 | $1,978 | $1.60 | 12d | 1 | 0.96mi |
| 222 Mason Creek Dr Unit 255 Katy, TX | 3.0 | 2.0 | 1235 | $1,978 | $1.60 | 44d | 1 | 0.96mi |
| 222 Mason Creek Dr Unit 3047 Katy, TX | 3.0 | 2.0 | 1235 | $1,978 | $1.60 | 11d | 1 | 1.03mi |
| 21550 Provincial Blvd Katy, TX | 1.0–3.0 | 1.0–2.0 | 1024 | $2,099 | $2.05 | 3d | 39 | 1.09mi |
| 21542 Provincial Blvd Katy, TX | 3.0 | 2.0 | 1308 | $1,912 | $1.46 | 44d | 1 | 1.11mi |
| 21430 Park Brook Dr Katy, TX | 4.0 | 2.0 | 2248 | $2,300 | $1.02 | 19d | 1 | 1.17mi |
| 21540 Provincial Blvd Katy, TX | 1.0–3.0 | 1.0–2.0 | 1052 | $2,149 | $2.04 | 1d | 51 | 1.22mi |
| 23400 Kingsland Blvd Katy, TX | 1.0–3.0 | 1.0–2.0 | 1062 | $2,314 | $2.18 | 3d | 23 | 1.30mi |
| 1226 W Grand Pkwy S Unit 3112 Katy, TX | 3.0 | 2.0 | 1400 | $2,130 | $1.52 | 3d | 1 | 1.30mi |
| 1226 W Grand Pkwy S Unit 1259 Katy, TX | 3.0 | 2.0 | 1380 | $1,829 | $1.33 | 44d | 1 | 1.30mi |
| 1226 W Grand Pkwy S Unit 3174 Katy, TX | 3.0 | 2.0 | 1400 | $2,162 | $1.54 | 10d | 1 | 1.30mi |
| 21455 Merchants Way Katy, TX | 3.0 | 2.5 | 1405 | $2,137 | $1.52 | 44d | 1 | 1.31mi |
| 2002 S Mason Rd Unit 3112 Katy, TX | 3.0 | 2.0 | 1256 | $1,781 | $1.42 | 3d | 1 | 1.38mi |
| 2002 S Mason Rd Unit 3174 Katy, TX | 3.0 | 2.0 | 1256 | $1,813 | $1.44 | 10d | 1 | 1.38mi |
| 23615 Western Centre Dr Katy, TX | 1.0–3.0 | 1.0–2.0 | 1011 | $2,230 | $2.20 | 2d | 30 | 1.40mi |
| 23414 W Fernhurst Dr Katy, TX | 1.0–3.0 | 1.0–3.0 | 1352 | $3,099 | $2.29 | 2d | 26 | 1.42mi |
| 10 Cobia Dr Katy, TX | 3.0 | 2.0 | 1454 | $2,275 | $1.56 | 44d | 1 | 1.44mi |
| 1111 Falcon Park Dr Katy, TX | 1.0–3.0 | 1.0–2.0 | 1046 | $2,279 | $2.18 | 1d | 21 | 1.46mi |
| 2002 S Mason Rd Unit 2035 Katy, TX | 3.0 | 2.0 | 1256 | $1,930 | $1.54 | 44d | 1 | 1.46mi |
| 21407 Highland Knolls Dr Katy, TX | 3.0 | 2.0 | 1696 | $1,721 | $1.01 | 24d | 1 | 1.48mi |
HOA detail
- Monthly dues
- $39 · $468/yr
- Likely covers
- waterpool
Listing history 18 events
-
2026-06-18days on market $249,000 Active 67 DOM
-
2026-06-17days on market $249,000 Active 66 DOM
-
2026-06-16days on market $249,000 Active 65 DOM
-
2026-06-15days on market $249,000 Active 64 DOM
-
2026-06-13days on market $249,000 Active 62 DOM
-
2026-06-09days on market $249,000 Active 58 DOM
-
2026-06-08days on market $249,000 Active 57 DOM
-
2026-06-07pricedays on market $249,000 Active 56 DOM
-
2026-06-04days on market $257,500 Active 53 DOM
-
2026-06-03days on market $257,500 Active 52 DOM
-
2026-06-02days on market $257,500 Active 51 DOM
-
2026-06-01days on market $257,500 Active 50 DOM
-
2026-05-31days on market $257,500 Active 49 DOM
-
2026-05-13price $262,000 1011-char remark
Show marketing remark (1011 chars)
Location! Location! Location! This 4-bedroom, 2-bath Southwest-facing home is located in the established Cimarron subdivision. The functional layout features a living area open to the dining space, offering a comfortable flow for everyday living. French doors with built-in blinds offer access to the back patio. The kitchen includes an updated tile backsplash, canister lights, and pantry storage cabinet perfect for storing small appliances. Kitchen dining windows are "easy-clean" double pane and installed in 2021 per seller. The owner’s suite features neutral gray paint. Secondary bath includes just installed white bead board wainscoting paneling. Per seller: Roof replaced 2022, Hot water heater replaced March 2025, and Attic insulation added 2023. Washer, Dryer, Refrigerator included. Katy ISD schools. Conveniently located with easy access to major roads, shopping, and dining. Cimarron subdivision offers a community pool, park and tennis courts. Don’t miss this opportunity!
-
2026-04-12$268,500 Active 1011-char remark
Show marketing remark (1011 chars)
Location! Location! Location! This 4-bedroom, 2-bath Southwest-facing home is located in the established Cimarron subdivision. The functional layout features a living area open to the dining space, offering a comfortable flow for everyday living. French doors with built-in blinds offer access to the back patio. The kitchen includes an updated tile backsplash, canister lights, and pantry storage cabinet perfect for storing small appliances. Kitchen dining windows are "easy-clean" double pane and installed in 2021 per seller. The owner’s suite features neutral gray paint. Secondary bath includes just installed white bead board wainscoting paneling. Per seller: Roof replaced 2022, Hot water heater replaced March 2025, and Attic insulation added 2023. Washer, Dryer, Refrigerator included. Katy ISD schools. Conveniently located with easy access to major roads, shopping, and dining. Cimarron subdivision offers a community pool, park and tennis courts. Don’t miss this opportunity!
-
1999-07-13soldstatus
-
1998-07-27soldstatus
-
1988-07-01soldstatus $55,450
ⓘ Source: listings_history table (triggers on properties + properties_extension) + one-shot
backfill from property_details.listing_events for pre-trigger history.
Tax reassessment forecast TX · Resets to sale price
- Current annual tax
- $5,521 · $460/mo
- Projected year-2 tax
- $5,521 · $460/mo
- Expected delta
- $0/yr ($0/mo · 0.0%)
ⓘ Screening estimate from a state-policy table — verify with the county assessor before closing.
Climate risk First Street
- Flood 3/10 Moderate FEMA zone X (unshaded) · 20% chance over 30 yrs
- Wildfire 1/10 Low
- Heat 9/10 Extreme 7 d/yr ≥110°F today · 21 d/yr by 30 yrs out
- Wind 9/10 Extreme 99% chance of damaging wind over 30 yrs
- Air quality 2/10 Low 1 unhealthy d/yr today · 2 by 30 yrs out
Nearby sold comps map
Loading sold comps map…
Walkable amenities ~0.75 mi
Loading nearby amenities…
Taxation est. · year 1
- Rental income
- $25,743
- − Mortgage interest
- −$13,948
- − Property taxes
- −$5,521
- − Insurance
- −$1,245
- − Repairs & maintenance
- −$2,059
- − Management
- −$2,059
- − HOA
- −$468
- − Depreciation
- −$7,244
- Taxable loss
- −$6,802
- Est. tax savings @ 24.0%
- +$1,632
- After-tax cash flow
- $-934/yr
For passive investors: Depreciation is non-cash, so a rental often shows a tax loss while cash-flowing — sheltering income. Rental losses are passive: they offset passive income freely, and up to $25,000/yr can offset ordinary (W-2) income if you actively participate and your MAGI is under $100k (phasing out to $0 by $150k); unused losses carry forward. On sale, claimed depreciation is recaptured at up to 25%, and gains may owe capital-gains tax (a 1031 exchange can defer both). Figures are a year-1 estimate at your 24.0% rate — not tax advice; consult a CPA.
Schools (NCES district)
- District
- Katy ISD
- NCES district ID
- 4825170
- Math proficiency
- 61% ▼ -7.00%
- Reading proficiency
- 63% ▼ -3.00%
- Median HH income
- $90,312
- Composite
- 56.59/100
- National rank
- #1146
- State rank
- #29 of 826 in TX
Livability — Houston
- Score
- 74/100
- State rank
- #184
- US rank
- #4771
Category grades
Schools grade is shown separately in the Schools card above.
Census & demographics
- County
- Harris County · 4,702,590 people
- City population
- 3,226,434
- Metro
- Houston-The Woodlands-Sugar Land, TX
- Population (ZIP)
- 71,906
- Household income
- $106,402
- Rent vs Own
- Severe rent burden
- 2259.0
Population outlook (Harris County) Hauer SSP2
- Today (2025)
- 5,571,493 people
- By 2030
- 6,089,821 · +9.3%
- By 2040
- 7,142,806 · +28.2%
- By 2050
- 8,185,864 · +46.9%
- By 2075
- 10,574,329 · +89.8%
- By 2100
- 12,109,958 · +117.4%
Race, ethnicity, and origin ACS 2023
- Neighborhood character
- Diverse neighborhood (Simpson 0.65)
- Race & ethnicity
- White 53% Hispanic / Latino 22% Two or more races 14% Asian 12% Black 7%
- Hispanic origin (detail)
- Mexican 10% Cuban 1%
- Common ancestry
- Lithuanian 3% Italian 2% Slovak 2%
- Foreign-born
- 26% · Canada, China, Jamaica
- Languages at home
- 67% English-only · Spanish 15% Other Indo-European 5% Chinese 3%
Political lean MEDSL · Harris
- 2024 margin
- Lean D (+5.5) · D 52.0% · R 46.4% · Other 1.6%
- 2008→2024 swing
- +3.9pp toward D · 2008: 1.6pp · 2024: 5.5pp
- All cycles
- 2024: D+5.5 2020: D+13.3 2016: D+12.4 2012: D+0.1 2008: D+1.6
Not yet ingested
- Civics
- —
Market trends
- HPI YoY
- ▼ -95.50%
- Current HPI
- 244.792
- Rent YoY
- ▼ -0.13%
- Metro
- Houston-The Woodlands-Sugar Land, TX
- State GDP YoY
- ▲ 3.95%
- F500 in state
- 110
Industry mix (Fortune 500 HQ in TX)
| Industry | F500 HQs | Revenue |
|---|---|---|
| Energy | 16 | $1,198B |
|
||
| Technology | 5 | $198B |
|
||
| Engineering / Construction | 4 | $72B |
|
||
| Energy Services | 3 | $60B |
|
||
| Utilities | 3 | $41B |
|
||
| Healthcare | 2 | $330B |
|
||
Price history
+372.5% since first listed5 events — show timeline
- 2026-05-13 Price Changed $262,000 HARMLS
- 2026-04-12 Listed $268,500 HARMLS
- 1999-07-13 Sold (Public Records) — Public Records
- 1998-07-27 Sold (Public Records) — Public Records
- 1988-07-01 Sold (Public Records) $55,450 Public Records
Property tax history
+3.6%/yrLatest (2025): $5,521 · +2.1% YoY. Source: county tax records.
Cash-flow waterfall
monthlySold comps — $/sqft
last 12 mo · ≤1 miLoading sold comps…