 🏗️ New Construction
20965 W 217th St · Spring Hill, KS
Flood risk 1/10 · Minimal
- FEMA flood zone
- X (unshaded)
- Chance of flooding over 30 yrs
- 0.0%
- Est. flood insurance / yr
- $507 – $1,088
Fire risk 5/10 · Moderate
- Est. fire insurance / yr
- $1,154 – $2,142
Heat risk 4/10 · Minor
- Hot days now (above 107°F)
- 7 days/yr
- Hot days in 30 yrs
- 17 days/yr
Wind risk 2/10 · Minimal
- Chance of severe wind over 30 yrs
- —
Air-quality risk 2/10 · Minimal
- Unhealthy air days now
- 1 days/yr
- Unhealthy air days in 30 yrs
- 3 days/yr
Risk factors via First Street. Map © Google.
Why this score? — see what drove the F grade
The composite is a weighted blend of 9 inputs, each scored 0–100. Each bar is that input's sub-score; the figure is the points it added to the 100-point composite (weight × sub-score).
- ARV discount +7.5/15.0
- Cash flow +7.0/30.0
- Schools +4.0/10.0
- Livability +3.7/5.0
- Rent growth +2.5/5.0
- Condition / age +2.5/5.0
- 1% rule +1.9/10.0
- DSCR +1.2/10.0
- Appreciation +0.0/10.0
$398,990
🖨 Deal sheet 📄 Offer letter ✓ Due diligence
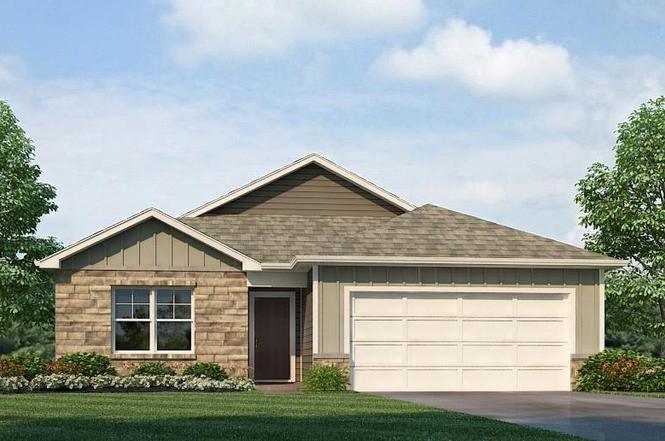
Listing remarks
* * * Sold before processed * * * Built by D. R. Horton Inc®, this stunning residence is our Harmony Plan, which combines superior craftsmanship with the latest in-home design, creating a space that’s as functional as it is beautiful. This 3-bedroom, 2-bathroom, Ranch style home is situated in Spring Hill, KS. Comfortably nestled in the heart of our Maplewood Valley community. As you step inside, you’ll be greeted by an abundance of natural light. The heart of this home is undoubtedly the Chefs Kitchen, featuring a Chef-inspired range, gorgeous 30-inch painted maple cabinets, beautiful white quartz countertops, and top-of-the-line Whirlpool® stainless steel applia
Key facts
- 8,976 sq ft lot
- 2 garage spots
- Built 2026
Neighborhood map
What this means for you Summary
Snapshot
- This is a 4-bed/3.0-bath land listed at $399k.
Deal economics
- At list price, monthly cash flow is $-585 ($-7k/yr) — negative.
- To cash-flow at today's rent, offer at most $314k (21.2% below list).
- To meet the 1% rule (rent ≥ 1% of price), the offer needs to be $275k (31.1% below list).
- Recommended offer: $275k (31.1% below list) — sets the bar for 1% rule.
- Cap rate 4.5% vs local median 3.5% in Spring Hill — meaningfully above typical; check what's discounted (condition, days-on-market, listing class) to confirm the premium yield is real.
Location & tenants
- Location reads 73/100 on livability (#93 in KS) — a middle-class / working-renter tenant base. Strengths: employment A+, housing A+, crime A; Watch: health & safety C-, amenities F, commute F.
- Spring Hill (rural): math 40% / reading 47% proficiency, ranked #11 of 169 in KS (top 6%) — families likely to look elsewhere, expect single-tenant / working-renter base with shorter leases; only 16% free/reduced lunch — higher-income household profile.
- Zoned schools: Spring Hill Elementary School (math 41% / reading 48%, grade F, #228 of 684 statewide, top 38%, 611 students, 31% FRL); Spring Hill High School (math 27% / reading 47%, grade F, #26 of 327 statewide, top 8%, 983 students, 18% FRL).
- Market conditions: 411 active listings in the ZIP; 3 comparable units currently listed for rent nearby; rentals leasing fast (median 2d on market — plan ~1-2 weeks tenant-placement turnaround); high-income renter base; 100 units permitted in Miami County in 2024 (0 in 5+ unit buildings).
Forward outlook
- Local home prices are declining (-3.0%/yr); year-one equity from $3k of loan paydown is wiped out by about $12k of value loss. Plan a longer hold.
- Miami County population projected at -15% by 2050 — secular population decline; favor cash flow + early exit over multi-decade hold.
Negotiation context
- Only 1 days on market — expect competitive offers; lowballing is unlikely to land.
Risks & watch-outs
- Climate carrying-cost: moderate wildfire risk — expect insurance premiums to compound above CPI over the hold.
Questions for the listing agent
- What do current leases actually rent for vs. the listed asking? Can we see a recent rent roll and the last 12 months of T-12 income?
- Is there a deadline driving the sale (1031 exchange, divorce, estate, relocation)? That informs how much negotiation room exists.
- The area grade is low — what's the realistic commute time and amenity access for the typical tenant pool here? Any planned neighborhood developments (good or bad) we should know about?
- What's the average days-on-market for RENTAL listings here right now (not sales)? A rising rental-DOM trend means longer vacancies and softer asking-rent achievability than the comps imply.
- What's the recent tenant-quality profile in this submarket — average credit score on applications, eviction rate, late-payment / NSF rate, and stable-employment percentage? A property-management company in the area should have these aggregated.
- How much new for-sale + rental construction is in the pipeline within 1–3 miles? Heavy new supply typically softens prices + rents 12–24 months out; constrained supply supports both.
Investment metrics
- 1% rule
- 0.69% ✗
- Cap rate
- 4.53%
- Cash-on-cash
- -6.29%
- DSCR
- 0.72
- GRM
- 12.1
CMA / ARV
No comps found within radius.
Projected returns pro-forma
-3.0% appreciation · 3.0% rent growth · sell at horizon
- IRR
- -27.1%
- Equity multiple
- 0.09×
- Total profit
- $-101,885
- Equity at exit
- $59,491
- IRR
- -24.9%
- Equity multiple
- -0.22×
- Total profit
- $-136,546
- Equity at exit
- $34,497
Cash invested: $111,717 (down + closing). Projections, not guarantees.
Landlord ↔ Tenant lean methodology
- Overall (STATE)
- 83 Strongly Landlord-Friendly
- State Kansas
- 83 Strongly Landlord-Friendly · R+10
- County
- — inherits STATE
- City
- — inherits STATE
ZIP-level market 66083
- Home prices YoY
- -32.9%
- Active inventory
- 411
- Price-to-rent
- 12.1×
Monthly cashflow live
- Estimated rent
- $2,750 medium interval (Pro) →
- Mortgage (P&I)
- −$2,092
- Tax est. 1.5%
- −$499 /mo · $5,985/yr
- Insurance
- −$166
- HOA
- −$0
- Vacancy / Maint / Mgmt
- −$577
- Net cashflow
- $-585
Break-even live
UW: 25.0% down · 7.5% · 30yr · 1.5% tax · 5.0% vac · 8.0% maint · 8.0% mgmt
Financing live
Cash to close
- Down payment
- $99,748
- Closing costs
- $11,970
- Reserves months
- —
- Total cash needed
- —
Loan-product check · same deal, 3 products live
Conventional
25% down · 7.5% · 30yr
- Down + closing
- —
- Monthly P&I
- —
- Monthly cashflow
- —
- DSCR
- —
- Eligible?
- —
Personal DTI + credit; lowest rate.
DSCR
20% down · 8.5% · 30yr
- Down + closing
- —
- Monthly P&I
- —
- Monthly cashflow
- —
- DSCR
- —
- Eligible?
- —
No personal income docs; deal must DSCR.
Hard money
10% down · 12.0% · 12mo
- Down + closing
- —
- Monthly P&I
- —
- Monthly cashflow
- —
- DSCR
- —
- Eligible?
- —
Short-term bridge; refi at stabilization.
Rent comps 3 comps
| Address | Beds | Baths | Sqft | Rent | $/sqft | DOM | Units | Dist |
|---|---|---|---|---|---|---|---|---|
| 21203 W 216th Ter Spring Hill, KS | 2.0–4.0 | 2.5–3.5 | 1536 | $2,395 | $1.56 | 1d | 20 | 0.24mi |
| 21743 Johnson Ct Spring Hill, KS | 3.0 | 2.5 | 1781 | $2,600 | $1.46 | 1d | 1 | 0.74mi |
| 201 E Hale St Spring Hill, KS | 4.0 | 2.0 | 2300 | $2,051 | $0.89 | 12d | 1 | 0.85mi |
Listing history 2 events
-
2026-02-02status Pending
-
2026-02-02$398,990 Active
ⓘ Source: listings_history table (triggers on properties + properties_extension) + one-shot
backfill from property_details.listing_events for pre-trigger history.
Climate risk First Street
- Flood 1/10 Low FEMA zone X (unshaded) · 0% chance over 30 yrs
- Wildfire 5/10 Major
- Heat 4/10 Moderate 7 d/yr ≥107°F today · 17 d/yr by 30 yrs out
- Wind 2/10 Low
- Air quality 2/10 Low 1 unhealthy d/yr today · 3 by 30 yrs out
Nearby sold comps map
Loading sold comps map…
Walkable amenities ~0.75 mi
Loading nearby amenities…
Taxation est. · year 1
- Rental income
- $32,994
- − Mortgage interest
- −$22,350
- − Property taxes
- −$5,985
- − Insurance
- −$1,995
- − Repairs & maintenance
- −$2,640
- − Management
- −$2,640
- − Depreciation
- −$11,607
- Taxable loss
- −$14,221
- Est. tax savings @ 24.0%
- +$3,413
- After-tax cash flow
- $-3,609/yr
For passive investors: Depreciation is non-cash, so a rental often shows a tax loss while cash-flowing — sheltering income. Rental losses are passive: they offset passive income freely, and up to $25,000/yr can offset ordinary (W-2) income if you actively participate and your MAGI is under $100k (phasing out to $0 by $150k); unused losses carry forward. On sale, claimed depreciation is recaptured at up to 25%, and gains may owe capital-gains tax (a 1031 exchange can defer both). Figures are a year-1 estimate at your 24.0% rate — not tax advice; consult a CPA.
Schools (NCES district)
- District
- Spring Hill
- NCES district ID
- 2011850
- Math proficiency
- 40% ▬ 0.00%
- Reading proficiency
- 47% ▲ 5.00%
- Median HH income
- $80,172
- Composite
- 40.26/100
- National rank
- #3767
- State rank
- #11 of 169 in KS
Livability — Spring Hill
- Score
- 73/100
- State rank
- #93
- US rank
- #5370
Category grades
Schools grade is shown separately in the Schools card above.
Census & demographics
- Census place
- Spring Hill, KS
- County
- Johnson County · 574,662 people
- City population
- 13,011
- Metro
- Kansas City, MO-KS
- Population (ZIP)
- 13,011
- Household income
- $116,791
- Rent vs Own
- Severe rent burden
- 274.0
Population outlook (Miami County) Hauer SSP2
- Today (2025)
- 32,162 people
- By 2030
- 31,472 · -2.1%
- By 2040
- 29,611 · -7.9%
- By 2050
- 27,277 · -15.2%
- By 2075
- 22,738 · -29.3%
- By 2100
- 18,479 · -42.5%
Race, ethnicity, and origin ACS 2023
- Neighborhood character
- Predominantly White (90%)
- Race & ethnicity
- White 90% Two or more races 5% Hispanic / Latino 5%
- Common ancestry
- Lithuanian 3% Italian 3% Portuguese 2%
- Foreign-born
- 2% · Canada
- Languages at home
- 97% English-only · Spanish 2% Other Indo-European 1%
Political lean MEDSL · Miami
- 2024 margin
- Solid R (+39.5) · D 29.3% · R 68.8% · Other 1.9%
- 2008→2024 swing
- -15.8pp toward R · 2008: -23.7pp · 2024: -39.5pp
- All cycles
- 2024: R+39.5 2020: R+39.6 2016: R+40.0 2012: R+34.8 2008: R+23.7
Not yet ingested
- Civics
- —
Market trends
- HPI YoY
- ▼ -130.12%
- Current HPI
- 265.6494
- Rent YoY
- —
- Metro
- Kansas City, MO-KS
- State GDP YoY
- —
- F500 in state
- 0
Price history
2 events — show timeline
- 2026-02-02 Pending — Heartland MLS as Distributed by MLS Grid
- 2026-02-02 Listed $398,990 Heartland MLS as Distributed by MLS Grid
Property tax history
-16.8%/yrLatest (2025): $355 · +10.3% YoY. Source: county tax records.
Cash-flow waterfall
monthlySold comps — $/sqft
last 12 mo · ≤1 miLoading sold comps…