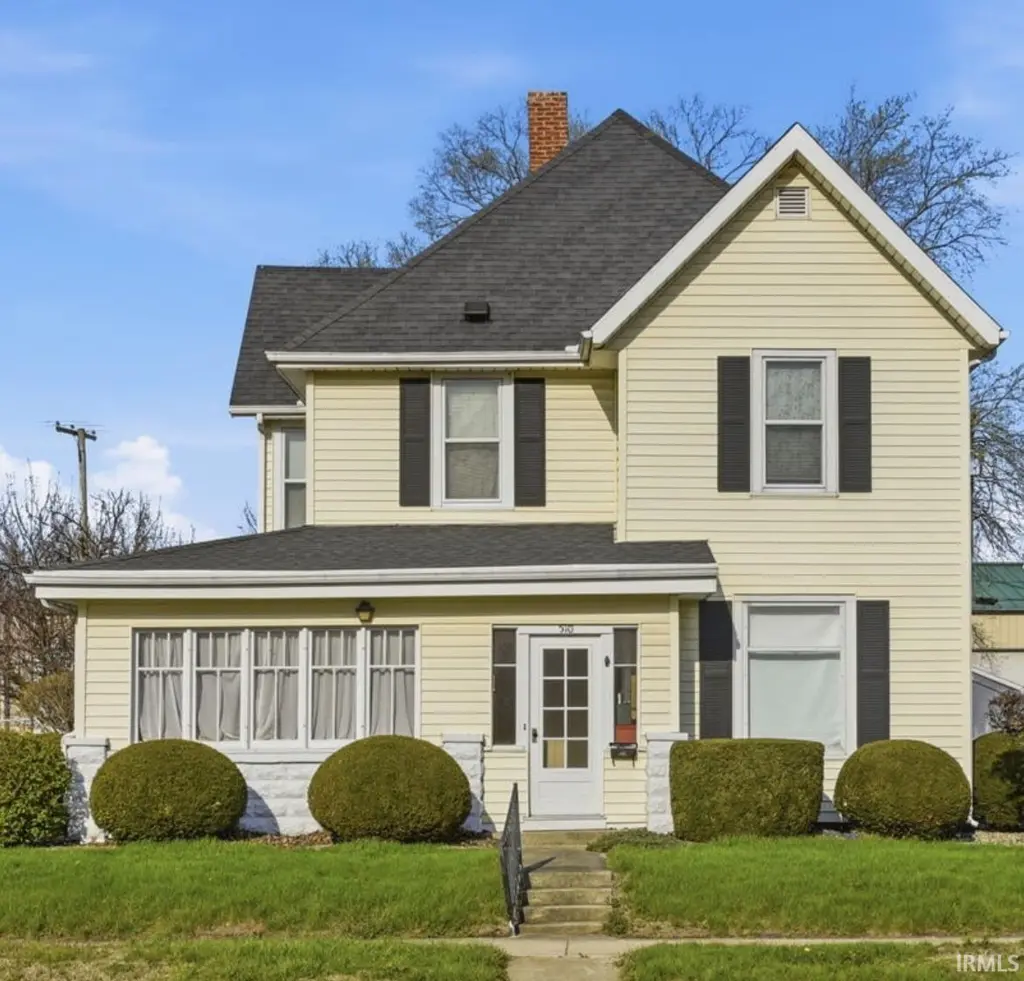
510 N Illinois St · Monticello, IN
Flood risk 1/10 · Minimal
- FEMA flood zone
- X (unshaded)
- Chance of flooding over 30 yrs
- 0.0%
- Est. flood insurance / yr
- $473 – $860
Fire risk 1/10 · Minimal
- Est. fire insurance / yr
- $717 – $1,331
Heat risk 3/10 · Minor
- Hot days now (above 101°F)
- 7 days/yr
- Hot days in 30 yrs
- 17 days/yr
Wind risk 2/10 · Minimal
- Chance of severe wind over 30 yrs
- —
Air-quality risk 2/10 · Minimal
- Unhealthy air days now
- 1 days/yr
- Unhealthy air days in 30 yrs
- 2 days/yr
Risk factors via First Street. Map © Google.
Why this score? — see what drove the B- grade
The composite is a weighted blend of 9 inputs, each scored 0–100. Each bar is that input's sub-score; the figure is the points it added to the 100-point composite (weight × sub-score).
- Cash flow +26.0/30.0
- ARV discount +15.0/15.0
- DSCR +8.8/10.0
- 1% rule +6.5/10.0
- Schools +3.6/10.0
- Livability +3.6/5.0
- Rent growth +2.5/5.0
- Condition / age +2.5/5.0
- Appreciation +0.0/10.0
$129,000
🖨 Deal sheet 📄 Offer letter ✓ Due diligence
Listing remarks MLS
This 4-bedroom, 2 bath home offers tons of potential with a flexible layout and unique features. The 4th bedroom upstairs includes a small kitchen area—perfect for separate living space, guest quarters, or can easily be converted back into a traditional bedroom. Ideal for investors, flippers, or buyers ready to add their personal touch. Located near popular attractions like Lake Shafer, Lake Freeman, and Indiana Beach. Many possibilities to make this property shine! Estate Sale Property Sold As Is. Sq. Ft. taken from County records.
Key facts
- Guest quarters
- Lake freeman
- Flexible layout
Tags
Neighborhood map
What this means for you Summary
Snapshot
- This is a 4-bed/1.0-bath single-family listed at $129k.
Deal economics
- At list price, monthly cash flow is $322 ($4k/yr) — positive.
- The deal already cash-flows at list — no discount required.
- Meets the 1% rule at list price ($1k rent vs $129k).
- Recommended offer: $127k (1.5% below list) — sets the bar for market timing.
- Cap rate 9.3% vs local median 3.3% in Monticello — top-decile yield for the area; either an underpriced asset or a hidden risk that comps aren't pricing in. Stress-test before assuming the spread holds.
Location & tenants
- Location reads 71/100 on livability (#141 in IN) — a middle-class / working-renter tenant base. Strengths: cost of living A+, housing A+, health & safety A+; Watch: amenities F, commute F, employment F.
- Twin Lakes School Corporation (town): math 39% / reading 46% proficiency, ranked #116 of 301 in IN (top 38%) — families likely to look elsewhere, expect single-tenant / working-renter base with shorter leases.
- Market conditions: 220 active listings in the ZIP; 47 units permitted in White County in 2024 (0 in 5+ unit buildings).
Forward outlook
- Local home prices are declining (-3.0%/yr); year-one equity from $892 of loan paydown is wiped out by about $4k of value loss. Plan a longer hold.
- White County population projected at -19% by 2050 — secular population decline; favor cash flow + early exit over multi-decade hold.
Negotiation context
- It's been on market 24 days — a 2% lower offer ($127k) is reasonable based on typical stale-listing flexibility.
Risks & watch-outs
- Watch-outs: built in 1900 — expect roof / HVAC / electrical / plumbing capex.
Questions for the listing agent
- Built in 1900 — when were the roof, HVAC, electrical panel, plumbing, and water heater last replaced?
- Is there a deadline driving the sale (1031 exchange, divorce, estate, relocation)? That informs how much negotiation room exists.
- What's the average days-on-market for RENTAL listings here right now (not sales)? A rising rental-DOM trend means longer vacancies and softer asking-rent achievability than the comps imply.
- What's the recent tenant-quality profile in this submarket — average credit score on applications, eviction rate, late-payment / NSF rate, and stable-employment percentage? A property-management company in the area should have these aggregated.
- How much new for-sale + rental construction is in the pipeline within 1–3 miles? Heavy new supply typically softens prices + rents 12–24 months out; constrained supply supports both.
Investment metrics
- 1% rule
- 1.15% ✓
- Cap rate
- 9.29%
- Cash-on-cash
- 10.70%
- DSCR
- 1.48
- GRM
- 7.2
CMA / ARV
- ARV (median comp)
- $206,766
- List price
- $129,000
- Delta
- -37.61%
- Verdict
- UNDERPRICED
- Comps
- 20 within 1.0 mi
Show comp detail 12 sales within ~0.75 mi
| Address | Dist | Beds/Ba | Sqft | Sold | Price | $/sf | Match |
|---|---|---|---|---|---|---|---|
| 510 N Illinois St | 0.00mi | 4/2.0 | 1,792 (0%) | 1mo | $110,000 | $61 | 95 |
| 141 E Pierce Cir | 0.17mi | 4/2.0 | 1,872 (+4%) | 5mo | $220,000 | $118 | 76 |
| 415 W Marion St | 0.29mi | 4/2.0 | 1,900 (+6%) | 12mo | $215,000 | $113 | 62 |
| 808 E Pine Ln | 0.32mi | 5/2.0 (+1) | 1,635 (-9%) | 3mo | $205,000 | $125 | 59 |
| 1004 Calley Dr | 0.48mi | 3/2.0 (-1) | 1,824 (+2%) | 10mo | $195,400 | $107 | 57 |
| 415 W Jefferson St | 0.58mi | 4/2.0 | 1,812 (+1%) | 12mo | $180,000 | $99 | 57 |
| 212 Miller Mnr | 0.53mi | 4/2.0 | 1,758 (-2%) | 16mo | $218,000 | $124 | 55 |
| 6114 E Hickory Ridge Ct | 0.69mi | 4/2.0 | 1,828 (+2%) | 8mo | $285,000 | $156 | 54 |
| 959 Mitchell Ave | 0.60mi | 3/2.0 (-1) | 1,664 (-7%) | 6mo | $123,000 | $74 | 46 |
| 1101 Quentin Ave | 0.61mi | 3/2.5 (-1) | 1,648 (-8%) | 6mo | $190,000 | $115 | 42 |
| 616 W Foster St | 0.40mi | 3/2.0 (-1) | 1,554 (-13%) | 12mo | $278,000 | $179 | 40 |
| 1120 Bluewater Dr | 0.75mi | 3/2.0 (-1) | 1,616 (-10%) | 13mo | $241,000 | $149 | 29 |
Match score weights: distance 35% · size 25% · config 20% · recency 20%. Top-matched comps best support the ARV.
Projected returns pro-forma
-3.0% appreciation · 3.0% rent growth · sell at horizon
- IRR
- -0.3%
- Equity multiple
- 0.99×
- Total profit
- $-393
- Equity at exit
- $19,234
- IRR
- 9.4%
- Equity multiple
- 1.72×
- Total profit
- $26,064
- Equity at exit
- $11,154
Cash invested: $36,120 (down + closing). Projections, not guarantees.
Landlord ↔ Tenant lean methodology
- Overall (STATE)
- 90 Strongly Landlord-Friendly
- State Indiana
- 90 Strongly Landlord-Friendly · R+11
- County
- — inherits STATE
- City
- — inherits STATE
ZIP-level market 47960
- Home prices YoY
- -17.8%
- Active inventory
- 220
- Price-to-rent
- 7.2×
Monthly cashflow live
- Estimated rent
- $1,487 medium interval (Pro) →
- Mortgage (P&I)
- −$676
- Tax from tax record
- −$122 /mo · $1,470/yr
- Insurance
- −$54
- HOA
- −$0
- Vacancy / Maint / Mgmt
- −$312
- Net cashflow
- $322
Break-even live
UW: 25.0% down · 7.5% · 30yr · 1.5% tax · 5.0% vac · 8.0% maint · 8.0% mgmt
Financing live
Cash to close
- Down payment
- $32,250
- Closing costs
- $3,870
- Reserves months
- —
- Total cash needed
- —
Loan-product check · same deal, 3 products live
Conventional
25% down · 7.5% · 30yr
- Down + closing
- —
- Monthly P&I
- —
- Monthly cashflow
- —
- DSCR
- —
- Eligible?
- —
Personal DTI + credit; lowest rate.
DSCR
20% down · 8.5% · 30yr
- Down + closing
- —
- Monthly P&I
- —
- Monthly cashflow
- —
- DSCR
- —
- Eligible?
- —
No personal income docs; deal must DSCR.
Hard money
10% down · 12.0% · 12mo
- Down + closing
- —
- Monthly P&I
- —
- Monthly cashflow
- —
- DSCR
- —
- Eligible?
- —
Short-term bridge; refi at stabilization.
Listing history 3 events
-
2026-05-05status Pending 544-char remark
Show marketing remark (544 chars)
This 4-bedroom, 2 bath home offers tons of potential with a flexible layout and unique features. The 4th bedroom upstairs includes a small kitchen area—perfect for separate living space, guest quarters, or can easily be converted back into a traditional bedroom. Ideal for investors, flippers, or buyers ready to add their personal touch. Located near popular attractions like Lake Shafer, Lake Freeman, and Indiana Beach. Many possibilities to make this property shine! Estate Sale Property Sold As Is. Sq. Ft. taken from County records.
-
2026-05-01price $129,000 544-char remark
Show marketing remark (544 chars)
This 4-bedroom, 2 bath home offers tons of potential with a flexible layout and unique features. The 4th bedroom upstairs includes a small kitchen area—perfect for separate living space, guest quarters, or can easily be converted back into a traditional bedroom. Ideal for investors, flippers, or buyers ready to add their personal touch. Located near popular attractions like Lake Shafer, Lake Freeman, and Indiana Beach. Many possibilities to make this property shine! Estate Sale Property Sold As Is. Sq. Ft. taken from County records.
-
2026-04-11$149,000 Active 544-char remark
Show marketing remark (544 chars)
This 4-bedroom, 2 bath home offers tons of potential with a flexible layout and unique features. The 4th bedroom upstairs includes a small kitchen area—perfect for separate living space, guest quarters, or can easily be converted back into a traditional bedroom. Ideal for investors, flippers, or buyers ready to add their personal touch. Located near popular attractions like Lake Shafer, Lake Freeman, and Indiana Beach. Many possibilities to make this property shine! Estate Sale Property Sold As Is. Sq. Ft. taken from County records.
ⓘ Source: listings_history table (triggers on properties + properties_extension) + one-shot
backfill from property_details.listing_events for pre-trigger history.
Tax reassessment forecast IN · Partial reset (capped growth)
- Current annual tax
- $1,470 · $122/mo
- Projected year-2 tax
- $1,470 · $122/mo
- Expected delta
- $0/yr ($0/mo · 0.0%)
ⓘ Screening estimate from a state-policy table — verify with the county assessor before closing.
Climate risk First Street
- Flood 1/10 Low FEMA zone X (unshaded) · 0% chance over 30 yrs
- Wildfire 1/10 Low
- Heat 3/10 Moderate 7 d/yr ≥101°F today · 17 d/yr by 30 yrs out
- Wind 2/10 Low
- Air quality 2/10 Low 1 unhealthy d/yr today · 2 by 30 yrs out
Nearby sold comps map
Loading sold comps map…
Walkable amenities ~0.75 mi
Loading nearby amenities…
Taxation est. · year 1
- Rental income
- $17,844
- − Mortgage interest
- −$7,226
- − Property taxes
- −$1,470
- − Insurance
- −$645
- − Repairs & maintenance
- −$1,428
- − Management
- −$1,428
- − Depreciation
- −$3,753
- Taxable income
- $1,896
- Est. tax owed @ 24.0%
- −$455
- After-tax cash flow
- $3,410/yr
For passive investors: Depreciation is non-cash, so a rental often shows a tax loss while cash-flowing — sheltering income. Rental losses are passive: they offset passive income freely, and up to $25,000/yr can offset ordinary (W-2) income if you actively participate and your MAGI is under $100k (phasing out to $0 by $150k); unused losses carry forward. On sale, claimed depreciation is recaptured at up to 25%, and gains may owe capital-gains tax (a 1031 exchange can defer both). Figures are a year-1 estimate at your 24.0% rate — not tax advice; consult a CPA.
Schools (NCES district)
- District
- Twin Lakes School Corporation
- NCES district ID
- 1811580
- Math proficiency
- 39% ▼ -10.00%
- Reading proficiency
- 46% ▼ -5.00%
- Median HH income
- $48,963
- Composite
- 36.44/100
- National rank
- #4666
- State rank
- #116 of 301 in IN
Livability — Monticello
- Score
- 71/100
- State rank
- #141
- US rank
- #7278
Category grades
Schools grade is shown separately in the Schools card above.
Census & demographics
- Census place
- Monticello, IN
- Population (ZIP)
- 15,313
Population outlook (White County) Hauer SSP2
- Today (2025)
- 23,006 people
- By 2030
- 22,204 · -3.5%
- By 2040
- 20,441 · -11.1%
- By 2050
- 18,711 · -18.7%
- By 2075
- 14,989 · -34.8%
- By 2100
- 10,896 · -52.6%
Race, ethnicity, and origin ACS 2023
- Neighborhood character
- Predominantly White (92%)
- Race & ethnicity
- White 92% Hispanic / Latino 6% Two or more races 3%
- Hispanic origin (detail)
- Mexican 5%
- Common ancestry
- Romanian 4% Iranian 3% Lithuanian 2%
- Foreign-born
- 4% · Canada
- Languages at home
- 94% English-only · Spanish 4%
Political lean MEDSL · White
- 2024 margin
- Solid R (+45.0) · D 26.4% · R 71.4% · Other 2.2%
- 2008→2024 swing
- -36.7pp toward R · 2008: -8.3pp · 2024: -45.0pp
- All cycles
- 2024: R+45.0 2020: R+44.1 2016: R+42.9 2012: R+23.6 2008: R+8.3
Not yet ingested
- Civics
- —
Market trends
- HPI YoY
- ▼ -52.85%
- Current HPI
- 243.8468
- Rent YoY
- —
- Metro
- —
- State GDP YoY
- ▲ 2.90%
- F500 in state
- 18
Industry mix (Fortune 500 HQ in IN)
| Industry | F500 HQs | Revenue |
|---|---|---|
| Industrial Machinery | 2 | $37B |
|
||
| Healthcare | 1 | $177B |
|
||
| Pharmaceuticals | 1 | $45B |
|
||
| Metals / Steel | 1 | $18B |
|
||
| Agriculture | 1 | $17B |
|
||
| Packaging | 1 | $12B |
|
||
Price history
-13.4% since first listed3 events — show timeline
- 2026-05-05 Pending — IRMLS
- 2026-05-01 Price Changed $129,000 IRMLS
- 2026-04-11 Listed $149,000 IRMLS
Property tax history
+6.9%/yrLatest (2024): $1,470 · +36.5% YoY. Source: county tax records.
Cash-flow waterfall
monthlySold comps — $/sqft
last 12 mo · ≤1 miLoading sold comps…