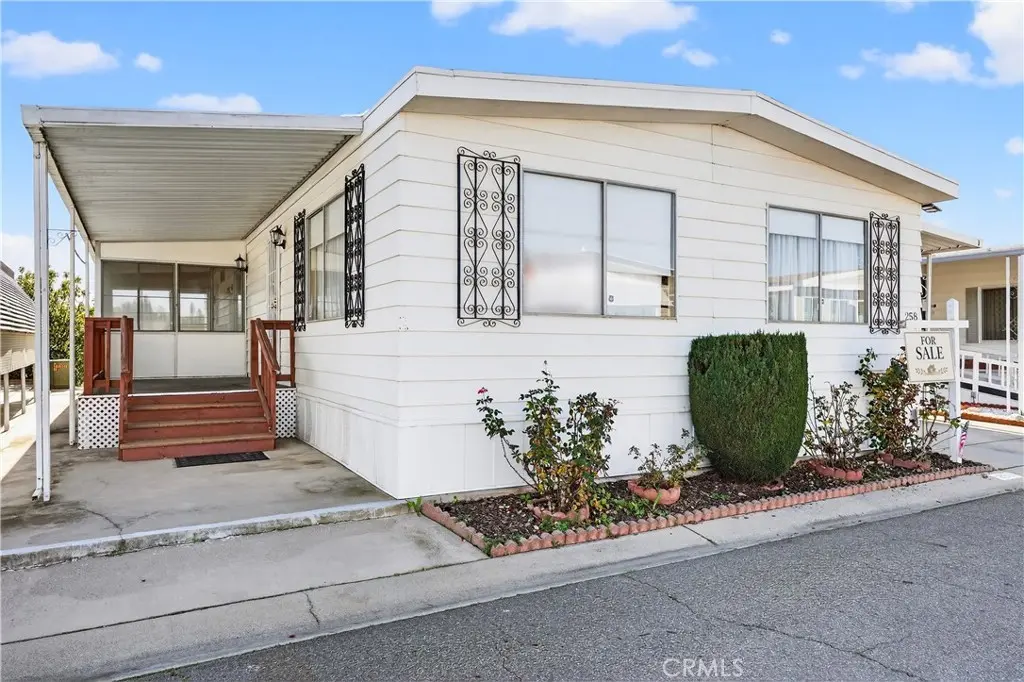
1001 Lambert Rd #258 · La Habra, CA
Flood risk 1/10 · Minimal
- FEMA flood zone
- X (unshaded)
- Chance of flooding over 30 yrs
- 0.0%
- Est. flood insurance / yr
- $507 – $1,088
Fire risk 1/10 · Minimal
- Est. fire insurance / yr
- $659 – $1,223
Heat risk 6/10 · Moderate
- Hot days now (above 96°F)
- 7 days/yr
- Hot days in 30 yrs
- 21 days/yr
Wind risk 1/10 · Minimal
- Chance of severe wind over 30 yrs
- —
Air-quality risk 5/10 · Moderate
- Unhealthy air days now
- 9 days/yr
- Unhealthy air days in 30 yrs
- 10 days/yr
Risk factors via First Street. Map © Google.
Why this score? — see what drove the B+ grade
The composite is a weighted blend of 9 inputs, each scored 0–100. Each bar is that input's sub-score; the figure is the points it added to the 100-point composite (weight × sub-score).
- Cash flow +30.0/30.0
- ARV discount +15.0/15.0
- 1% rule +10.0/10.0
- DSCR +10.0/10.0
- Schools +5.1/10.0
- Rent growth +3.3/5.0
- Livability +3.2/5.0
- Condition / age +2.5/5.0
- Appreciation +0.0/10.0
$158,000
🖨 Deal sheet 📄 Offer letter ✓ Due diligence
Listing remarks
ATTENTION "BUYERS": WHAT A DEAL!!!ABSOLUTELY A HOME SWEET HOME OF A DEAL!!!! The Only way to describe this Great Deal of a Mobile Home located in La Habra's 55+Senior Community in "Friendly Village-La Habra", Is that it is only ONE OF A KIND!!! A True Deal, A 2 bedroom, 2 bathroom (1 Full Bath and 3/4 Bath) Air Conditioning/Heating Units, . A Nice Size Covered Front Porch for those tranquil Morning or Afternoon Sittings to Enjoy the Fresh Air and or Cooling Evenings. Note: Actual Living Space Is 1368 Sq. Feet, though adjacent Enclosed Sunroom is Over 200 Sq. Feet. , making it Over 1568+ of Actual Usable Living Space if you would like to Use the Adjacent Enclosed Sunro
Key facts
- 2 parking spots
- Community pool
- Built 1971
Property features AI
Finance
- Other: Pets: call for details; Body type listed as double; Lot-level/flat
- Financial info: Land lease applies (monthly land lease: $1,654)
- HOA & community: Located in a senior community; Community features include golf course, dog park, street lighting, and park; Park name: Friendly Village La Habra; Manager approval required for residency
Exterior
- Parking: Attached carport (2 carport spaces); Concrete driveway with level access; Two total parking spaces; Access via maintained paved city streets
- Security: Carbon monoxide detector(s); Smoke detector(s)
- Utilities: Private water source; Water connected / water available; Sewer connected / sewer available (status listed as unknown for sewer/septic); Natural gas connected / available; Electricity connected / standard electric available; Cable available
- Home design: Mobile home (model: WESTWIND); Single story; Faces north; Mobile home remains on site; Additions/alterations noted
- Construction: Aluminum exterior construction; Aluminum skirt; Pier jacks foundation (see remarks); Roof: see remarks
- Exterior features: Covered tile porch/patio; Patio home setting; Patio and porch; Community pool (in-ground); Two storage sheds on property; Park nearby
Interior
- Kitchen: Gas cooktop; Gas oven; Range/stove hood; Dishwasher; Garbage disposal; Refrigerator; Water heater unit (gas water heater)
- Bedrooms: Primary bedroom on main floor; All bedrooms located on the lower/main level
- Flooring: Tile; Vinyl; Carpet
- Bathrooms: One full bathroom; One 3/4 bathroom; Main-floor full bath; Walk-in shower and shower-in-tub; Linen closet/storage
- Heating & cooling: Central heating (natural gas, central furnace); Central cooling
- Interior features: Unfurnished; Ceiling fan(s); Sliding glass door(s); Drapes/curtains; Storage space; Resident manager on site; Carbon monoxide and smoke detectors; One-level entry (main floor entry at front door); Spa access (community spa)
- Laundry & utility: Dedicated laundry room; Washer included; Dryer included; Washer hookup
Neighborhood map
What this means for you Summary
Snapshot
- This is a 2-bed/2.0-bath manufactured listed at $158k.
Deal economics
- At list price, monthly cash flow is $2k ($18k/yr) — positive.
- The deal already cash-flows at list — no discount required.
- Meets the 1% rule at list price ($3k rent vs $158k).
- Recommended offer: $153k (3.0% below list) — sets the bar for market timing.
- Cap rate 17.9% vs local median 2.1% in La Habra — top-decile yield for the area; either an underpriced asset or a hidden risk that comps aren't pricing in. Stress-test before assuming the spread holds.
Location & tenants
- Location reads 65/100 on livability (#384 in CA) — a middle-class / working-renter tenant base. Strengths: commute A+, employment A+; Watch: schools D+, crime D+, health & safety D+.
- Fullerton Joint Union High (suburban): math 51% / reading 66% proficiency, ranked #82 of 517 in CA (top 16%) — acceptable for families but not a draw, mixed tenant base, ~2y average lease.
- Market conditions: Rents rising (+3.4%/yr); 139 active listings in the ZIP; 14 comparable units currently listed for rent nearby; rentals leasing fast (median 1d on market — plan ~1-2 weeks tenant-placement turnaround); solid renter incomes; 6,974 units permitted in Orange County in 2024 (3,839 in 5+ unit buildings).
- This rent runs 38% of the median local income ($104k/yr) — at the standard rent-burdened threshold; future hikes will face affordability resistance.
Forward outlook
- Local home prices are declining (-3.0%/yr); year-one equity from $1k of loan paydown is wiped out by about $5k of value loss. Plan a longer hold.
- Orange County population projected at +14% by 2050 — modest demand growth; plan on rents tracking national, not racing it.
- At projected returns (-3.0% appreciation + 3.4% rent growth), your $44k cash investment doubles in ~3 years — after that, you're playing with house money.
Negotiation context
- It's been on market 51 days — a 3% lower offer ($153k) is reasonable based on typical stale-listing flexibility.
- 4 sale attempts since 21y ago with the ask held roughly flat each time — persistent listings suggest the price (not the market) is what's stuck; bring a comps-based counter.
Risks & watch-outs
- Climate carrying-cost: extreme-heat days projected 7→21/yr by 2055 (HVAC capex compounding) — expect insurance premiums to compound above CPI over the hold.
Questions for the listing agent
- It's been on market 51 days. Have you received any prior offers? Is the seller open to a 3% concession, seller financing, or rate buy-down credit?
- Built in 1971 — when were the roof, HVAC, electrical panel, plumbing, and water heater last replaced?
- Is there a deadline driving the sale (1031 exchange, divorce, estate, relocation)? That informs how much negotiation room exists.
- Schools are D-rated, which usually means shorter tenancies and higher turnover. Who's the typical renter profile here, and what's been the actual vacancy rate?
- Crime grade is D in this area — have there been break-ins, vandalism, or insurance claims at this property in the last 3 years? What carrier currently insures it and at what premium?
- What's the average days-on-market for RENTAL listings here right now (not sales)? A rising rental-DOM trend means longer vacancies and softer asking-rent achievability than the comps imply.
- What's the recent tenant-quality profile in this submarket — average credit score on applications, eviction rate, late-payment / NSF rate, and stable-employment percentage? A property-management company in the area should have these aggregated.
- How much new for-sale + rental construction is in the pipeline within 1–3 miles? Heavy new supply typically softens prices + rents 12–24 months out; constrained supply supports both.
Investment metrics
- 1% rule
- 2.10% ✓
- Cap rate
- 17.92%
- Cash-on-cash
- 41.52%
- DSCR
- 2.85
- GRM
- 4.0
CMA / ARV
- ARV (on-the-fly)
- $211,680
- Comps found
- 12
Show comp detail 12 sales within ~0.75 mi
| Address | Dist | Beds/Ba | Sqft | Sold | Price | $/sf | Match |
|---|---|---|---|---|---|---|---|
| 1001 W Lambert Rd #87 | 0.00mi | 2/2.0 | 1,440 (-8%) | 6mo | $220,000 | $153 | 81 |
| 1001 W Lambert Rd #327 | 0.00mi | 2/2.0 | 1,440 (-8%) | 11mo | $120,000 | $83 | 77 |
| 1001 W Lambert Rd #159 | 0.02mi | 2/2.0 | 1,440 (-8%) | 13mo | $190,000 | $132 | 74 |
| 1001 W Lambert Rd #20 | 0.14mi | 2/2.0 | 1,440 (-8%) | 8mo | $105,000 | $73 | 73 |
| 1001 Lambert Rd Spc 35 | 0.19mi | 2/2.0 | 1,464 (-7%) | 10mo | $169,000 | $115 | 72 |
| 1001 W Lambert Rd #37 | 0.21mi | 2/2.0 | 1,440 (-8%) | 8mo | $93,000 | $65 | 69 |
| 1001 W Lambert Rd #100 | 0.19mi | 2/2.0 | 1,400 (-11%) | 12mo | $189,000 | $135 | 63 |
| 1001 W Lambert Rd #213 | 0.00mi | 2/2.0 | 1,350 (-14%) | 16mo | $185,000 | $137 | 63 |
| 1001 W Lambert Rd #148 | 0.00mi | 2/2.0 | 1,344 (-14%) | 18mo | $187,900 | $140 | 61 |
| 1001 W Lambert Rd | 0.19mi | 2/2.0 | 1,344 (-14%) | 19mo | $178,000 | $132 | 52 |
| 1001 W Lambert Rd #314 | 0.19mi | 3/2.0 (+1) | 1,344 (-14%) | 15mo | $195,000 | $145 | 50 |
| 1750 W Lambert Rd #112 | 0.51mi | 3/2.0 (+1) | 1,344 (-14%) | 6mo | $230,000 | $171 | 43 |
Match score weights: distance 35% · size 25% · config 20% · recency 20%. Top-matched comps best support the ARV.
Projected returns pro-forma
-3.0% appreciation · 3.38% rent growth · sell at horizon
- IRR
- 38.6%
- Equity multiple
- 2.66×
- Total profit
- $73,218
- Equity at exit
- $23,558
- IRR
- 45.2%
- Equity multiple
- 5.40×
- Total profit
- $194,772
- Equity at exit
- $13,661
Cash invested: $44,240 (down + closing). Projections, not guarantees.
Landlord ↔ Tenant lean methodology
- Overall (STATE)
- 18 Strongly Tenant-Friendly
- State California
- 18 Strongly Tenant-Friendly · D+13
- County
- — inherits STATE
- City
- — inherits STATE
ZIP-level market 90631
- Rents YoY
- 3.4%
- Active inventory
- 139
- Price-to-rent
- 4.0×
Monthly cashflow live
- Estimated rent
- $3,320 high interval (Pro) →
- Mortgage (P&I)
- −$829
- Tax est. 1.5%
- −$198 /mo · $2,370/yr
- Insurance
- −$66
- HOA
- −$0
- Vacancy / Maint / Mgmt
- −$697
- Net cashflow
- $1,531
Break-even live
UW: 25.0% down · 7.5% · 30yr · 1.5% tax · 5.0% vac · 8.0% maint · 8.0% mgmt
Financing live
Cash to close
- Down payment
- $39,500
- Closing costs
- $4,740
- Reserves months
- —
- Total cash needed
- —
Loan-product check · same deal, 3 products live
Conventional
25% down · 7.5% · 30yr
- Down + closing
- —
- Monthly P&I
- —
- Monthly cashflow
- —
- DSCR
- —
- Eligible?
- —
Personal DTI + credit; lowest rate.
DSCR
20% down · 8.5% · 30yr
- Down + closing
- —
- Monthly P&I
- —
- Monthly cashflow
- —
- DSCR
- —
- Eligible?
- —
No personal income docs; deal must DSCR.
Hard money
10% down · 12.0% · 12mo
- Down + closing
- —
- Monthly P&I
- —
- Monthly cashflow
- —
- DSCR
- —
- Eligible?
- —
Short-term bridge; refi at stabilization.
Rent comps 14 comps
| Address | Beds | Baths | Sqft | Rent | $/sqft | DOM | Units | Dist |
|---|---|---|---|---|---|---|---|---|
| 1210 W Lambert Rd La Habra, CA | 2.0 | 1.0 | 1053 | $2,550 | $2.42 | 1d | 1 | 0.30mi |
| 971 S Idaho St La Habra, CA | 3.0 | 2.0 | 1073 | $3,100 | $2.89 | 1d | 1 | 0.57mi |
| 200 W Olive Ave La Habra, CA | 2.0 | 2.0 | 1050 | $2,950 | $2.81 | 1d | 1 | 0.57mi |
| 101 W Olive Ave Unit A La Habra, CA | 3.0 | 1.5 | 1100 | $2,950 | $2.68 | 17d | 1 | 0.61mi |
| 515 W Florence Ave #1 La Habra, CA | 3.0 | 2.0 | 1264 | $4,500 | $3.56 | 1d | 1 | 0.63mi |
| 1600 El Dorado Ave La Habra, CA | 3.0 | 2.0 | 1546 | $4,200 | $2.72 | 10d | 1 | 0.66mi |
| 1151 S Walnut St La Habra, CA | 1.0–2.0 | 1.0–2.0 | 1251 | $2,985 | $2.39 | 1d | 2 | 0.68mi |
| 951 S Beach Blvd La Habra, CA | 1.0–2.0 | 1.0–2.0 | 988 | $3,586 | $3.63 | 1d | 13 | 0.84mi |
| 930 W Country Ter Unit 34 La Habra, CA | 3.0 | 2.5 | 1493 | $3,800 | $2.55 | 1d | 1 | 0.85mi |
| 650 Mardina Way La Habra, CA | 3.0 | 2.0 | 1681 | $3,850 | $2.29 | 1d | 1 | 1.05mi |
| 1131 Urell Dr La Habra, CA | 3.0 | 2.0 | 1574 | $3,950 | $2.51 | 11d | 1 | 1.22mi |
| 11833 Pounds Ave Whittier, CA | 3.0 | 2.0 | 1260 | $4,000 | $3.17 | 1d | 1 | 1.35mi |
| 1236 Devonshire Ln La Habra, CA | 3.0 | 2.5 | 1175 | $3,895 | $3.31 | 1d | 1 | 1.36mi |
| 1501 S Beach Blvd La Habra, CA | 1.0–2.0 | 1.0–2.0 | 955 | $3,467 | $3.63 | 1d | 15 | 1.46mi |
Listing history 22 events
-
2026-06-18days on market $158,000 Active 51 DOM
-
2026-06-17days on market $158,000 Active 50 DOM
-
2026-06-16days on market $158,000 Active 49 DOM
-
2026-06-15days on market $158,000 Active 48 DOM
-
2026-06-13days on market $158,000 Active 46 DOM
-
2026-06-09days on market $158,000 Active 42 DOM
-
2026-06-08days on market $158,000 Active 41 DOM
-
2026-06-07days on market $158,000 Active 40 DOM
-
2026-06-04days on market $158,000 Active 37 DOM
-
2026-06-03days on market $158,000 Active 36 DOM
-
2026-06-02days on market $158,000 Active 35 DOM
-
2026-06-01days on market $158,000 Active 34 DOM
-
2026-05-31days on market $158,000 Active 33 DOM
-
2026-04-29status Active
-
2026-04-28historical
-
2026-04-28$158,000
-
2026-04-27historical
-
2026-03-19price $158,000
-
2026-02-11price $169,000
-
2026-01-27$179,900 Active
-
2005-09-26historical
-
2005-03-25$86,000
ⓘ Source: listings_history table (triggers on properties + properties_extension) + one-shot
backfill from property_details.listing_events for pre-trigger history.
Climate risk First Street
- Flood 1/10 Low FEMA zone X (unshaded) · 0% chance over 30 yrs
- Wildfire 1/10 Low
- Heat 6/10 Major 7 d/yr ≥96°F today · 21 d/yr by 30 yrs out
- Wind 1/10 Low
- Air quality 5/10 Major 9 unhealthy d/yr today · 10 by 30 yrs out
Nearby sold comps map
Loading sold comps map…
Walkable amenities ~0.75 mi
Loading nearby amenities…
Taxation est. · year 1
- Rental income
- $39,838
- − Mortgage interest
- −$8,850
- − Property taxes
- −$2,370
- − Insurance
- −$790
- − Repairs & maintenance
- −$3,187
- − Management
- −$3,187
- − Depreciation
- −$4,596
- Taxable income
- $16,857
- Est. tax owed @ 24.0%
- −$4,046
- After-tax cash flow
- $14,324/yr
For passive investors: Depreciation is non-cash, so a rental often shows a tax loss while cash-flowing — sheltering income. Rental losses are passive: they offset passive income freely, and up to $25,000/yr can offset ordinary (W-2) income if you actively participate and your MAGI is under $100k (phasing out to $0 by $150k); unused losses carry forward. On sale, claimed depreciation is recaptured at up to 25%, and gains may owe capital-gains tax (a 1031 exchange can defer both). Figures are a year-1 estimate at your 24.0% rate — not tax advice; consult a CPA.
Schools (NCES district)
- District
- Fullerton Joint Union High
- NCES district ID
- 0614760
- Math proficiency
- 51% ▲ 7.00%
- Reading proficiency
- 66% ▲ 1.00%
- Median HH income
- $66,666
- Composite
- 51.37/100
- National rank
- #1735
- State rank
- #82 of 517 in CA
Livability — La Habra
- Score
- 65/100
- State rank
- #384
- US rank
- #13097
Category grades
Schools grade is shown separately in the Schools card above.
Census & demographics
- Census place
- La Habra, CA
- County
- Orange County · 3,096,323 people
- City population
- 68,309
- Metro
- Los Angeles-Long Beach-Anaheim, CA
- Population (ZIP)
- 68,309
- Household income
- $104,251
- Rent vs Own
- Severe rent burden
- 2093.0
Population outlook (Orange County) Hauer SSP2
- Today (2025)
- 3,477,456 people
- By 2030
- 3,613,117 · +3.9%
- By 2040
- 3,835,945 · +10.3%
- By 2050
- 3,968,736 · +14.1%
- By 2075
- 4,097,053 · +17.8%
- By 2100
- 3,903,633 · +12.3%
Race, ethnicity, and origin ACS 2023
- Neighborhood character
- Diverse neighborhood (Simpson 0.60)
- Race & ethnicity
- Hispanic / Latino 56% White 26% Two or more races 22% Asian 12% Black 2% Native American 2%
- Hispanic origin (detail)
- Mexican 49%
- Common ancestry
- Lithuanian 1% Italian 1% Slovak 1%
- Foreign-born
- 25% · Canada, South Korea, China
- Languages at home
- 53% English-only · Spanish 36% Korean 4% Chinese 2%
Political lean MEDSL · Orange
- 2024 margin
- Toss-up / Even · D 49.7% · R 47.1% · Other 3.2%
- 2008→2024 swing
- +5.2pp toward D · 2008: -2.6pp · 2024: 2.6pp
- All cycles
- 2024: D+2.6 2020: D+9.0 2016: D+7.7 2012: R+8.3 2008: R+2.6
Not yet ingested
- Civics
- —
Market trends
- HPI YoY
- ▼ -757.47%
- Current HPI
- 399.4947
- Rent YoY
- ▲ 3.38%
- Metro
- Los Angeles-Long Beach-Anaheim, CA
- State GDP YoY
- ▲ 3.21%
- F500 in state
- 116
Industry mix (Fortune 500 HQ in CA)
| Industry | F500 HQs | Revenue |
|---|---|---|
| Technology | 27 | $1,492B |
|
||
| Financial Services | 3 | $174B |
|
||
| Retail | 3 | $44B |
|
||
| Insurance | 3 | $26B |
|
||
| Media / Entertainment | 2 | $115B |
|
||
| Pharmaceuticals / Biotech | 2 | $62B |
|
||
Price history
+83.7% since first listed9 events — show timeline
- 2026-04-29 Relisted — CRMLS
- 2026-04-28 Listed $158,000 CRMLS
- 2026-04-28 Listing Removed — CRMLS
- 2026-04-27 Listing Removed — CRMLS
- 2026-03-19 Price Changed $158,000 CRMLS
- 2026-02-11 Price Changed $169,000 CRMLS
- 2026-01-27 Listed $179,900 CRMLS
- 2005-09-26 Listing Removed — CRMLS
- 2005-03-25 Listed $86,000 CRMLS
Property tax history
-4.9%/yrLatest (2025): $18 · +2.4% YoY. Source: county tax records.
Cash-flow waterfall
monthlySold comps — $/sqft
last 12 mo · ≤1 miLoading sold comps…