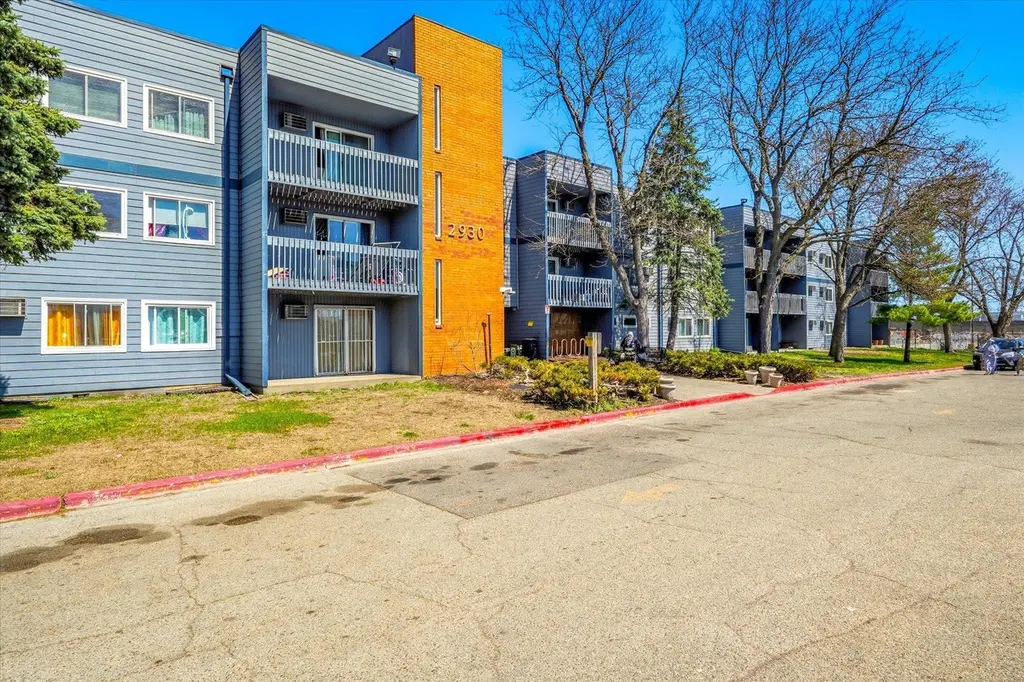
2930 Blaisdell Ave #128 · Minneapolis, MN
Flood risk 1/10 · Minimal
- FEMA flood zone
- X (unshaded)
- Chance of flooding over 30 yrs
- 0.0%
- Est. flood insurance / yr
- $507 – $1,088
Fire risk 1/10 · Minimal
- Est. fire insurance / yr
- $888 – $1,650
Heat risk 2/10 · Minimal
- Hot days now (above 99°F)
- 7 days/yr
- Hot days in 30 yrs
- 14 days/yr
Wind risk 2/10 · Minimal
- Chance of severe wind over 30 yrs
- —
Air-quality risk 2/10 · Minimal
- Unhealthy air days now
- 1 days/yr
- Unhealthy air days in 30 yrs
- 1 days/yr
Risk factors via First Street. Map © Google.
Why this score? — see what drove the C grade
The composite is a weighted blend of 9 inputs, each scored 0–100. Each bar is that input's sub-score; the figure is the points it added to the 100-point composite (weight × sub-score).
- Cash flow +19.4/30.0
- 1% rule +10.0/10.0
- ARV discount +7.5/15.0
- DSCR +6.1/10.0
- Livability +3.9/5.0
- Rent growth +3.7/5.0
- Schools +3.5/10.0
- Condition / age +2.5/5.0
- Appreciation +0.0/10.0
$75,900
🖨 Deal sheet 📄 Offer letter ✓ Due diligence
Listing remarks MLS
First floor 1 bedroom 1 bath condo with outdoor access to green space - move in condition walking distance to Eat Street - shops, restaurants and public transportation. Off street parking, affordable housing at its best.
Key facts
- Refreshed bathroom
- Green courtyard
- On-site laundry
Tags
Property features AI
Finance
- Other: Association amenities include elevator(s) and lobby entrance
- HOA & community: Part of Westport Property association; Monthly association fee (includes controlled access, gas, hazard insurance, heating, lawn care, grounds maintenance, parking, professional management, sewer, shared amenities, snow removal, water); Shared community rooms including community room and media room
Exterior
- Parking: Secured parking lot
- Security: 24-hour guard; Controlled access; Security lighting; Lobby entrance; Elevator access
- Utilities: City water connected; City sewer connected; Other fuel source
- Home design: Residential attached property; One level
- Construction: Foundation area approximately 880 (building area total 880)
- Exterior features: Stone exterior; Patio (12x6); Public transit within six blocks; Medium tree coverage
Interior
- Kitchen: Dishwasher; Range; Refrigerator; Exhaust fan
- Bedrooms: One bedroom on the main level (15x12)
- Bathrooms: One full bathroom on the main floor
- Heating & cooling: Baseboard heating (hot water); Wall unit cooling
- Interior features: Main floor primary bedroom; Main floor laundry; No basement; Accessible features including 36+ inch doors, 42+ inch hallways, and an installed elevator
- Laundry & utility: Main floor laundry
Neighborhood map
What this means for you Summary
Snapshot
- This is a 1-bed/1.0-bath condo listed at $76k.
Deal economics
- At list price, monthly cash flow is $85 ($1k/yr) — positive.
- The deal already cash-flows at list — no discount required.
- Meets the 1% rule at list price ($1k rent vs $76k).
- Recommended offer: $74k (3.0% below list) — sets the bar for market timing.
- Cap rate 7.6% vs local median 3.1% in Minneapolis — top-decile yield for the area; either an underpriced asset or a hidden risk that comps aren't pricing in. Stress-test before assuming the spread holds.
Location & tenants
- Location reads 78/100 on livability (#110 in MN, #2,525 nationally) — a middle-class / working-renter tenant base. Strengths: amenities A+, commute A+, housing A+; Watch: cost of living C-, crime F.
- Minneapolis Public School District (urban): math 35% / reading 46% proficiency, ranked #217 of 301 in MN (top 72%) — families likely to look elsewhere, expect single-tenant / working-renter base with shorter leases.
- Market conditions: Rents rising fast (+4.8%/yr); 175 active listings in the ZIP; 40 comparable units currently listed for rent nearby; rentals at typical pace (median 18d on market — plan ~3-4 weeks tenant-placement turnaround); 4,651 units permitted in Hennepin County in 2024 (2,443 in 5+ unit buildings).
Forward outlook
- Local home prices are declining (-3.0%/yr); year-one equity from $525 of loan paydown is wiped out by about $2k of value loss. Plan a longer hold.
- Hennepin County population projected at +30% by 2050 — long-run rental-demand tailwind backs the buy-and-hold thesis.
Negotiation context
- It's been on market 41 days — a 3% lower offer ($74k) is reasonable based on typical stale-listing flexibility.
- 3 sale attempts since 7y ago with the ask held roughly flat each time — persistent listings suggest the price (not the market) is what's stuck; bring a comps-based counter.
Risks & watch-outs
- Watch-outs: HOA is 34% of rent.
Questions for the listing agent
- It's been on market 41 days. Have you received any prior offers? Is the seller open to a 3% concession, seller financing, or rate buy-down credit?
- What does the HOA fee cover, when was the last increase, and are there any pending special assessments or reserve-fund shortfalls?
- Any open or pending special assessments — roof, HVAC, plumbing, elevator, façade? What's the per-unit balance and payoff schedule, and is the seller paying it off at close or rolling it to the buyer?
- Is there a deadline driving the sale (1031 exchange, divorce, estate, relocation)? That informs how much negotiation room exists.
- Crime grade is F in this area — have there been break-ins, vandalism, or insurance claims at this property in the last 3 years? What carrier currently insures it and at what premium?
- What's the average days-on-market for RENTAL listings here right now (not sales)? A rising rental-DOM trend means longer vacancies and softer asking-rent achievability than the comps imply.
- What's the recent tenant-quality profile in this submarket — average credit score on applications, eviction rate, late-payment / NSF rate, and stable-employment percentage? A property-management company in the area should have these aggregated.
- How much new apartment / multifamily construction is in the pipeline within 1–3 miles? Heavy new supply (>2% of stock underway) typically softens rents 12–24 months out; light construction supports rent growth.
Investment metrics
- 1% rule
- 1.70% ✓
- Cap rate
- 7.63%
- Cash-on-cash
- 4.79%
- DSCR
- 1.21
- GRM
- 4.9
CMA / ARV
- ARV (median comp)
- $225,581
- List price
- $75,900
- Delta
- -66.35%
- Verdict
- UNDERPRICED
- Comps
- 3 within 1.0 mi
Projected returns pro-forma
-3.0% appreciation · 4.77% rent growth · sell at horizon
- IRR
- -5.2%
- Equity multiple
- 0.80×
- Total profit
- $-4,285
- Equity at exit
- $11,317
- IRR
- 7.8%
- Equity multiple
- 1.67×
- Total profit
- $14,277
- Equity at exit
- $6,562
Cash invested: $21,252 (down + closing). Projections, not guarantees.
Landlord ↔ Tenant lean methodology
- Overall (CITY)
- 34 Tenant-Leaning
- State Minnesota
- 46 Balanced · D+2
- County
- — inherits STATE
- City Minneapolis
- 34 Tenant-Leaning · D+50
ZIP-level market 55408
- Rents YoY
- 4.8%
- Active inventory
- 175
- Price-to-rent
- 4.9×
Monthly cashflow live
- Estimated rent
- $1,290 high interval (Pro) →
- Mortgage (P&I)
- −$398
- Tax from tax record
- −$62 /mo · $750/yr
- Insurance
- −$32
- HOA
- −$442
- Vacancy / Maint / Mgmt
- −$271
- Net cashflow
- $85
Break-even live
UW: 25.0% down · 7.5% · 30yr · 1.5% tax · 5.0% vac · 8.0% maint · 8.0% mgmt
Financing live
Cash to close
- Down payment
- $18,975
- Closing costs
- $2,277
- Reserves months
- —
- Total cash needed
- —
Loan-product check · same deal, 3 products live
Conventional
25% down · 7.5% · 30yr
- Down + closing
- —
- Monthly P&I
- —
- Monthly cashflow
- —
- DSCR
- —
- Eligible?
- —
Personal DTI + credit; lowest rate.
DSCR
20% down · 8.5% · 30yr
- Down + closing
- —
- Monthly P&I
- —
- Monthly cashflow
- —
- DSCR
- —
- Eligible?
- —
No personal income docs; deal must DSCR.
Hard money
10% down · 12.0% · 12mo
- Down + closing
- —
- Monthly P&I
- —
- Monthly cashflow
- —
- DSCR
- —
- Eligible?
- —
Short-term bridge; refi at stabilization.
Rent comps 40 comps
| Address | Beds | Baths | Sqft | Rent | $/sqft | DOM | Units | Dist |
|---|---|---|---|---|---|---|---|---|
| 2800 Pillsbury Ave Apt 5 Minneapolis, MN | 1.0 | 1.0 | 550 | $1,100 | $2.00 | 17d | 1 | 0.13mi |
| 2800 Pillsbury Ave Unit 1 Minneapolis, MN | 1.0 | 1.0 | 550 | $1,049 | $1.91 | 43d | 1 | 0.13mi |
| 2916 Grand Ave S Minneapolis, MN | 2.0 | 1.0 | 814 | $1,250 | $1.54 | 3d | 1 | 0.18mi |
| 2740 Pleasant Ave Minneapolis, MN | 1.0–2.0 | 1.0 | 645 | $1,145 | $1.78 | 2d | 3 | 0.20mi |
| 2800 Grand Ave S Minneapolis, MN | 1.0–2.0 | 1.0 | 692 | $975 | $1.41 | 3d | 4 | 0.20mi |
| 3024 Pleasant Ave Unit 2 Minneapolis, MN | 1.0 | 1.0 | 900 | $1,250 | $1.39 | 43d | 1 | 0.21mi |
| 2725 Pleasant Ave Unit 101 Minneapolis, MN | 1.0 | 1.0 | 700 | $1,100 | $1.57 | 3d | 1 | 0.21mi |
| 3035 Pleasant Ave Minneapolis, MN | 2.0 | 1.0 | 700 | $1,448 | $2.07 | 11d | 2 | 0.22mi |
| 410 W Lake St Minneapolis, MN | 1.0–2.0 | 1.0 | 691 | $1,205 | $1.74 | 1d | 6 | 0.23mi |
| 3020 Grand Ave S Unit 2 Minneapolis, MN | 1.0 | 1.0 | 560 | $1,500 | $2.68 | 17d | 1 | 0.24mi |
| 2813 Garfield Ave Apt 2815-1 Minneapolis, MN | 2.0 | 1.0 | 650 | $1,950 | $3.00 | 7d | 1 | 0.28mi |
| 2636 Pillsbury Ave S Minneapolis, MN | 3.0 | 1.0 | 560 | $963 | $1.72 | 2d | 1 | 0.29mi |
| 3127 Pleasant Ave Unit 104 Minneapolis, MN | 1.0 | 1.0 | 700 | $999 | $1.43 | 43d | 1 | 0.32mi |
| 3127 Pleasant Ave Minneapolis, MN | 1.0 | 1.0 | 700 | $1,014 | $1.45 | 7d | 1 | 0.32mi |
| 607 W 28th St Minneapolis, MN | 2.0 | 1.0–2.0 | 621 | $1,514 | $2.44 | 2d | 14 | 0.32mi |
| 2833 Lyndale Ave S Minneapolis, MN | 2.0 | 1.0–2.0 | 818 | $1,782 | $2.18 | 17d | 6 | 0.33mi |
| 2957 Lyndale Ave S Unit 614-2 Minneapolis, MN | 1.0 | 1.0 | 546 | $1,375 | $2.52 | 24d | 1 | 0.35mi |
| 2957 Lyndale Ave S Unit 614-6 Minneapolis, MN | 1.0 | 1.0 | 617 | $1,225 | $1.99 | 43d | 1 | 0.35mi |
| 2925 2nd Ave S Unit 3 Minneapolis, MN | 1.0 | 1.0 | 720 | $1,400 | $1.94 | 43d | 1 | 0.36mi |
| 2925 2nd Ave S Unit -4 Minneapolis, MN | 1.0 | 1.0 | 720 | $1,300 | $1.81 | 24d | 1 | 0.36mi |
| 2611 Pleasant Ave Minneapolis, MN | 2.0 | 1.0 | 650 | $1,190 | $1.83 | 2d | 37 | 0.36mi |
| 2641 Garfield Ave Unit 101 Minneapolis, MN | 2.0 | 1.0 | 750 | $1,095 | $1.46 | 43d | 1 | 0.40mi |
| 2641 Garfield Ave Unit 106 Minneapolis, MN | 1.0 | 1.0 | 550 | $965 | $1.75 | 43d | 1 | 0.40mi |
| 201 E 27th St Apt 12 Minneapolis, MN | 1.0 | 1.0 | 850 | $1,200 | $1.41 | 24d | 1 | 0.42mi |
| 2922 Aldrich Ave S Minneapolis, MN | 1.0–2.0 | 1.0–2.5 | 949 | $1,400 | $1.48 | 1d | 31 | 0.43mi |
| 2530 Blaisdell Ave Minneapolis, MN | 2.0 | 1.0 | 850 | $1,140 | $1.34 | 17d | 1 | 0.44mi |
| 3224 Nicollet Ave Unit 3 Minneapolis, MN | 2.0 | 1.0 | 950 | $1,995 | $2.10 | 7d | 1 | 0.45mi |
| 3224 Nicollet Ave Unit 3 Minneapolis, MN | 2.0 | 1.0 | 950 | $1,995 | $2.10 | 24d | 1 | 0.45mi |
| 2841 Bryant Ave S Minneapolis, MN | 2.0 | 1.0–2.0 | 835 | $1,900 | $2.27 | 2d | 23 | 0.46mi |
| 2621 Lyndale Ave S Minneapolis, MN | — | 1.0 | 550 | $1,650 | $3.00 | 43d | 1 | 0.47mi |
| 2625 2nd Ave S Unit 1 Minneapolis, MN | 2.0 | 1.0 | 1000 | $2,000 | $2.00 | 24d | 1 | 0.47mi |
| 2530 1st Ave S Unit N201 Minneapolis, MN | 1.0 | 1.0 | 550 | $1,400 | $2.55 | 43d | 1 | 0.48mi |
| 2508 Pillsbury Ave S Minneapolis, MN | 1.0 | 1.0 | 535 | $1,110 | $2.07 | 16d | 2 | 0.48mi |
| 3200 Garfield Ave Apt B2 Minneapolis, MN | 2.0 | 1.0 | 900 | $1,395 | $1.55 | 17d | 1 | 0.49mi |
| 3019 Bryant Ave S Minneapolis, MN | 1.0 | 1.0 | 750 | $1,250 | $1.67 | 43d | 1 | 0.49mi |
| 2908 Bryant Ave S Minneapolis, MN | 1.0 | 1.0 | 600 | $1,319 | $2.20 | 2d | 11 | 0.49mi |
| 2908 Bryant Ave S Minneapolis, MN | 1.0 | 1.0 | 575 | $1,309 | $2.28 | 43d | 1 | 0.49mi |
| 2552 Garfield Ave Minneapolis, MN | 1.0 | 1.0 | 463 | $1,000 | $2.16 | 16d | 3 | 0.50mi |
| 2611 2nd Ave S Minneapolis, MN | 1.0 | 1.0 | 624 | $1,435 | $2.30 | 7d | 4 | 0.50mi |
| 2611 2nd Ave S Unit 304 Minneapolis, MN | 1.0 | 1.0 | 584 | $1,485 | $2.54 | 24d | 1 | 0.50mi |
HOA detail condo
- Monthly dues
- $442 · $5,304/yr
- Assessments
- None detected in remarks — confirm with the listing agent.
Listing history 16 events
-
2026-06-04statusdays on market $75,900 Pending 41 DOM
-
2026-06-03days on market $75,900 Contingent - Inspection 40 DOM
-
2026-06-02days on market $75,900 Contingent - Inspection 39 DOM
-
2026-06-02status $75,900 Contingent - Inspection 38 DOM
-
2026-06-01days on market $75,900 Active 38 DOM
-
2026-05-31days on market $75,900 Active 37 DOM
-
2026-04-24$75,900 Active 861-char remark
-
2026-02-27historical
-
2025-12-08price $89,900
-
2025-09-25$99,900 Active
-
2025-09-23historical
-
2019-08-22soldstatus $74,000
-
2019-08-21soldstatus $74,000 Sold
Show marketing remark (220 chars)
First floor 1 bedroom 1 bath condo with outdoor access to green space - move in condition walking distance to Eat Street - shops, restaurants and public transportation. Off street parking, affordable housing at its best.
-
2019-07-29historical Contingent - Inspection
Show marketing remark (220 chars)
First floor 1 bedroom 1 bath condo with outdoor access to green space - move in condition walking distance to Eat Street - shops, restaurants and public transportation. Off street parking, affordable housing at its best.
-
2019-07-18price $79,900
Show marketing remark (220 chars)
First floor 1 bedroom 1 bath condo with outdoor access to green space - move in condition walking distance to Eat Street - shops, restaurants and public transportation. Off street parking, affordable housing at its best.
-
2019-07-10$82,500 Active
Show marketing remark (220 chars)
First floor 1 bedroom 1 bath condo with outdoor access to green space - move in condition walking distance to Eat Street - shops, restaurants and public transportation. Off street parking, affordable housing at its best.
ⓘ Source: listings_history table (triggers on properties + properties_extension) + one-shot
backfill from property_details.listing_events for pre-trigger history.
Tax reassessment forecast MN · Partial reset (capped growth)
- Current annual tax
- $750 · $62/mo
- Projected year-2 tax
- $800 · $67/mo
- Expected delta
- +$50/yr (+$4/mo · 6.7%)
ⓘ Screening estimate from a state-policy table — verify with the county assessor before closing.
Climate risk First Street
- Flood 1/10 Low FEMA zone X (unshaded) · 0% chance over 30 yrs
- Wildfire 1/10 Low
- Heat 2/10 Low 7 d/yr ≥99°F today · 14 d/yr by 30 yrs out
- Wind 2/10 Low
- Air quality 2/10 Low 1 unhealthy d/yr today · 1 by 30 yrs out
Nearby sold comps map
Loading sold comps map…
Walkable amenities ~0.75 mi
Loading nearby amenities…
Taxation est. · year 1
- Rental income
- $15,478
- − Mortgage interest
- −$4,252
- − Property taxes
- −$750
- − Insurance
- −$380
- − Repairs & maintenance
- −$1,238
- − Management
- −$1,238
- − HOA
- −$5,304
- − Depreciation
- −$2,208
- Taxable income
- $109
- Est. tax owed @ 24.0%
- −$26
- After-tax cash flow
- $992/yr
For passive investors: Depreciation is non-cash, so a rental often shows a tax loss while cash-flowing — sheltering income. Rental losses are passive: they offset passive income freely, and up to $25,000/yr can offset ordinary (W-2) income if you actively participate and your MAGI is under $100k (phasing out to $0 by $150k); unused losses carry forward. On sale, claimed depreciation is recaptured at up to 25%, and gains may owe capital-gains tax (a 1031 exchange can defer both). Figures are a year-1 estimate at your 24.0% rate — not tax advice; consult a CPA.
Schools (NCES district)
- District
- Minneapolis Public School District
- NCES district ID
- 2721240
- Math proficiency
- 35% ▼ -7.00%
- Reading proficiency
- 46% ▼ -1.00%
- Median HH income
- $50,521
- Composite
- 34.92/100
- National rank
- #5067
- State rank
- #217 of 301 in MN
Livability — Minneapolis
- Score
- 78/100
- State rank
- #110
- US rank
- #2525
Category grades
Schools grade is shown separately in the Schools card above.
Census & demographics
- Census place
- Minneapolis, MN
- County
- Hennepin County · 1,150,272 people
- City population
- 417,555
- Metro
- Minneapolis-St. Paul-Bloomington, MN-WI
- Population (ZIP)
- 31,507
- Household income
- $70,326
- Rent vs Own
- Severe rent burden
- 2619.0
Population outlook (Hennepin County) Hauer SSP2
- Today (2025)
- 1,405,227 people
- By 2030
- 1,492,650 · +6.2%
- By 2040
- 1,660,157 · +18.1%
- By 2050
- 1,823,498 · +29.8%
- By 2075
- 2,221,283 · +58.1%
- By 2100
- 2,509,976 · +78.6%
Race, ethnicity, and origin ACS 2023
- Neighborhood character
- Diverse neighborhood (Simpson 0.60)
- Race & ethnicity
- White 59% Black 17% Hispanic / Latino 11% Two or more races 9% Asian 5% Native American 1%
- Hispanic origin (detail)
- Mexican 7%
- Common ancestry
- Portuguese 8% Romanian 6% Lithuanian 3%
- Foreign-born
- 15% · Canada, South Korea, Vietnam
- Languages at home
- 79% English-only · Spanish 8% Other Indo-European 1% Other Asian/Pacific 1%
Political lean MEDSL · Hennepin
- 2024 margin
- Solid D (+42.6) · D 70.2% · R 27.5% · Other 2.3%
- 2008→2024 swing
- +14.0pp toward D · 2008: 28.6pp · 2024: 42.6pp
- All cycles
- 2024: D+42.6 2020: D+43.2 2016: D+35.3 2012: D+27.1 2008: D+28.6
Not yet ingested
- Civics
- —
Market trends
- HPI YoY
- ▼ -148.08%
- Current HPI
- 256.0491
- Rent YoY
- ▲ 4.77%
- Metro
- Minneapolis-St. Paul-Bloomington, MN-WI
- State GDP YoY
- ▲ 2.41%
- F500 in state
- 34
Industry mix (Fortune 500 HQ in MN)
| Industry | F500 HQs | Revenue |
|---|---|---|
| Healthcare | 2 | $407B |
|
||
| Retail | 2 | $150B |
|
||
| Consumer Goods | 2 | $32B |
|
||
| Industrial Machinery | 2 | $6B |
|
||
| Agriculture | 1 | $40B |
|
||
| Healthcare / Medical Devices | 1 | $32B |
|
||
Price history
-8.0% since first listed12 events — show timeline
- 2026-06-04 Pending — NORTHSTARMLS as Distributed by MLS Grid
- 2026-06-01 Contingent — NORTHSTARMLS as Distributed by MLS Grid
- 2026-04-24 Listed $75,900 NORTHSTARMLS as Distributed by MLS Grid
- 2026-02-27 Listing Removed — NORTHSTARMLS as Distributed by MLS Grid
- 2025-12-08 Price Changed $89,900 NORTHSTARMLS as Distributed by MLS Grid
- 2025-09-25 Listed $99,900 NORTHSTARMLS as Distributed by MLS Grid
- 2025-09-23 Coming Soon — NORTHSTARMLS as Distributed by MLS Grid
- 2019-08-22 Sold (Public Records) $74,000 Public Records
- 2019-08-21 Sold (MLS) $74,000 NORTHSTARMLS as Distributed by MLS Grid
- 2019-07-29 Contingent — NORTHSTARMLS as Distributed by MLS Grid
- 2019-07-18 Price Changed $79,900 NORTHSTARMLS as Distributed by MLS Grid
- 2019-07-10 Listed $82,500 NORTHSTARMLS as Distributed by MLS Grid
Property tax history
-1.9%/yrLatest (2025): $750 · +6.3% YoY. Source: county tax records.
Cash-flow waterfall
monthlySold comps — $/sqft
last 12 mo · ≤1 miLoading sold comps…