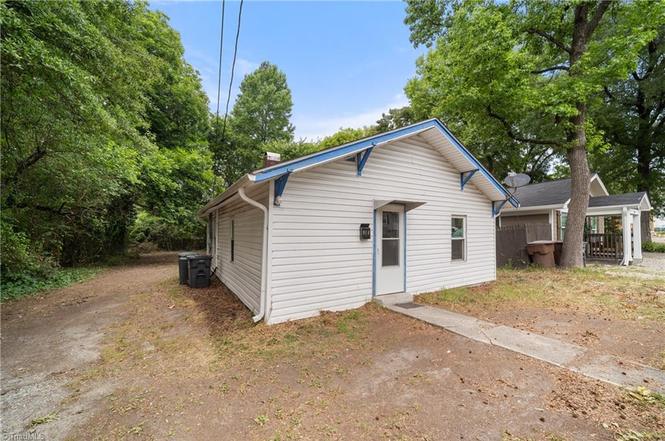
914 Lincoln St · Greensboro, NC
Flood risk 1/10 · Minimal
- FEMA flood zone
- X (unshaded)
- Chance of flooding over 30 yrs
- 0.0%
- Est. flood insurance / yr
- $507 – $1,088
Fire risk 1/10 · Minimal
- Est. fire insurance / yr
- $906 – $1,684
Heat risk 6/10 · Moderate
- Hot days now (above 103°F)
- 7 days/yr
- Hot days in 30 yrs
- 17 days/yr
Wind risk 4/10 · Minor
- Chance of severe wind over 30 yrs
- 15.0%
Air-quality risk 2/10 · Minimal
- Unhealthy air days now
- 1 days/yr
- Unhealthy air days in 30 yrs
- 2 days/yr
Risk factors via First Street. Map © Google.
Why this score? — see what drove the C- grade
The composite is a weighted blend of 9 inputs, each scored 0–100. Each bar is that input's sub-score; the figure is the points it added to the 100-point composite (weight × sub-score).
- Cash flow +19.5/30.0
- ARV discount +7.5/15.0
- DSCR +6.1/10.0
- 1% rule +4.4/10.0
- Livability +4.0/5.0
- Schools +3.6/10.0
- Rent growth +2.9/5.0
- Condition / age +2.5/5.0
- Appreciation +0.0/10.0
$119,900
🖨 Deal sheet 📄 Offer letter ✓ Due diligence
Listing remarks MLS
** Back on the Market with REDUCED Firm "As-Is" Price ** Why Rent when you can OWN? Perfect for first time home buyers or investors! Renovated home with New Roof, New HVAC, New Windows, New tiled floors in Kitchen and Bath, New Vinyl Siding, New Interior paint, & New subfloor and Laminate Floors over pier foundation! Conveniently located near highway and local schools. Free standing range oven, built-in microwave, deck overlooking level back yard, updated bath, new interior doors, and new light fixtures all combine to make this a must see!
Key facts
- Tile floors
- New rear deck
- New hvac
Tags
Property features AI
Finance
- HOA & community: No homeowners association
Exterior
- Parking: Driveway
- Security: Deadbolt locks
- Utilities: Public water; Public sewer; Electric water heater
- Home design: Residential stick/site-built house; One level; Built in 1935; Existing structure
- Construction: Vinyl siding
- Exterior features: City lot; Public-maintained road
Interior
- Kitchen: Microwave; Free-standing range
- Bedrooms: Total rooms: 6
- Flooring: Tile; Vinyl
- Bathrooms: 1 full bathroom
- Heating & cooling: Heat pump for heating and cooling; Electric heating fuel
- Interior features: Primary suite on the main level; Attic access only; Ceiling fans; Deadbolt locks
- Laundry & utility: Electric water heater
Neighborhood map
What this means for you Summary
Snapshot
- This is a 2-bed/1.0-bath single-family listed at $120k.
Deal economics
- At list price, monthly cash flow is $135 ($2k/yr) — positive.
- The deal already cash-flows at list — no discount required.
- To meet the 1% rule (rent ≥ 1% of price), the offer needs to be $113k (6.2% below list).
- Recommended offer: $113k (6.2% below list) — sets the bar for 1% rule.
- Cap rate 7.6% vs local median 3.8% in Greensboro — top-decile yield for the area; either an underpriced asset or a hidden risk that comps aren't pricing in. Stress-test before assuming the spread holds.
Location & tenants
- Location reads 81/100 on livability (#12 in NC, #1,335 nationally) — a professional / high-income tenant draw. Strengths: amenities A+, commute A+, cost of living A+; Watch: employment D, crime F.
- Guilford County Schools (urban): math 39% / reading 45% proficiency, ranked #99 of 178 in NC (top 56%) — families likely to look elsewhere, expect single-tenant / working-renter base with shorter leases.
- Market conditions: Rents rising (+1.8%/yr); 125 active listings in the ZIP; 11 comparable units currently listed for rent nearby; rentals at typical pace (median 24d on market — plan ~3-4 weeks tenant-placement turnaround); 3,843 units permitted in Guilford County in 2024 (2,397 in 5+ unit buildings).
Forward outlook
- Local home prices are declining (-3.0%/yr); year-one equity from $829 of loan paydown is wiped out by about $4k of value loss. Plan a longer hold.
- Guilford County population projected at +26% by 2050 — long-run rental-demand tailwind backs the buy-and-hold thesis.
Negotiation context
- Only 6 days on market — expect competitive offers; lowballing is unlikely to land.
- 4 sale attempts since 5y ago; this cycle's ask has dropped $12k (9%) from the opening price — seller is motivated, your offer sets the floor, not the list.
- Current owner paid $72k; list at $120k implies a 67% gain — meaningful room to come down on a strong offer.
Risks & watch-outs
- Watch-outs: built in 1935 — expect roof / HVAC / electrical / plumbing capex.
- Climate carrying-cost: extreme-heat days projected 7→17/yr by 2055 (HVAC capex compounding) — expect insurance premiums to compound above CPI over the hold.
Questions for the listing agent
- Built in 1935 — when were the roof, HVAC, electrical panel, plumbing, and water heater last replaced?
- Is there a deadline driving the sale (1031 exchange, divorce, estate, relocation)? That informs how much negotiation room exists.
- Crime grade is F in this area — have there been break-ins, vandalism, or insurance claims at this property in the last 3 years? What carrier currently insures it and at what premium?
- What's the average days-on-market for RENTAL listings here right now (not sales)? A rising rental-DOM trend means longer vacancies and softer asking-rent achievability than the comps imply.
- What's the recent tenant-quality profile in this submarket — average credit score on applications, eviction rate, late-payment / NSF rate, and stable-employment percentage? A property-management company in the area should have these aggregated.
- How much new for-sale + rental construction is in the pipeline within 1–3 miles? Heavy new supply typically softens prices + rents 12–24 months out; constrained supply supports both.
Investment metrics
- 1% rule
- 0.94% ✗
- Cap rate
- 7.64%
- Cash-on-cash
- 4.82%
- DSCR
- 1.21
- GRM
- 8.9
CMA / ARV
- ARV (on-the-fly)
- $76,608
- Comps found
- 2
Show comp detail 2 sales within ~0.75 mi
| Address | Dist | Beds/Ba | Sqft | Sold | Price | $/sf | Match |
|---|---|---|---|---|---|---|---|
| 915 S English St | 0.47mi | 2/1.0 | 672 (+10%) | 2mo | $80,000 | $119 | 59 |
| 912 S English St | 0.45mi | 2/1.0 | 672 (+10%) | 4mo | $85,000 | $126 | 58 |
Match score weights: distance 35% · size 25% · config 20% · recency 20%. Top-matched comps best support the ARV.
Projected returns pro-forma
-3.0% appreciation · 1.78% rent growth · sell at horizon
- IRR
- -10.1%
- Equity multiple
- 0.64×
- Total profit
- $-12,225
- Equity at exit
- $17,877
- IRR
- -2.4%
- Equity multiple
- 0.85×
- Total profit
- $-5,157
- Equity at exit
- $10,367
Cash invested: $33,572 (down + closing). Projections, not guarantees.
Landlord ↔ Tenant lean methodology
- Overall (STATE)
- 85 Strongly Landlord-Friendly
- State North Carolina
- 85 Strongly Landlord-Friendly · R+3
- County
- — inherits STATE
- City
- — inherits STATE
ZIP-level market 27401
- Home prices YoY
- -28.9%
- Rents YoY
- 1.8%
- Active inventory
- 125
- Price-to-rent
- 8.9×
Monthly cashflow live
- Estimated rent
- $1,125 high interval (Pro) →
- Mortgage (P&I)
- −$629
- Tax from tax record
- −$75 /mo · $903/yr
- Insurance
- −$50
- HOA
- −$0
- Vacancy / Maint / Mgmt
- −$236
- Net cashflow
- $135
Break-even live
UW: 25.0% down · 7.5% · 30yr · 1.5% tax · 5.0% vac · 8.0% maint · 8.0% mgmt
Financing live
Cash to close
- Down payment
- $29,975
- Closing costs
- $3,597
- Reserves months
- —
- Total cash needed
- —
Loan-product check · same deal, 3 products live
Conventional
25% down · 7.5% · 30yr
- Down + closing
- —
- Monthly P&I
- —
- Monthly cashflow
- —
- DSCR
- —
- Eligible?
- —
Personal DTI + credit; lowest rate.
DSCR
20% down · 8.5% · 30yr
- Down + closing
- —
- Monthly P&I
- —
- Monthly cashflow
- —
- DSCR
- —
- Eligible?
- —
No personal income docs; deal must DSCR.
Hard money
10% down · 12.0% · 12mo
- Down + closing
- —
- Monthly P&I
- —
- Monthly cashflow
- —
- DSCR
- —
- Eligible?
- —
Short-term bridge; refi at stabilization.
Rent comps 11 comps
| Address | Beds | Baths | Sqft | Rent | $/sqft | DOM | Units | Dist |
|---|---|---|---|---|---|---|---|---|
| 2001 Spencer St Greensboro, NC | 2.0 | 1.0 | 720 | $1,295 | $1.80 | 23d | 1 | 0.42mi |
| 1112 Stephens St Greensboro, NC | 2.0 | 1.0 | 744 | $1,250 | $1.68 | 19d | 1 | 0.69mi |
| 1001 E Bragg St Apt B Greensboro, NC | 2.0 | 1.0 | 700 | $925 | $1.32 | 14d | 1 | 0.69mi |
| 307 Avalon Rd Greensboro, NC | 1.0–2.0 | 1.0 | 650 | $895 | $1.38 | 23d | 3 | 0.70mi |
| 402 Winston St Greensboro, NC | 2.0 | 1.0 | 640 | $1,150 | $1.80 | 23d | 1 | 1.01mi |
| 702 Ross Ave Greensboro, NC | 2.0 | 1.0 | 672 | $1,200 | $1.79 | 23d | 1 | 1.07mi |
| 1003 Martin Luther King Junior Dr Unit B Greensboro, NC | 1.0 | 1.0 | 580 | $595 | $1.03 | 23d | 1 | 1.18mi |
| 405 E Whittington St Greensboro, NC | 2.0 | 1.0 | 700 | $995 | $1.42 | 23d | 1 | 1.28mi |
| 800 Arlington St Unit A Greensboro, NC | 2.0 | 1.0 | 650 | $1,250 | $1.92 | 14d | 1 | 1.41mi |
| 321 S Elm St Greensboro, NC | 1.0–2.0 | 1.0–2.0 | 950 | $1,787 | $1.88 | 14d | 8 | 1.45mi |
| 711 Summit Ave Greensboro, NC | 1.0 | 1.0 | 700 | $1,025 | $1.46 | 23d | 1 | 1.46mi |
Listing history 7 events
-
2026-06-18days on market $119,900 Active 6 DOM
-
2026-06-17price $119,900 Active 5 DOM
-
2026-06-17days on market $132,000 Active 5 DOM
-
2026-06-16days on market $132,000 Active 4 DOM
-
2026-06-15days on market $132,000 Active 3 DOM
-
2026-06-14remarks 281-char remark
-
2026-06-14$132,000 Active 1 DOM
ⓘ Source: listings_history table (triggers on properties + properties_extension) + one-shot
backfill from property_details.listing_events for pre-trigger history.
Tax reassessment forecast NC · Resets to sale price
- Current annual tax
- $903 · $75/mo
- Projected year-2 tax
- $983 · $82/mo
- Expected delta
- +$80/yr (+$7/mo · 8.9%)
ⓘ Screening estimate from a state-policy table — verify with the county assessor before closing.
Climate risk First Street
- Flood 1/10 Low FEMA zone X (unshaded) · 0% chance over 30 yrs
- Wildfire 1/10 Low
- Heat 6/10 Major 7 d/yr ≥103°F today · 17 d/yr by 30 yrs out
- Wind 4/10 Moderate 15% chance of damaging wind over 30 yrs
- Air quality 2/10 Low 1 unhealthy d/yr today · 2 by 30 yrs out
Nearby sold comps map
Loading sold comps map…
Walkable amenities ~0.75 mi
Loading nearby amenities…
Taxation est. · year 1
- Rental income
- $13,503
- − Mortgage interest
- −$6,716
- − Property taxes
- −$903
- − Insurance
- −$600
- − Repairs & maintenance
- −$1,080
- − Management
- −$1,080
- − Depreciation
- −$3,488
- Taxable loss
- −$364
- Est. tax savings @ 24.0%
- +$87
- After-tax cash flow
- $1,707/yr
For passive investors: Depreciation is non-cash, so a rental often shows a tax loss while cash-flowing — sheltering income. Rental losses are passive: they offset passive income freely, and up to $25,000/yr can offset ordinary (W-2) income if you actively participate and your MAGI is under $100k (phasing out to $0 by $150k); unused losses carry forward. On sale, claimed depreciation is recaptured at up to 25%, and gains may owe capital-gains tax (a 1031 exchange can defer both). Figures are a year-1 estimate at your 24.0% rate — not tax advice; consult a CPA.
Schools (NCES district)
- District
- Guilford County Schools
- NCES district ID
- 3701920
- Math proficiency
- 39% ▲ 1.00%
- Reading proficiency
- 45% ▲ 1.00%
- Median HH income
- $46,315
- Composite
- 35.78/100
- National rank
- #4842
- State rank
- #99 of 178 in NC
Livability — Greensboro
- Score
- 81/100
- State rank
- #12
- US rank
- #1335
Category grades
Schools grade is shown separately in the Schools card above.
Census & demographics
- Census place
- Greensboro, NC
- County
- Guilford County · 487,190 people
- City population
- 329,421
- Metro
- Greensboro-High Point, NC
- Population (ZIP)
- 21,920
- Household income
- $47,972
- Rent vs Own
- Severe rent burden
- 1138.0
Population outlook (Guilford County) Hauer SSP2
- Today (2025)
- 584,596 people
- By 2030
- 616,851 · +5.5%
- By 2040
- 678,451 · +16.1%
- By 2050
- 734,788 · +25.7%
- By 2075
- 862,985 · +47.6%
- By 2100
- 948,704 · +62.3%
Race, ethnicity, and origin ACS 2023
- Neighborhood character
- Majority Black (62%)
- Race & ethnicity
- Black 62% White 26% Hispanic / Latino 8% Two or more races 4% Asian 1%
- Hispanic origin (detail)
- Mexican 4%
- Common ancestry
- Italian 1% Serbian 1% Slovak 1%
- Foreign-born
- 9% · Canada
- Languages at home
- 88% English-only · Spanish 6% Arabic 2% French/Haitian/Cajun 1%
Political lean MEDSL · Guilford
- 2024 margin
- Strong D (+21.8) · D 60.2% · R 38.4% · Other 1.4%
- 2008→2024 swing
- +3.5pp toward D · 2008: 18.4pp · 2024: 21.8pp
- All cycles
- 2024: D+21.8 2020: D+23.1 2016: D+20.0 2012: D+16.5 2008: D+18.4
Not yet ingested
- Civics
- —
Market trends
- HPI YoY
- ▼ -97.87%
- Current HPI
- 240.5377
- Rent YoY
- ▲ 1.78%
- Metro
- Greensboro-High Point, NC
- State GDP YoY
- ▲ 3.28%
- F500 in state
- 26
Industry mix (Fortune 500 HQ in NC)
| Industry | F500 HQs | Revenue |
|---|---|---|
| Financial Services | 2 | $213B |
|
||
| Retail | 2 | $95B |
|
||
| Industrial Conglomerate | 1 | $38B |
|
||
| Metals / Steel | 1 | $35B |
|
||
| Utilities | 1 | $30B |
|
||
| Industrial Machinery | 1 | $19B |
|
||
Price history
+633.3% since first listed15 events — show timeline
- 2026-06-12 Listed $132,000 Triad MLS
- 2022-04-11 Sold (Public Records) $72,000 Public Records
- 2022-04-11 Sold (MLS) $72,000 Triad MLS
- 2022-04-09 Pending — Triad MLS
- 2022-03-30 Contingent — Triad MLS
- 2022-03-14 Relisted — Triad MLS
- 2022-03-14 Price Changed $78,800 Triad MLS
- 2022-03-08 Contingent — Triad MLS
- 2022-02-18 Price Changed $83,750 Triad MLS
- 2021-12-01 Relisted — Triad MLS
- 2021-11-11 Contingent — Triad MLS
- 2021-10-31 Listed $85,000 Triad MLS
- 2021-01-26 Sold (Public Records) $15,000 Public Records
- 1986-06-01 Sold (Public Records) $15,000 Public Records
- 1982-11-01 Sold (Public Records) $18,000 Public Records
Property tax history
+8.5%/yrLatest (2025): $903 · -1.0% YoY. Source: county tax records.
Cash-flow waterfall
monthlySold comps — $/sqft
last 12 mo · ≤1 miLoading sold comps…