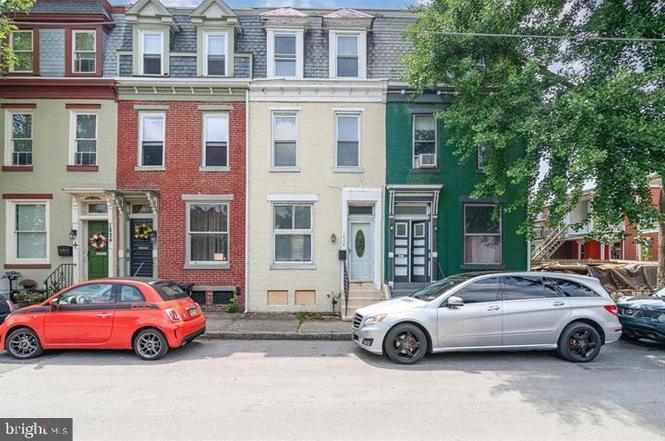
1828 Penn St · Harrisburg, PA
Flood risk 10/10 · Severe
- FEMA flood zone
- X (shaded)
- Chance of flooding over 30 yrs
- 0.99%
- Est. flood insurance / yr
- $473 – $860
Fire risk 1/10 · Minimal
- Est. fire insurance / yr
- $511 – $949
Heat risk 6/10 · Moderate
- Hot days now (above 101°F)
- 7 days/yr
- Hot days in 30 yrs
- 15 days/yr
Wind risk 3/10 · Minor
- Chance of severe wind over 30 yrs
- 5.0%
Air-quality risk 2/10 · Minimal
- Unhealthy air days now
- 1 days/yr
- Unhealthy air days in 30 yrs
- 3 days/yr
Risk factors via First Street. Map © Google.
Why this score? — see what drove the D+ grade
The composite is a weighted blend of 9 inputs, each scored 0–100. Each bar is that input's sub-score; the figure is the points it added to the 100-point composite (weight × sub-score).
- Cash flow +18.7/30.0
- ARV discount +7.5/15.0
- DSCR +5.9/10.0
- 1% rule +4.5/10.0
- Livability +4.2/5.0
- Rent growth +3.6/5.0
- Condition / age +2.5/5.0
- Schools +0.8/10.0
- Appreciation +0.0/10.0
$179,900
🖨 Deal sheet (PDF) 📄 Offer letter ✓ Due diligence
Listing remarks
Welcome Home! Step into this beautifully updated 4-bedroom, 1-bath gem in the heart of Penn Street, Harrisburg—ready for you to move in today! Every detail has been thoughtfully refreshed, from the brand-new gas furnace and hot water heater to fresh paint, modern flooring, stylish light fixtures, updated plumbing, and so much more. The first floor offers an open and airy layout, perfect for gatherings, featuring a cozy living room, a formal dining space, and a bright kitchen. Upstairs, you’ll find two comfortable bedrooms, a full bath, and a convenient laundry room right next door. The third floor adds two more spacious bedrooms, giving you plenty of room to spread out. Outside,
Key facts
- Updated gas furnace
- Modern flooring
- Fresh paint
Tags
Neighborhood map
What this means for you Summary
Snapshot
- This is a 5-bed/1.0-bath single-family listed at $180k.
Deal economics
- At list price, monthly cash flow is $122 ($1k/yr) — positive.
- The deal already cash-flows at list — no discount required.
- To meet the 1% rule (rent ≥ 1% of price), the offer needs to be $171k (4.9% below list).
- Recommended offer: $164k (9.0% below list) — sets the bar for market timing.
Location & tenants
- Location reads 84/100 on livability (#107 in PA, #826 nationally) — a professional / high-income tenant draw. Strengths: amenities A+, commute A+, cost of living A+; Watch: employment D, crime F.
- Harrisburg City SD (urban): math 6% / reading 13% proficiency, ranked #535 of 539 in PA (top 99%) — low school quality limits family demand, transient renter base, plan for 1-2y turnover; 82% free/reduced lunch — lower-income household profile, screen leases tightly.
- Zoned schools: Harrisburg Hs (math 24% / reading 10%, grade F, #399 of 437 statewide, top 92%, 1,230 students, 100% FRL) — zoned schools average 100% FRL vs 82% district-wide (18 pts higher); higher-poverty schools than district average — tighter screening recommended.
- Market conditions: Rents rising fast (+4.3%/yr); 60 active listings in the ZIP; 13 comparable units currently listed for rent nearby; rentals lingering (median 45d on market — plan ~5-8 weeks vacancy on turnover, expect pricing pressure); 69% of comp listings sitting > 30 days — soft ceiling on asking rent; 540 units permitted in Dauphin County in 2024 (194 in 5+ unit buildings).
- This rent runs 38% of the median local income ($55k/yr) — at the standard rent-burdened threshold; future hikes will face affordability resistance.
Forward outlook
- Local home prices are declining (-3.0%/yr); year-one equity from $1k of loan paydown is wiped out by about $5k of value loss. Plan a longer hold.
Negotiation context
- It's been on market 111 days — a 9% lower offer ($164k) is reasonable based on typical stale-listing flexibility.
- 7 sale attempts since 23y ago with the ask held roughly flat each time — persistent listings suggest the price (not the market) is what's stuck; bring a comps-based counter.
- Current owner paid $110k; list at $180k implies a 64% gain — meaningful room to come down on a strong offer.
Risks & watch-outs
- Watch-outs: flood insurance adds $56/mo; built in 1907 — expect roof / HVAC / electrical / plumbing capex.
- Climate carrying-cost: severe flood risk; extreme-heat days projected 7→15/yr by 2055 (HVAC capex compounding) — expect insurance premiums to compound above CPI over the hold.
Questions for the listing agent
- It's been on market 111 days. Have you received any prior offers? Is the seller open to a 9% concession, seller financing, or rate buy-down credit?
- Built in 1907 — when were the roof, HVAC, electrical panel, plumbing, and water heater last replaced?
- What's the actual annual flood-insurance premium (NFIP or private), and is the property in a SFHA with mandatory coverage?
- Why hasn't it sold? Are there any deal-killer items the seller is aware of (foundation, flood, title, zoning, code violations)?
- Is there a deadline driving the sale (1031 exchange, divorce, estate, relocation)? That informs how much negotiation room exists.
- Crime grade is F in this area — have there been break-ins, vandalism, or insurance claims at this property in the last 3 years? What carrier currently insures it and at what premium?
- The area grade is low — what's the realistic commute time and amenity access for the typical tenant pool here? Any planned neighborhood developments (good or bad) we should know about?
- What's the average days-on-market for RENTAL listings here right now (not sales)? A rising rental-DOM trend means longer vacancies and softer asking-rent achievability than the comps imply.
- What's the recent tenant-quality profile in this submarket — average credit score on applications, eviction rate, late-payment / NSF rate, and stable-employment percentage? A property-management company in the area should have these aggregated.
- How much new for-sale + rental construction is in the pipeline within 1–3 miles? Heavy new supply typically softens prices + rents 12–24 months out; constrained supply supports both.
Investment metrics
- 1% rule
- 0.95% ✗
- Cap rate
- 7.48%
- Cash-on-cash
- 4.24%
- DSCR
- 1.19
- GRM
- 8.8
CMA / ARV
No comps found within radius.
Projected returns pro-forma
-3.0% appreciation · 4.29% rent growth · sell at horizon
- IRR
- -10.3%
- Equity multiple
- 0.62×
- Total profit
- $-19,100
- Equity at exit
- $26,824
- IRR
- 0.8%
- Equity multiple
- 1.06×
- Total profit
- $2,933
- Equity at exit
- $15,554
Cash invested: $50,372 (down + closing). Projections, not guarantees.
Landlord ↔ Tenant lean methodology
- Overall (STATE)
- 62 Landlord-Friendly
- State Pennsylvania
- 62 Landlord-Friendly · EVEN
- County
- — inherits STATE
- City
- — inherits STATE
ZIP-level market 17102
- Home prices YoY
- -3.9%
- Rents YoY
- 4.3%
- Active inventory
- 60
- Price-to-rent
- 8.8×
Monthly cashflow live
- Estimated rent
- $1,710 high interval (Pro) →
- Mortgage (P&I)
- −$943
- Tax from tax record
- −$155 /mo · $1,857/yr
- Insurance
- −$75
- Flood insurance flood zone
- −$56 /mo · $666/yr
- HOA
- −$0
- Vacancy / Maint / Mgmt
- −$359
- Net cashflow
- $122
Break-even live
Sensitivity live
| Price | -10% $224 | -5% $173 | +0% $122 | +5% $71 | +10% $20 |
|---|---|---|---|---|---|
| Rent | -10% $-13 | -5% $55 | +0% $122 | +5% $190 | +10% $257 |
| Rate | -1.0pp $213 | -0.5pp $168 | base $122 | +0.5pp $76 | +1.0pp $28 |
UW: 25.0% down · 7.5% · 30yr · 1.5% tax · 5.0% vac · 8.0% maint · 8.0% mgmt
Financing live
Cash to close
- Down payment
- $44,975
- Closing costs
- $5,397
- Reserves months
- —
- Total cash needed
- —
Loan-product check · same deal, 3 products live
Conventional
25% down · 7.5% · 30yr
- Down + closing
- —
- Monthly P&I
- —
- Monthly cashflow
- —
- DSCR
- —
- Eligible?
- —
Personal DTI + credit; lowest rate.
DSCR
20% down · 8.5% · 30yr
- Down + closing
- —
- Monthly P&I
- —
- Monthly cashflow
- —
- DSCR
- —
- Eligible?
- —
No personal income docs; deal must DSCR.
Hard money
10% down · 12.0% · 12mo
- Down + closing
- —
- Monthly P&I
- —
- Monthly cashflow
- —
- DSCR
- —
- Eligible?
- —
Short-term bridge; refi at stabilization.
Rent comps 13 comps
| Address | Beds | Baths | Sqft | Rent | $/sqft | DOM | Units | Dist |
|---|---|---|---|---|---|---|---|---|
| 1834 Green St Harrisburg, PA | 4.0 | 1.0 | 1792 | $1,495 | $0.83 | 24d | 1 | 0.06mi |
| 2032 Susquehanna St Harrisburg, PA | 4.0 | 1.5 | 1600 | $1,595 | $1.00 | 44d | 1 | 0.21mi |
| 2153 Penn St Harrisburg, PA | 4.0 | 2.0 | 1620 | $1,995 | $1.23 | 44d | 1 | 0.35mi |
| 2118 N 4th St Harrisburg, PA | 4.0 | 1.0 | 1383 | $1,595 | $1.15 | 44d | 1 | 0.37mi |
| 1202 Penn St Harrisburg, PA | 4.0 | 1.0 | 1706 | $1,495 | $0.88 | 44d | 1 | 0.56mi |
| 652 Emerald St Harrisburg, PA | 5.0 | 1.0 | 1550 | $1,740 | $1.12 | 44d | 1 | 0.70mi |
| 2406 Reel St Harrisburg, PA | 4.0 | 1.0 | 1500 | $1,395 | $0.93 | 44d | 1 | 0.71mi |
| 514 Radnor St Harrisburg, PA | 4.0 | 1.0 | 1498 | $1,600 | $1.07 | 44d | 1 | 0.92mi |
| 2715 N 6th St Harrisburg, PA | 4.0 | 1.0 | 1620 | $1,650 | $1.02 | 15d | 1 | 1.09mi |
| 2728 N 6th St Harrisburg, PA | 4.0 | 2.0 | 1786 | $1,750 | $0.98 | 15d | 1 | 1.11mi |
| 301 Chestnut St Harrisburg, PA | 4.0 | 1.0–2.5 | 1437 | $3,000 | $2.09 | 15d | 10 | 1.39mi |
| 301 Chestnut St Harrisburg, PA | 1.0–4.0 | 1.0–2.5 | 1437 | $2,600 | $1.81 | 44d | 1 | 1.39mi |
| 1207 Market St Harrisburg, PA | 4.0 | 1.5 | 1423 | $1,995 | $1.40 | 44d | 1 | 1.46mi |
Listing history 31 events
-
2026-04-27status Pending
-
2026-02-20price $179,900
-
2026-01-06$184,900 Active
-
2025-12-18historical
-
2025-12-01price $189,000
-
2025-09-24status Active
-
2025-09-03historical Active Under Contract
-
2025-08-13price $190,000
-
2025-07-29price $194,500
-
2025-06-24$199,000 Active
-
2025-06-13historical
-
2025-05-19price $199,999
-
2025-03-31price $212,900
-
2025-03-17price $213,900
-
2025-03-13status Active
-
2025-02-28historical
-
2025-02-07price $214,900
-
2024-12-09$219,900 Active
-
2024-11-11historical
-
2024-10-02price $219,900
-
2024-08-22price $224,900
-
2024-07-15price $229,000
-
2024-06-17price $239,990
-
2024-05-22$249,900 Active
-
2022-04-13soldstatus $110,000
-
2003-12-31soldstatus $64,000
-
2003-12-29soldstatus $64,000
-
2003-09-24historical
-
2003-09-24$64,000
-
2000-05-03soldstatus $53,000
-
1993-02-26soldstatus $12,000
ⓘ Source: listings_history table (triggers on properties + properties_extension) + one-shot
backfill from property_details.listing_events for pre-trigger history.
Tax reassessment forecast PA · Partial reset (capped growth)
- Current annual tax
- $1,857 · $155/mo
- Projected year-2 tax
- $2,350 · $196/mo
- Expected delta
- +$493/yr (+$41/mo · 26.5%)
ⓘ Screening estimate from a state-policy table — verify with the county assessor before closing.
Climate risk First Street
- Flood 10/10 Extreme FEMA zone X (shaded) · 99% chance over 30 yrs
- Wildfire 1/10 Low
- Heat 6/10 Major 7 d/yr ≥101°F today · 15 d/yr by 30 yrs out
- Wind 3/10 Moderate 5% chance of damaging wind over 30 yrs
- Air quality 2/10 Low 1 unhealthy d/yr today · 3 by 30 yrs out
Nearby sold comps map
Loading sold comps map…
Walkable amenities ~0.75 mi
Loading nearby amenities…
Taxation est. · year 1
- Rental income
- $20,520
- − Mortgage interest
- −$10,077
- − Property taxes
- −$1,857
- − Insurance
- −$1,566
- − Repairs & maintenance
- −$1,642
- − Management
- −$1,642
- − Depreciation
- −$5,233
- Taxable loss
- −$1,497
- Est. tax savings @ 24.0%
- +$359
- After-tax cash flow
- $1,826/yr
For passive investors: Depreciation is non-cash, so a rental often shows a tax loss while cash-flowing — sheltering income. Rental losses are passive: they offset passive income freely, and up to $25,000/yr can offset ordinary (W-2) income if you actively participate and your MAGI is under $100k (phasing out to $0 by $150k); unused losses carry forward. On sale, claimed depreciation is recaptured at up to 25%, and gains may owe capital-gains tax (a 1031 exchange can defer both). Figures are a year-1 estimate at your 24.0% rate — not tax advice; consult a CPA.
Schools (NCES district)
- District
- Harrisburg City SD
- NCES district ID
- 4211580
- Math proficiency
- 6% ▼ -6.00%
- Reading proficiency
- 13% ▼ -10.00%
- Median HH income
- $33,432
- Composite
- 7.6/100
- National rank
- #9945
- State rank
- #535 of 539 in PA
Livability — Harrisburg
- Score
- 84/100
- State rank
- #107
- US rank
- #826
Category grades
Schools grade is shown separately in the Schools card above.
Census & demographics
- Census place
- Harrisburg, PA
- County
- Dauphin County · 247,857 people
- City population
- 184,296
- Metro
- Harrisburg-Carlisle, PA
- Population (ZIP)
- 8,118
- Household income
- $54,573
- Rent vs Own
- Severe rent burden
- 720.0
Population outlook (Dauphin County) Hauer SSP2
- Today (2025)
- 281,628 people
- By 2030
- 283,549 · +0.7%
- By 2040
- 285,385 · +1.3%
- By 2050
- 286,188 · +1.6%
- By 2075
- 291,053 · +3.3%
- By 2100
- 282,374 · +0.3%
Race, ethnicity, and origin ACS 2023
- Neighborhood character
- Diverse neighborhood (Simpson 0.62)
- Race & ethnicity
- White 54% Black 25% Hispanic / Latino 14% Two or more races 7% Asian 2%
- Hispanic origin (detail)
- Mexican 1% Puerto Rican 8% Dominican 2%
- Common ancestry
- Romanian 5% Italian 2% Lithuanian 2%
- Foreign-born
- 7% · Canada, Vietnam, South Korea
- Languages at home
- 86% English-only · Spanish 9% Arabic 1% Other Asian/Pacific 1%
Political lean MEDSL · Dauphin
- 2024 margin
- Lean D (+5.9) · D 52.4% · R 46.5% · Other 1.1%
- 2008→2024 swing
- -3.1pp toward R · 2008: 9.1pp · 2024: 5.9pp
- All cycles
- 2024: D+5.9 2020: D+8.5 2016: D+2.8 2012: D+6.0 2008: D+9.1
Not yet ingested
- Civics
- —
Market trends
- HPI YoY
- ▼ -18.43%
- Current HPI
- 451.4739
- Rent YoY
- ▲ 4.29%
- Metro
- Harrisburg-Carlisle, PA
- State GDP YoY
- ▲ 1.68%
- F500 in state
- 34
Industry mix (Fortune 500 HQ in PA)
| Industry | F500 HQs | Revenue |
|---|---|---|
| Healthcare | 2 | $309B |
|
||
| Insurance | 2 | $27B |
|
||
| Telecommunications / Media | 1 | $124B |
|
||
| Industrial Distribution | 1 | $22B |
|
||
| Financial Services | 1 | $20B |
|
||
| Chemicals / Materials | 1 | $18B |
|
||
Price history
+1399.2% since first listed31 events — show timeline
- 2026-04-27 Pending — BRIGHT MLS
- 2026-02-20 Price Changed $179,900 BRIGHT MLS
- 2026-01-06 Listed $184,900 BRIGHT MLS
- 2025-12-18 Listing Removed — BRIGHT MLS
- 2025-12-01 Price Changed $189,000 BRIGHT MLS
- 2025-09-24 Relisted — BRIGHT MLS
- 2025-09-03 Contingent — BRIGHT MLS
- 2025-08-13 Price Changed $190,000 BRIGHT MLS
- 2025-07-29 Price Changed $194,500 BRIGHT MLS
- 2025-06-24 Listed $199,000 BRIGHT MLS
- 2025-06-13 Listing Removed — BRIGHT MLS
- 2025-05-19 Price Changed $199,999 BRIGHT MLS
- 2025-03-31 Price Changed $212,900 BRIGHT MLS
- 2025-03-17 Price Changed $213,900 BRIGHT MLS
- 2025-03-13 Relisted — BRIGHT MLS
- 2025-02-28 Listing Removed — BRIGHT MLS
- 2025-02-07 Price Changed $214,900 BRIGHT MLS
- 2024-12-09 Listed $219,900 BRIGHT MLS
- 2024-11-11 Listing Removed — BRIGHT MLS
- 2024-10-02 Price Changed $219,900 BRIGHT MLS
- 2024-08-22 Price Changed $224,900 BRIGHT MLS
- 2024-07-15 Price Changed $229,000 BRIGHT MLS
- 2024-06-17 Price Changed $239,990 BRIGHT MLS
- 2024-05-22 Listed $249,900 BRIGHT MLS
- 2022-04-13 Sold (Public Records) $110,000 Public Records
- 2003-12-31 Sold (Public Records) $64,000 Public Records
- 2003-12-29 Sold (MLS) $64,000 BRIGHT MLS
- 2003-09-24 Listed $64,000 BRIGHT MLS
- 2003-09-24 Listing Removed — BRIGHT MLS
- 2000-05-03 Sold (Public Records) $53,000 Public Records
- 1993-02-26 Sold (Public Records) $12,000 Public Records
Property tax history
+0.9%/yrLatest (2026): $1,857 · +1.6% YoY. Source: county tax records.
Cash-flow waterfall
monthlySold comps — $/sqft
last 12 mo · ≤1 miLoading sold comps…