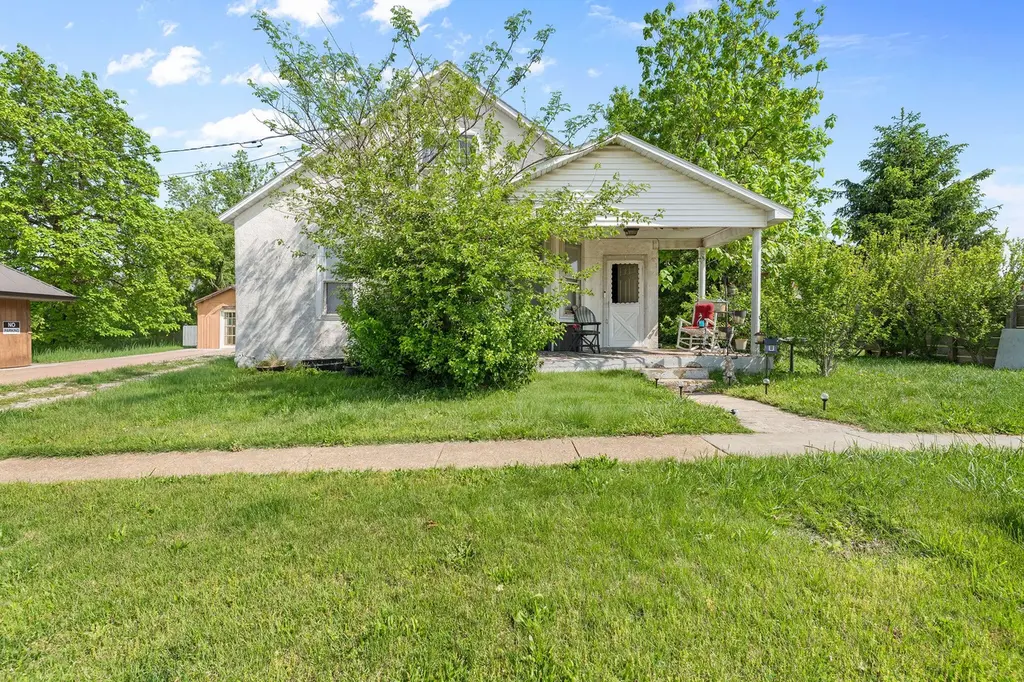
810 Ozark St · Cabool, MO
Flood risk 1/10 · Minimal
- FEMA flood zone
- X
- Chance of flooding over 30 yrs
- 0.0%
- Est. flood insurance / yr
- $507 – $1,088
Fire risk 3/10 · Minor
- Est. fire insurance / yr
- $1,054 – $1,958
Heat risk 5/10 · Moderate
- Hot days now (above 105°F)
- 7 days/yr
- Hot days in 30 yrs
- 20 days/yr
Wind risk 2/10 · Minimal
- Chance of severe wind over 30 yrs
- 1.0%
Air-quality risk 1/10 · Minimal
- Unhealthy air days now
- 0 days/yr
- Unhealthy air days in 30 yrs
- 0 days/yr
Risk factors via First Street. Map © Google.
Why this score? — see what drove the C- grade
The composite is a weighted blend of 9 inputs, each scored 0–100. Each bar is that input's sub-score; the figure is the points it added to the 100-point composite (weight × sub-score).
- Cash flow +14.9/30.0
- Appreciation +9.7/10.0
- ARV discount +7.5/15.0
- DSCR +4.5/10.0
- Livability +3.4/5.0
- 1% rule +2.8/10.0
- Rent growth +2.5/5.0
- Schools +2.5/10.0
- Condition / age +2.5/5.0
$167,500
🖨 Deal sheet (PDF) 📄 Offer letter ✓ Due diligence
Listing remarks
Charming 4-bedroom, 1-bath two-story home situated on a spacious lot in Cabool, offering flexibility for both residential and potential commercial use. With 1,654 square feet of living space, this property features a functional layout with room to update and add value. The home is livable as-is, providing a solid starting point for buyers while renovations or improvements are completed. While not perfect and in need of updates, it offers a great opportunity to build equity over time. The large lot adds additional potential for expansion, outdoor use, or business applications (buyer to verify zoning). Located in a high-visibility area with estimated 10,000-42,000 vehicles per week, this prop
Key facts
- 0.24 acre lot
- Garage
- Pool
Property features AI
Finance
- Other: Indoor pool
Exterior
- Parking: Driveway; 1-car garage
- Utilities: Public water; Public sewer
- Home design: Single-family residence; Two levels; Residential property
- Construction: Stucco exterior; Asphalt roof; Slab foundation; Built with two stories
- Exterior features: Covered patio/porch; City street frontage; Asphalt road surface; Publicly maintained road
Interior
- Kitchen: Electric cooktop; Refrigerator
- Flooring: Linoleum
- Bathrooms: 1 full bathroom
- Heating & cooling: Natural gas heating; Central heating; Ceiling fans; Window air conditioning units
- Interior features: Pantry
- Laundry & utility: Laundry on main level; Gas water heater
Neighborhood map
What this means for you Summary
Snapshot
- This is a 4-bed/1.0-bath other listed at $168k.
Deal economics
- At list price, monthly cash flow is $48 ($579/yr) — positive.
- The deal already cash-flows at list — no discount required.
- To meet the 1% rule (rent ≥ 1% of price), the offer needs to be $131k (22.0% below list).
- Recommended offer: $131k (22.0% below list) — sets the bar for 1% rule.
- Cap rate 6.6% vs local median 3.0% in Cabool — top-decile yield for the area; either an underpriced asset or a hidden risk that comps aren't pricing in. Stress-test before assuming the spread holds.
Location & tenants
- Location reads 67/100 on livability (#218 in MO) — a middle-class / working-renter tenant base. Strengths: cost of living A+, crime A, housing A-; Watch: amenities F, commute F, employment F.
- Cabool R-IV (rural): math 22% / reading 39% proficiency, ranked #275 of 324 in MO (top 85%) — families likely to look elsewhere, expect single-tenant / working-renter base with shorter leases.
- Zoned schools: Cabool Elem. (math 27% / reading 37%, grade F, #761 of 1,115 statewide, top 72%, 340 students, 98% FRL); Cabool Middle (math 21% / reading 40%, grade F, #283 of 391 statewide, top 74%, 222 students, 100% FRL); Cabool High (math 15% / reading 34%, grade F, #436 of 521 statewide, top 85%, 207 students, 100% FRL) — zoned schools average 99% FRL vs 57% district-wide (42 pts higher); higher-poverty schools than district average — tighter screening recommended.
- Market conditions: 63 active listings in the ZIP; 10 units permitted in Texas County in 2024 (5 in 5+ unit buildings).
Forward outlook
- In year one you build about $17k of equity ($1k loan paydown + $16k appreciation (9.5% local appreciation)).
- Texas County population projected at -11% by 2050 — secular population decline; favor cash flow + early exit over multi-decade hold.
- At projected returns (9.5% appreciation + 3.0% rent growth), your $47k cash investment doubles in ~3 years — after that, you're playing with house money.
- By year 3, paydown + projected appreciation supports a ~$43k cash-out refi (75% LTV) — recoverable capital for the next deal without selling this one.
Negotiation context
- It's been on market 52 days — a 3% lower offer ($162k) is reasonable based on typical stale-listing flexibility.
Risks & watch-outs
- Watch-outs: built in 1900 — expect roof / HVAC / electrical / plumbing capex.
- Climate carrying-cost: extreme-heat days projected 7→20/yr by 2055 (HVAC capex compounding) — expect insurance premiums to compound above CPI over the hold.
Questions for the listing agent
- It's been on market 52 days. Have you received any prior offers? Is the seller open to a 22% concession, seller financing, or rate buy-down credit?
- Built in 1900 — when were the roof, HVAC, electrical panel, plumbing, and water heater last replaced?
- Is there a deadline driving the sale (1031 exchange, divorce, estate, relocation)? That informs how much negotiation room exists.
- Schools are D-rated, which usually means shorter tenancies and higher turnover. Who's the typical renter profile here, and what's been the actual vacancy rate?
- What's the average days-on-market for RENTAL listings here right now (not sales)? A rising rental-DOM trend means longer vacancies and softer asking-rent achievability than the comps imply.
- What's the recent tenant-quality profile in this submarket — average credit score on applications, eviction rate, late-payment / NSF rate, and stable-employment percentage? A property-management company in the area should have these aggregated.
- How much new for-sale + rental construction is in the pipeline within 1–3 miles? Heavy new supply typically softens prices + rents 12–24 months out; constrained supply supports both.
Investment metrics
- 1% rule
- 0.78% ✗
- Cap rate
- 6.64%
- Cash-on-cash
- 1.23%
- DSCR
- 1.05
- GRM
- 10.7
CMA / ARV
No comps found within radius.
Projected returns pro-forma
9.46% appreciation · 3.0% rent growth · sell at horizon
- IRR
- 24.0%
- Equity multiple
- 2.88×
- Total profit
- $88,049
- Equity at exit
- $144,343
- IRR
- 21.4%
- Equity multiple
- 6.44×
- Total profit
- $255,240
- Equity at exit
- $304,561
Cash invested: $46,900 (down + closing). Projections, not guarantees.
Landlord ↔ Tenant lean methodology
- Overall (STATE)
- 81 Strongly Landlord-Friendly
- State Missouri
- 81 Strongly Landlord-Friendly · R+10
- County
- — inherits STATE
- City
- — inherits STATE
ZIP-level market 65689
- Home prices YoY
- 4.2%
- Active inventory
- 63
- Price-to-rent
- 10.7×
Monthly cashflow live
- Estimated rent
- $1,306 medium interval (Pro) →
- Mortgage (P&I)
- −$878
- Tax from tax record
- −$35 /mo · $423/yr
- Insurance
- −$70
- HOA
- −$0
- Vacancy / Maint / Mgmt
- −$274
- Net cashflow
- $48
Break-even live
Sensitivity live
| Price | -10% $143 | -5% $96 | +0% $48 | +5% $1 | +10% $-47 |
|---|---|---|---|---|---|
| Rent | -10% $-55 | -5% $-3 | +0% $48 | +5% $100 | +10% $151 |
| Rate | -1.0pp $133 | -0.5pp $91 | base $48 | +0.5pp $5 | +1.0pp $-39 |
UW: 25.0% down · 7.5% · 30yr · 1.5% tax · 5.0% vac · 8.0% maint · 8.0% mgmt
Financing live
Cash to close
- Down payment
- $41,875
- Closing costs
- $5,025
- Reserves months
- —
- Total cash needed
- —
Loan-product check · same deal, 3 products live
Conventional
25% down · 7.5% · 30yr
- Down + closing
- —
- Monthly P&I
- —
- Monthly cashflow
- —
- DSCR
- —
- Eligible?
- —
Personal DTI + credit; lowest rate.
DSCR
20% down · 8.5% · 30yr
- Down + closing
- —
- Monthly P&I
- —
- Monthly cashflow
- —
- DSCR
- —
- Eligible?
- —
No personal income docs; deal must DSCR.
Hard money
10% down · 12.0% · 12mo
- Down + closing
- —
- Monthly P&I
- —
- Monthly cashflow
- —
- DSCR
- —
- Eligible?
- —
Short-term bridge; refi at stabilization.
Listing history 19 events
-
2026-06-21days on market $167,500 Active 52 DOM
-
2026-06-21days on market $167,500 Active 51 DOM
-
2026-06-18days on market $167,500 Active 49 DOM
-
2026-06-17days on market $167,500 Active 48 DOM
-
2026-06-16days on market $167,500 Active 47 DOM
-
2026-06-16price $167,500 Active 46 DOM
-
2026-06-15days on market $185,000 Active 46 DOM
-
2026-06-13days on market $185,000 Active 44 DOM
-
2026-06-12days on market $185,000 Active 43 DOM
-
2026-06-09days on market $185,000 Active 40 DOM
-
2026-06-08days on market $185,000 Active 39 DOM
-
2026-06-07days on market $185,000 Active 38 DOM
-
2026-06-07days on market $185,000 Active 37 DOM
-
2026-06-04days on market $185,000 Active 34 DOM
-
2026-06-02days on market $185,000 Active 33 DOM
-
2026-06-01days on market $185,000 Active 32 DOM
-
2026-05-31days on market $185,000 Active 31 DOM
-
2026-04-30$185,000 Active 930-char remark
-
2026-04-21historical $185,000 930-char remark
ⓘ Source: listings_history table (triggers on properties + properties_extension) + one-shot
backfill from property_details.listing_events for pre-trigger history.
Tax reassessment forecast MO · Resets to sale price
- Current annual tax
- $423 · $35/mo
- Projected year-2 tax
- $1,625 · $135/mo
- Expected delta
- +$1,202/yr (+$100/mo · 284.3%)
ⓘ Screening estimate from a state-policy table — verify with the county assessor before closing.
Climate risk First Street
- Flood 1/10 Low FEMA zone X · 0% chance over 30 yrs
- Wildfire 3/10 Moderate
- Heat 5/10 Major 7 d/yr ≥105°F today · 20 d/yr by 30 yrs out
- Wind 2/10 Low 100% chance of damaging wind over 30 yrs
- Air quality 1/10 Low 0 unhealthy d/yr today · 0 by 30 yrs out
Nearby sold comps map
Loading sold comps map…
Walkable amenities ~0.75 mi
Loading nearby amenities…
Taxation est. · year 1
- Rental income
- $15,671
- − Mortgage interest
- −$9,383
- − Property taxes
- −$423
- − Insurance
- −$838
- − Repairs & maintenance
- −$1,254
- − Management
- −$1,254
- − Depreciation
- −$4,873
- Taxable loss
- −$2,352
- Est. tax savings @ 24.0%
- +$565
- After-tax cash flow
- $1,143/yr
For passive investors: Depreciation is non-cash, so a rental often shows a tax loss while cash-flowing — sheltering income. Rental losses are passive: they offset passive income freely, and up to $25,000/yr can offset ordinary (W-2) income if you actively participate and your MAGI is under $100k (phasing out to $0 by $150k); unused losses carry forward. On sale, claimed depreciation is recaptured at up to 25%, and gains may owe capital-gains tax (a 1031 exchange can defer both). Figures are a year-1 estimate at your 24.0% rate — not tax advice; consult a CPA.
Schools (NCES district)
- District
- Cabool R-IV
- NCES district ID
- 2906430
- Math proficiency
- 22% ▼ -7.00%
- Reading proficiency
- 39% ▲ 1.00%
- Median HH income
- $32,537
- Composite
- 24.88/100
- National rank
- #7584
- State rank
- #275 of 324 in MO
Livability — Cabool
- Score
- 67/100
- State rank
- #218
- US rank
- #10822
Category grades
Schools grade is shown separately in the Schools card above.
Census & demographics
- Census place
- Cabool, MO
- City population
- 4,273
- Population (ZIP)
- 4,273
Population outlook (Texas County) Hauer SSP2
- Today (2025)
- 24,648 people
- By 2030
- 23,981 · -2.7%
- By 2040
- 22,840 · -7.3%
- By 2050
- 21,832 · -11.4%
- By 2075
- 19,481 · -21.0%
- By 2100
- 16,634 · -32.5%
Race, ethnicity, and origin ACS 2023
- Neighborhood character
- Predominantly White (86%)
- Race & ethnicity
- White 86% Two or more races 7% Hispanic / Latino 4% Asian 2%
- Common ancestry
- Romanian 4% Iranian 2% Lithuanian 1%
- Foreign-born
- 2% · Canada
- Languages at home
- 97% English-only · Spanish 3%
Political lean MEDSL · Texas
- 2024 margin
- Solid R (+71.7) · D 13.8% · R 85.5%
- 2008→2024 swing
- -36.7pp toward R · 2008: -35.1pp · 2024: -71.7pp
- All cycles
- 2024: R+71.7 2020: R+68.6 2016: R+65.4 2012: R+44.1 2008: R+35.1
Not yet ingested
- Civics
- —
Market trends
- HPI YoY
- ▲ 9.46%
- Current HPI
- 232.9575
- Rent YoY
- —
- Metro
- —
- State GDP YoY
- ▲ 1.84%
- F500 in state
- 20
Industry mix (Fortune 500 HQ in MO)
| Industry | F500 HQs | Revenue |
|---|---|---|
| Healthcare | 1 | $163B |
|
||
| Insurance | 1 | $21B |
|
||
| Industrial Technology | 1 | $17B |
|
||
| Retail | 1 | $16B |
|
||
| Industrial Distribution | 1 | $10B |
|
||
| Utilities | 1 | $9B |
|
||
Price history
-9.5% since first listed3 events — show timeline
- 2026-06-15 Price Changed $167,500 SOMO
- 2026-04-30 Listed $185,000 SOMO
- 2026-04-21 Coming Soon $185,000 SOMO
Property tax history
+4.0%/yrLatest (2025): $423 · +1.5% YoY. Source: county tax records.
Cash-flow waterfall
monthlySold comps — $/sqft
last 12 mo · ≤1 miLoading sold comps…