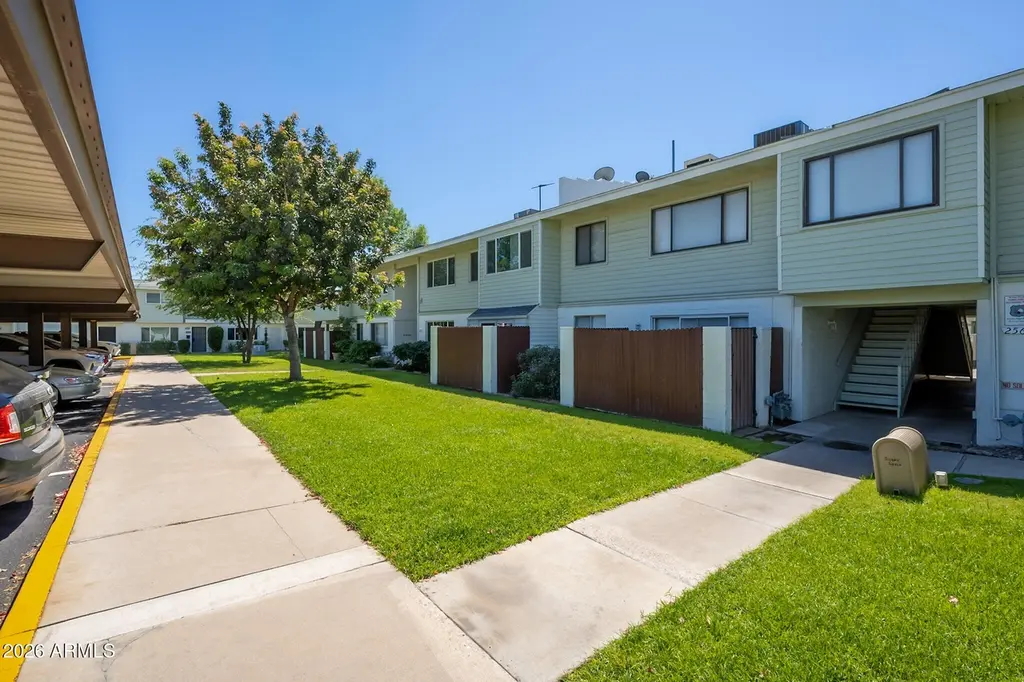
2569 W Berridge Ln Unit D-115 · Phoenix, AZ
Flood risk 1/10 · Minimal
- FEMA flood zone
- X (shaded)
- Chance of flooding over 30 yrs
- 0.0%
- Est. flood insurance / yr
- $507 – $1,088
Fire risk 1/10 · Minimal
- Est. fire insurance / yr
- $610 – $1,132
Heat risk 9/10 · Severe
- Hot days now (above 112°F)
- 6 days/yr
- Hot days in 30 yrs
- 16 days/yr
Wind risk 1/10 · Minimal
- Chance of severe wind over 30 yrs
- —
Air-quality risk 3/10 · Minor
- Unhealthy air days now
- 3 days/yr
- Unhealthy air days in 30 yrs
- 3 days/yr
Risk factors via First Street. Map © Google.
Why this score? — see what drove the C grade
The composite is a weighted blend of 9 inputs, each scored 0–100. Each bar is that input's sub-score; the figure is the points it added to the 100-point composite (weight × sub-score).
- Cash flow +21.2/30.0
- 1% rule +10.0/10.0
- ARV discount +7.5/15.0
- DSCR +6.8/10.0
- Livability +3.8/5.0
- Condition / age +2.5/5.0
- Rent growth +2.4/5.0
- Schools +2.3/10.0
- Appreciation +0.0/10.0
$65,000
🖨 Deal sheet (PDF) 📄 Offer letter ✓ Due diligence
Listing remarks
Come see this updated DOWNSTAIRS (no stairs) unit featuring a Trane HVAC system (2021), dual-pane windows (2019), and wood-look plank tile flooring (2019). The patio had previously been enclosed to create a nice bedroom area with pool view, newer cellular shades and a ceiling fan. Recent improvements include fresh interior paint (2025), a new security door, and more. Enjoy the convenience of a covered assigned parking space and coin op laundry room onsite. The monthly community fee is very affordable and includes water, sewer, trash, landscaping, property taxes, roof, blanket insurance, pool access, and common area maintenance.
Key facts
- Dual-pane windows
- Trane hvac system
- Security door
Tags
Property features AI
Finance
- Other: Community pool
- HOA & community: Monthly association fee of $257; Association covers roof repair and replacement, insurance, sewer, pest control, front yard maintenance, trash, water, and exterior maintenance
Exterior
- Parking: One assigned covered parking space; One carport space
- Security: Gated community
- Utilities: City water; Public sewer
- Home design: Co-operative ownership; Apartment (attached property)
- Construction: Painted block construction; Composition roof; Building area reported by owner
- Exterior features: Block fencing; No notable lot features listed; Owner-listed lot size source
Interior
- Kitchen: Refrigerator; Garbage disposal; Pantry; Eat-in kitchen layout
- Bedrooms: One possible bedroom
- Flooring: Tile
- Bathrooms: One full bathroom
- Heating & cooling: Electric heating; Central air; Ceiling fan(s)
- Interior features: High-speed internet; Eat-in kitchen; No interior steps; Pantry; Dual-pane windows
- Laundry & utility: Community laundry
Neighborhood map
What this means for you Summary
Snapshot
- This is a 1-bed/1.0-bath condo listed at $65k.
Deal economics
- At list price, monthly cash flow is $94 ($1k/yr) — positive.
- The deal already cash-flows at list — no discount required.
- Meets the 1% rule at list price ($1k rent vs $65k).
- Recommended offer: $61k (6.0% below list) — sets the bar for market timing.
- Cap rate 8.0% vs local median 3.3% in Phoenix — top-decile yield for the area; either an underpriced asset or a hidden risk that comps aren't pricing in. Stress-test before assuming the spread holds.
Location & tenants
- Location reads 75/100 on livability (#16 in AZ, #3,924 nationally) — a middle-class / working-renter tenant base. Strengths: amenities A+, commute A+, housing A+; Watch: health & safety C-, crime F.
- Glendale Union High School District (4285) (urban): math 23% / reading 31% proficiency, ranked #130 of 249 in AZ (top 52%) — low school quality limits family demand, transient renter base, plan for 1-2y turnover.
- Zoned schools: Maryland Elementary School (math 7% / reading 21%, grade F, #917 of 1,109 statewide, top 83%, 554 students, 83% FRL); Washington High School (math 21% / reading 26%, grade F, #206 of 381 statewide, top 54%, 1,756 students, 60% FRL).
- Market conditions: Rents soft (-0.3%/yr); 86 active listings in the ZIP; 40 comparable units currently listed for rent nearby; rentals leasing fast (median 0d on market — plan ~1-2 weeks tenant-placement turnaround); 36,011 units permitted in Maricopa County in 2024 (12,801 in 5+ unit buildings).
Forward outlook
- Local home prices are declining (-3.0%/yr); year-one equity from $449 of loan paydown is wiped out by about $2k of value loss. Plan a longer hold.
- Maricopa County population projected at +38% by 2050 — long-run rental-demand tailwind backs the buy-and-hold thesis.
Negotiation context
- It's been on market 74 days — a 6% lower offer ($61k) is reasonable based on typical stale-listing flexibility.
- 6 sale attempts since 9y ago; this cycle's ask has dropped $10k (13%) from the opening price — seller is motivated, your offer sets the floor, not the list.
- Current owner paid $21k; list at $65k implies a 210% gain — meaningful room to come down on a strong offer.
Risks & watch-outs
- Watch-outs: HOA is 25% of rent.
- Climate carrying-cost: extreme-heat days projected 6→16/yr by 2055 (HVAC capex compounding) — expect insurance premiums to compound above CPI over the hold.
Questions for the listing agent
- It's been on market 74 days. Have you received any prior offers? Is the seller open to a 6% concession, seller financing, or rate buy-down credit?
- Built in 1963 — when were the roof, HVAC, electrical panel, plumbing, and water heater last replaced?
- What does the HOA fee cover, when was the last increase, and are there any pending special assessments or reserve-fund shortfalls?
- Any open or pending special assessments — roof, HVAC, plumbing, elevator, façade? What's the per-unit balance and payoff schedule, and is the seller paying it off at close or rolling it to the buyer?
- Why hasn't it sold? Are there any deal-killer items the seller is aware of (foundation, flood, title, zoning, code violations)?
- Is there a deadline driving the sale (1031 exchange, divorce, estate, relocation)? That informs how much negotiation room exists.
- Crime grade is F in this area — have there been break-ins, vandalism, or insurance claims at this property in the last 3 years? What carrier currently insures it and at what premium?
- What's the average days-on-market for RENTAL listings here right now (not sales)? A rising rental-DOM trend means longer vacancies and softer asking-rent achievability than the comps imply.
- What's the recent tenant-quality profile in this submarket — average credit score on applications, eviction rate, late-payment / NSF rate, and stable-employment percentage? A property-management company in the area should have these aggregated.
- How much new apartment / multifamily construction is in the pipeline within 1–3 miles? Heavy new supply (>2% of stock underway) typically softens rents 12–24 months out; light construction supports rent growth.
Investment metrics
- 1% rule
- 1.56% ✓
- Cap rate
- 8.03%
- Cash-on-cash
- 6.20%
- DSCR
- 1.28
- GRM
- 5.3
CMA / ARV
No comps found within radius.
Projected returns pro-forma
-3.0% appreciation · 0.0% rent growth · sell at horizon
- IRR
- -11.6%
- Equity multiple
- 0.60×
- Total profit
- $-7,342
- Equity at exit
- $9,692
- IRR
- -10.8%
- Equity multiple
- 0.48×
- Total profit
- $-9,454
- Equity at exit
- $5,620
Cash invested: $18,200 (down + closing). Projections, not guarantees.
Landlord ↔ Tenant lean methodology
- Overall (STATE)
- 87 Strongly Landlord-Friendly
- State Arizona
- 87 Strongly Landlord-Friendly · R+3
- County
- — inherits STATE
- City
- — inherits STATE
ZIP-level market 85017
- Home prices YoY
- -14.4%
- Rents YoY
- -0.3%
- Active inventory
- 86
- Price-to-rent
- 5.3×
Monthly cashflow live
- Estimated rent
- $1,013 high interval (Pro) →
- Mortgage (P&I)
- −$341
- Tax est. 1.5%
- −$81 /mo · $975/yr
- Insurance
- −$27
- HOA
- −$257
- Vacancy / Maint / Mgmt
- −$213
- Net cashflow
- $94
Break-even live
Sensitivity live
| Price | -10% $139 | -5% $116 | +0% $94 | +5% $72 | +10% $49 |
|---|---|---|---|---|---|
| Rent | -10% $14 | -5% $54 | +0% $94 | +5% $134 | +10% $174 |
| Rate | -1.0pp $127 | -0.5pp $111 | base $94 | +0.5pp $77 | +1.0pp $60 |
UW: 25.0% down · 7.5% · 30yr · 1.5% tax · 5.0% vac · 8.0% maint · 8.0% mgmt
Financing live
Cash to close
- Down payment
- $16,250
- Closing costs
- $1,950
- Reserves months
- —
- Total cash needed
- —
Loan-product check · same deal, 3 products live
Conventional
25% down · 7.5% · 30yr
- Down + closing
- —
- Monthly P&I
- —
- Monthly cashflow
- —
- DSCR
- —
- Eligible?
- —
Personal DTI + credit; lowest rate.
DSCR
20% down · 8.5% · 30yr
- Down + closing
- —
- Monthly P&I
- —
- Monthly cashflow
- —
- DSCR
- —
- Eligible?
- —
No personal income docs; deal must DSCR.
Hard money
10% down · 12.0% · 12mo
- Down + closing
- —
- Monthly P&I
- —
- Monthly cashflow
- —
- DSCR
- —
- Eligible?
- —
Short-term bridge; refi at stabilization.
Rent comps 40 comps
| Address | Beds | Baths | Sqft | Rent | $/sqft | DOM | Units | Dist |
|---|---|---|---|---|---|---|---|---|
| 6131 N 27th Ave Phoenix, AZ | 2.0 | 1.0–2.0 | 661 | $1,006 | $1.52 | 0d | 27 | 0.12mi |
| 6236 N Black Canyon Hwy Unit 311 Phoenix, AZ | 1.0 | 1.0 | 516 | $845 | $1.64 | 19d | 1 | 0.20mi |
| 6236 N Black Canyon Hwy Phoenix, AZ | 1.0 | 1.0 | 516 | $845 | $1.64 | 0d | 17 | 0.21mi |
| 6241 N 27th Ave Apt 318 Phoenix, AZ | 1.0 | 1.0 | 656 | $899 | $1.37 | 0d | 1 | 0.26mi |
| 6027 N 23rd Ave Phoenix, AZ | 1.0–3.0 | 1.0–2.0 | 995 | $1,095 | $1.10 | 0d | 1 | 0.35mi |
| 2540 W Maryland Ave Phoenix, AZ | 1.0–2.0 | 1.0 | 725 | $1,049 | $1.45 | 0d | 2 | 0.43mi |
| 6040 N 21st Ave Unit 5 Phoenix, AZ | 1.0 | 1.0 | 600 | $899 | $1.50 | 0d | 1 | 0.56mi |
| 6040 N 21st Ave Unit 5 Phoenix, AZ | 1.0 | 1.0 | 600 | $949 | $1.58 | 24d | 1 | 0.56mi |
| 2520 W McLellan Blvd Phoenix, AZ | 2.0–3.0 | 1.0 | 800 | $849 | $1.06 | 0d | 6 | 0.58mi |
| 2501 W Ocotillo Rd Phoenix, AZ | 1.0–2.0 | 1.0 | 740 | $795 | $1.07 | 0d | 4 | 0.60mi |
| 2041 W Berridge Ln Unit 1 Phoenix, AZ | 1.0 | 1.0 | 600 | $813 | $1.35 | 0d | 1 | 0.61mi |
| 2041 W Berridge Ln Unit 1 Phoenix, AZ | 1.0 | 1.0 | 600 | $843 | $1.41 | 12d | 1 | 0.61mi |
| 2040 W Berridge Ln Apt 24 Phoenix, AZ | 1.0 | 1.0 | 570 | $1,195 | $2.10 | 0d | 1 | 0.61mi |
| 2512 W Ocotillo Rd Phoenix, AZ | 2.0 | 1.0 | 750 | $899 | $1.20 | 7d | 1 | 0.64mi |
| 2502 W Ocotillo Rd Phoenix, AZ | 1.0–2.0 | 1.0 | 650 | $1,099 | $1.69 | 0d | 2 | 0.64mi |
| 6721 N 25th Dr Phoenix, AZ | 2.0 | 1.0 | 750 | $950 | $1.27 | 0d | 1 | 0.66mi |
| 6801 N 25th Dr Phoenix, AZ | 1.0–2.0 | 1.0 | 750 | $949 | $1.27 | 0d | 1 | 0.74mi |
| 2534 W Georgia Ave Phoenix, AZ | 1.0 | 1.0 | 600 | $775 | $1.29 | 0d | 2 | 0.74mi |
| 1919 W Berridge Ln Unit 5 Phoenix, AZ | 1.0 | 1.0 | 600 | $843 | $1.41 | 0d | 1 | 0.77mi |
| 6250 N 19th Ave Phoenix, AZ | 1.0–2.0 | 1.0–2.0 | 731 | $975 | $1.33 | 0d | 9 | 0.77mi |
| 6805 N 27th Ave Unit 321 Phoenix, AZ | 2.0 | 1.0 | 640 | $995 | $1.55 | 0d | 1 | 0.77mi |
| 6805 N 27th Ave Unit 206 Phoenix, AZ | 2.0 | 1.0 | 640 | $1,143 | $1.79 | 0d | 1 | 0.77mi |
| 6819 N 27th Ave Phoenix, AZ | 1.0 | 1.0 | 600 | $974 | $1.62 | 0d | 5 | 0.79mi |
| 2542 W Colter St Phoenix, AZ | 1.0 | 1.0 | 375 | $1,135 | $3.03 | 0d | 4 | 0.81mi |
| 2302 W Colter St Apt A101 Phoenix, AZ | 2.0 | 1.0 | 713 | $995 | $1.40 | 0d | 1 | 0.86mi |
| 1737 W Keim Dr Phoenix, AZ | 1.0 | 1.0 | 435 | $950 | $2.18 | 21d | 1 | 0.98mi |
| 6545 N 19th Ave Phoenix, AZ | 1.0 | 1.0 | 702 | $970 | $1.38 | 0d | 6 | 0.99mi |
| 7050 N 27th Ave Phoenix, AZ | 1.0 | 1.0 | 450 | $1,300 | $2.89 | 0d | 4 | 0.99mi |
| 2250 W Glendale Ave Unit 2250-1 Phoenix, AZ | 1.0 | 1.0 | 640 | $998 | $1.56 | 0d | 1 | 0.99mi |
| 2250 W Glendale Ave Phoenix, AZ | 1.0 | 1.0 | 640 | $999 | $1.56 | 0d | 1 | 0.99mi |
| 2234 W Medlock Dr Unit 4 Phoenix, AZ | 1.0 | 1.0 | 650 | $1,650 | $2.54 | 24d | 1 | 1.06mi |
| 1802 W Maryland Ave Phoenix, AZ | 1.0–3.0 | 1.0–2.0 | 994 | $1,099 | $1.11 | 0d | 19 | 1.07mi |
| 6635 N 19th Ave Phoenix, AZ | 2.0 | 1.0–2.0 | 697 | $1,160 | $1.66 | 0d | 1 | 1.10mi |
| 5656 N 17th Ave Phoenix, AZ | 2.0 | 1.0 | 642 | $1,174 | $1.83 | 0d | 8 | 1.10mi |
| 7150 N 27th Ave Phoenix, AZ | 1.0 | 1.0 | 550 | $750 | $1.36 | 0d | 1 | 1.11mi |
| 1780 W Missouri Ave Phoenix, AZ | 1.0 | 1.0 | 522 | $1,584 | $3.03 | 0d | 1 | 1.14mi |
| 1701 W Tuckey Ln #132 Phoenix, AZ | 1.0 | 1.0 | 727 | $995 | $1.37 | 26d | 1 | 1.16mi |
| 2020 W Glendale Ave Phoenix, AZ | 1.0–2.0 | 1.0–2.0 | 802 | $1,000 | $1.25 | 0d | 6 | 1.16mi |
| 1701 W Tuckey Ln #209 Phoenix, AZ | 1.0 | 1.0 | 727 | $1,300 | $1.79 | 3d | 1 | 1.17mi |
| 1717 W Missouri Ave Phoenix, AZ | 1.0 | 1.0 | 600 | $912 | $1.52 | 0d | 3 | 1.21mi |
HOA detail condo
- Monthly dues
- $257 · $3,084/yr
- Likely covers
- watersewertrashlandscapingpoolsecurityparking
- Assessments
- None detected in remarks — confirm with the listing agent.
Listing history 31 events
-
2026-06-21days on market $65,000 Active 74 DOM
-
2026-06-18days on market $65,000 Active 71 DOM
-
2026-06-17days on market $65,000 Active 70 DOM
-
2026-06-16days on market $65,000 Active 69 DOM
-
2026-06-15days on market $65,000 Active 68 DOM
-
2026-06-13days on market $65,000 Active 66 DOM
-
2026-06-09days on market $65,000 Active 62 DOM
-
2026-06-08days on market $65,000 Active 61 DOM
-
2026-06-07days on market $65,000 Active 60 DOM
-
2026-06-04pricedays on market $65,000 Active 57 DOM
-
2026-06-03days on market $68,000 Active 56 DOM
-
2026-06-02days on market $68,000 Active 55 DOM
-
2026-06-01days on market $68,000 Active 54 DOM
-
2026-05-31days on market $68,000 Active 53 DOM
-
2026-05-07price $68,000
-
2026-04-24price $70,000
-
2026-04-08$75,000 Active
-
2025-10-18status Active
-
2025-09-27status Pending
-
2025-09-27historical
-
2025-08-01price $70,000
-
2025-08-01$70,000 Active
-
2025-07-19status Pending
-
2025-07-19historical
-
2025-06-16status Active
-
2025-06-14status Pending
-
2025-04-22$75,000 Active
-
2017-04-30soldstatus $21,000 Closed
-
2017-04-25status Pending
-
2017-04-21historical
-
2017-04-20$22,000 Active
ⓘ Source: listings_history table (triggers on properties + properties_extension) + one-shot
backfill from property_details.listing_events for pre-trigger history.
Climate risk First Street
- Flood 1/10 Low FEMA zone X (shaded) · 0% chance over 30 yrs
- Wildfire 1/10 Low
- Heat 9/10 Extreme 6 d/yr ≥112°F today · 16 d/yr by 30 yrs out
- Wind 1/10 Low
- Air quality 3/10 Moderate 3 unhealthy d/yr today · 3 by 30 yrs out
Nearby sold comps map
Loading sold comps map…
Walkable amenities ~0.75 mi
Loading nearby amenities…
Taxation est. · year 1
- Rental income
- $12,155
- − Mortgage interest
- −$3,641
- − Property taxes
- −$975
- − Insurance
- −$325
- − Repairs & maintenance
- −$972
- − Management
- −$972
- − HOA
- −$3,084
- − Depreciation
- −$1,891
- Taxable income
- $294
- Est. tax owed @ 24.0%
- −$71
- After-tax cash flow
- $1,057/yr
For passive investors: Depreciation is non-cash, so a rental often shows a tax loss while cash-flowing — sheltering income. Rental losses are passive: they offset passive income freely, and up to $25,000/yr can offset ordinary (W-2) income if you actively participate and your MAGI is under $100k (phasing out to $0 by $150k); unused losses carry forward. On sale, claimed depreciation is recaptured at up to 25%, and gains may owe capital-gains tax (a 1031 exchange can defer both). Figures are a year-1 estimate at your 24.0% rate — not tax advice; consult a CPA.
Schools (NCES district)
- District
- Glendale Union High School District (4285)
- NCES district ID
- 0403450
- Math proficiency
- 23% ▼ -38.00%
- Reading proficiency
- 31% ▼ -19.00%
- Median HH income
- $40,846
- Composite
- 22.81/100
- National rank
- #8020
- State rank
- #130 of 249 in AZ
Livability — Phoenix
- Score
- 75/100
- State rank
- #16
- US rank
- #3924
Category grades
Schools grade is shown separately in the Schools card above.
Census & demographics
- Census place
- Phoenix, AZ
- County
- Maricopa County · 4,537,380 people
- City population
- 1,500,198
- Metro
- Phoenix-Mesa-Chandler, AZ
- Population (ZIP)
- 46,129
- Household income
- $58,346
- Rent vs Own
- Severe rent burden
- 1843.0
Population outlook (Maricopa County) Hauer SSP2
- Today (2025)
- 4,979,203 people
- By 2030
- 5,378,229 · +8.0%
- By 2040
- 6,156,598 · +23.6%
- By 2050
- 6,872,376 · +38.0%
- By 2075
- 8,401,270 · +68.7%
- By 2100
- 9,247,439 · +85.7%
Race, ethnicity, and origin ACS 2023
- Neighborhood character
- Diverse neighborhood (Simpson 0.58)
- Race & ethnicity
- Hispanic / Latino 61% Two or more races 31% White 20% Black 10% Asian 3% Native American 2%
- Hispanic origin (detail)
- Mexican 54%
- Common ancestry
- Iranian 1% Italian 1% Portuguese 1%
- Foreign-born
- 31% · Canada, Philippines, Vietnam
- Languages at home
- 40% English-only · Spanish 51% Other Asian/Pacific 2% Other Indo-European 1%
Political lean MEDSL · Maricopa
- 2024 margin
- Toss-up / Even · D 47.7% · R 51.2% · Other 1.1%
- 2008→2024 swing
- +7.1pp toward D · 2008: -10.6pp · 2024: -3.5pp
- All cycles
- 2024: R+3.5 2020: D+2.2 2016: R+3.5 2012: R+12.0 2008: R+10.6
Not yet ingested
- Civics
- —
Market trends
- HPI YoY
- ▼ -79.21%
- Current HPI
- 471.0211
- Rent YoY
- ▼ -0.33%
- Metro
- Phoenix-Mesa-Chandler, AZ
- State GDP YoY
- ▲ 4.54%
- F500 in state
- 20
Industry mix (Fortune 500 HQ in AZ)
| Industry | F500 HQs | Revenue |
|---|---|---|
| Technology | 2 | $13B |
|
||
| Mining / Metals | 1 | $23B |
|
||
| Environmental Services | 1 | $16B |
|
||
| Metals / Steel | 1 | $14B |
|
||
| Technology Distribution | 1 | $9B |
|
||
| Homebuilding | 1 | $8B |
|
||
Price history
+209.1% since first listed17 events — show timeline
- 2026-05-07 Price Changed $68,000 ARMLS
- 2026-04-24 Price Changed $70,000 ARMLS
- 2026-04-08 Listed $75,000 ARMLS
- 2025-10-18 Relisted — ARMLS
- 2025-09-27 Pending — ARMLS
- 2025-09-27 Listing Removed — ARMLS
- 2025-08-01 Price Changed $70,000 ARMLS
- 2025-08-01 Listed $70,000 ARMLS
- 2025-07-19 Pending — ARMLS
- 2025-07-19 Listing Removed — ARMLS
- 2025-06-16 Relisted — ARMLS
- 2025-06-14 Pending — ARMLS
- 2025-04-22 Listed $75,000 ARMLS
- 2017-04-30 Sold (MLS) $21,000 ARMLS
- 2017-04-25 Pending — ARMLS
- 2017-04-21 Listing Removed — ARMLS
- 2017-04-20 Listed $22,000 ARMLS
Cash-flow waterfall
monthlySold comps — $/sqft
last 12 mo · ≤1 miLoading sold comps…