 Multi-family
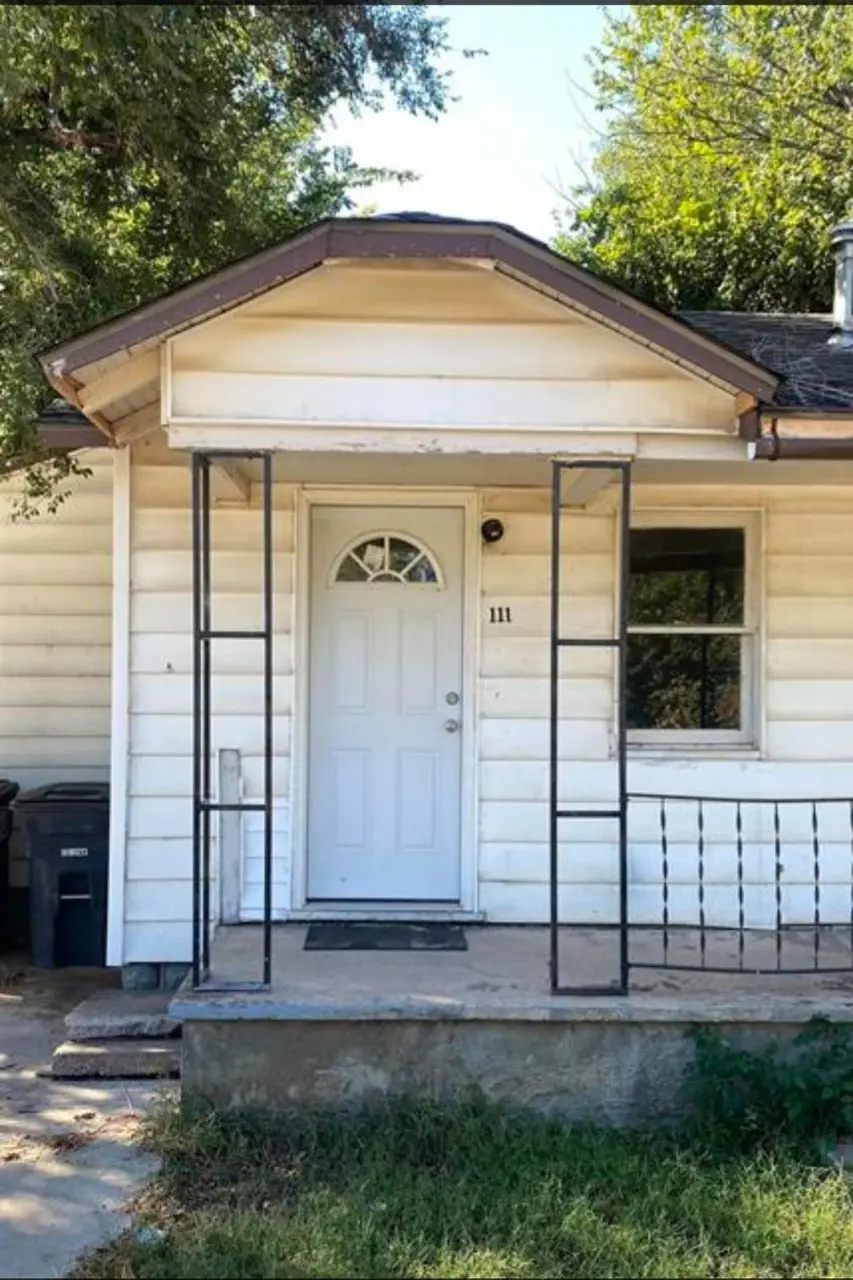
111 and 111 1/2 W Locust Ave · Enid, OK
Flood risk 1/10 · Minimal
- FEMA flood zone
- X (unshaded)
- Chance of flooding over 30 yrs
- 0.0%
- Est. flood insurance / yr
- $507 – $1,088
Fire risk 2/10 · Minimal
- Est. fire insurance / yr
- $2,463 – $4,575
Heat risk 6/10 · Moderate
- Hot days now (above 108°F)
- 7 days/yr
- Hot days in 30 yrs
- 19 days/yr
Wind risk 2/10 · Minimal
- Chance of severe wind over 30 yrs
- 2.0%
Air-quality risk 2/10 · Minimal
- Unhealthy air days now
- 0 days/yr
- Unhealthy air days in 30 yrs
- 1 days/yr
Risk factors via First Street. Map © Google.
Why this score? — see what drove the B- grade
The composite is a weighted blend of 9 inputs, each scored 0–100. Each bar is that input's sub-score; the figure is the points it added to the 100-point composite (weight × sub-score).
- Cash flow +30.0/30.0
- 1% rule +10.0/10.0
- DSCR +10.0/10.0
- ARV discount +7.5/15.0
- Rent growth +3.3/5.0
- Livability +3.2/5.0
- Condition / age +2.5/5.0
- Schools +1.8/10.0
- Appreciation +0.0/10.0
$69,900
🖨 Deal sheet 📄 Offer letter ✓ Due diligence
Multi-family units
County records classify this as Multi-Family (2-4 Unit). Listing-text estimate: 1 unit. estimate disagrees with records
Listing remarks
Calling all investors! Looking for a multi-unit rental or maybe wanting to have someone make your mortgage payment, this Investor special could be right for you. Brand new roof in 2022, major updates in 2023. One bed, one bath on one side and a studio apartment on the other. Owner holds an Active Oklahoma Real Estate license. 111 -Currently rented at $595 /Month unit 2 (111 1/2 W Locust) - Currently rented at $450month.
Key facts
- Brand new roof
- Major updates
- Built 1920
Tags
Property features AI
Exterior
- Parking: On-street parking
- Utilities: Public water; Public sewer
- Home design: Residential income property (multi-family duplex/triplex/fourplex); One story
- Exterior features: Composition roof; Lot zoned for multi-family
Interior
- Kitchen: Range, Oven, Refrigerator
- Heating & cooling: Central heating (electric); Central air conditioning
- Interior features: Range, Oven, Refrigerator
Neighborhood map
What this means for you Summary
Snapshot
- This is a multifamily listed at $70k.
Deal economics
- At list price, monthly cash flow is $503 ($6k/yr) — positive.
- The deal already cash-flows at list — no discount required.
- Meets the 1% rule at list price ($1k rent vs $70k).
- Cap rate 14.9% vs local median 5.0% in Enid — top-decile yield for the area; either an underpriced asset or a hidden risk that comps aren't pricing in. Stress-test before assuming the spread holds.
Location & tenants
- Location reads 63/100 on livability (#212 in OK) — a middle-class / working-renter tenant base. Strengths: cost of living A+, housing A+; Watch: employment C-, schools D-, crime F.
- Enid (town): math 19% / reading 22% proficiency, ranked #168 of 270 in OK (top 62%) — low school quality limits family demand, transient renter base, plan for 1-2y turnover; 64% free/reduced lunch — lower-income household profile, screen leases tightly.
- Market conditions: Rents rising (+3.2%/yr); 79 active listings in the ZIP; 19 units permitted in Garfield County in 2024 (0 in 5+ unit buildings).
Forward outlook
- Local home prices are declining (-3.0%/yr); year-one equity from $483 of loan paydown is wiped out by about $2k of value loss. Plan a longer hold.
- Garfield County population projected at +27% by 2050 — long-run rental-demand tailwind backs the buy-and-hold thesis.
- At projected returns (-3.0% appreciation + 3.2% rent growth), your $20k cash investment doubles in ~4 years — after that, you're playing with house money.
Negotiation context
- Only 8 days on market — expect competitive offers; lowballing is unlikely to land.
- 4 sale attempts with the ask held roughly flat each time — persistent listings suggest the price (not the market) is what's stuck; bring a comps-based counter.
Risks & watch-outs
- Watch-outs: built in 1920 — expect roof / HVAC / electrical / plumbing capex.
- Climate carrying-cost: extreme-heat days projected 7→19/yr by 2055 (HVAC capex compounding) — expect insurance premiums to compound above CPI over the hold.
Questions for the listing agent
- Built in 1920 — when were the roof, HVAC, electrical panel, plumbing, and water heater last replaced?
- Is there a deadline driving the sale (1031 exchange, divorce, estate, relocation)? That informs how much negotiation room exists.
- Schools are D-rated, which usually means shorter tenancies and higher turnover. Who's the typical renter profile here, and what's been the actual vacancy rate?
- Crime grade is F in this area — have there been break-ins, vandalism, or insurance claims at this property in the last 3 years? What carrier currently insures it and at what premium?
- What's the average days-on-market for RENTAL listings here right now (not sales)? A rising rental-DOM trend means longer vacancies and softer asking-rent achievability than the comps imply.
- What's the recent tenant-quality profile in this submarket — average credit score on applications, eviction rate, late-payment / NSF rate, and stable-employment percentage? A property-management company in the area should have these aggregated.
- How much new apartment / multifamily construction is in the pipeline within 1–3 miles? Heavy new supply (>2% of stock underway) typically softens rents 12–24 months out; light construction supports rent growth.
Investment metrics
- 1% rule
- 1.79% ✓
- Cap rate
- 14.93%
- Cash-on-cash
- 30.83%
- DSCR
- 2.37
- GRM
- 4.7
CMA / ARV
No comps found within radius.
Show comp detail 2 sales within ~0.75 mi
| Address | Dist | Beds/Ba | Sqft | Sold | Price | $/sf | Match |
|---|---|---|---|---|---|---|---|
| 614 N Madison St | 0.44mi | 2/— | — | 1mo | $110,000 | — | 66 |
| 502-510 N Washington | 0.37mi | —/— | — | 12mo | $355,000 | — | 60 |
Match score weights: distance 35% · size 25% · config 20% · recency 20%. Top-matched comps best support the ARV.
Projected returns pro-forma
-3.0% appreciation · 3.16% rent growth · sell at horizon
- IRR
- 25.8%
- Equity multiple
- 2.07×
- Total profit
- $20,920
- Equity at exit
- $10,422
- IRR
- 33.6%
- Equity multiple
- 4.08×
- Total profit
- $60,362
- Equity at exit
- $6,044
Cash invested: $19,572 (down + closing). Projections, not guarantees.
Landlord ↔ Tenant lean methodology
- Overall (STATE)
- 83 Strongly Landlord-Friendly
- State Oklahoma
- 83 Strongly Landlord-Friendly · R+20
- County
- — inherits STATE
- City
- — inherits STATE
ZIP-level market 73701
- Home prices YoY
- -30.2%
- Rents YoY
- 3.2%
- Active inventory
- 79
- Price-to-rent
- 8.7×
Monthly cashflow live
- Estimated rent
- $1,248 medium interval (Pro) →
- Mortgage (P&I)
- −$367
- Tax est. 1.5%
- −$87 /mo · $1,048/yr
- Insurance
- −$29
- HOA
- −$0
- Vacancy / Maint / Mgmt
- −$262
- Net cashflow
- $503
Break-even live
2-unit breakdown (identical units grouped — click to expand)
| Units | Beds | Baths | Est. rent |
|---|---|---|---|
| 1× unit | 1 | 1 | $673 |
| 1× unit | 0 | 1 | $575 |
| Total (2 units) | $1,248 | ||
UW: 25.0% down · 7.5% · 30yr · 1.5% tax · 5.0% vac · 8.0% maint · 8.0% mgmt
Financing live
Cash to close
- Down payment
- $17,475
- Closing costs
- $2,097
- Reserves months
- —
- Total cash needed
- —
Loan-product check · same deal, 3 products live
Conventional
25% down · 7.5% · 30yr
- Down + closing
- —
- Monthly P&I
- —
- Monthly cashflow
- —
- DSCR
- —
- Eligible?
- —
Personal DTI + credit; lowest rate.
DSCR
20% down · 8.5% · 30yr
- Down + closing
- —
- Monthly P&I
- —
- Monthly cashflow
- —
- DSCR
- —
- Eligible?
- —
No personal income docs; deal must DSCR.
Hard money
10% down · 12.0% · 12mo
- Down + closing
- —
- Monthly P&I
- —
- Monthly cashflow
- —
- DSCR
- —
- Eligible?
- —
Short-term bridge; refi at stabilization.
Listing history 8 events
-
2026-06-19days on market $69,900 Active 8 DOM
-
2026-06-18days on market $69,900 Active 7 DOM
-
2026-06-17days on market $69,900 Active 6 DOM
-
2026-06-16days on market $69,900 Active 5 DOM
-
2026-06-15days on market $69,900 Active 4 DOM
-
2026-06-14days on market $69,900 Active 2 DOM
-
2026-06-12remarks 423-char remark
-
2026-06-12$69,900 Active 1 DOM
ⓘ Source: listings_history table (triggers on properties + properties_extension) + one-shot
backfill from property_details.listing_events for pre-trigger history.
Climate risk First Street
- Flood 1/10 Low FEMA zone X (unshaded) · 0% chance over 30 yrs
- Wildfire 2/10 Low
- Heat 6/10 Major 7 d/yr ≥108°F today · 19 d/yr by 30 yrs out
- Wind 2/10 Low 2% chance of damaging wind over 30 yrs
- Air quality 2/10 Low 0 unhealthy d/yr today · 1 by 30 yrs out
Nearby sold comps map
Loading sold comps map…
Walkable amenities ~0.75 mi
Loading nearby amenities…
Taxation est. · year 1
- Rental income
- $14,976
- − Mortgage interest
- −$3,915
- − Property taxes
- −$1,048
- − Insurance
- −$350
- − Repairs & maintenance
- −$1,198
- − Management
- −$1,198
- − Depreciation
- −$2,033
- Taxable income
- $5,233
- Est. tax owed @ 24.0%
- −$1,256
- After-tax cash flow
- $4,778/yr
For passive investors: Depreciation is non-cash, so a rental often shows a tax loss while cash-flowing — sheltering income. Rental losses are passive: they offset passive income freely, and up to $25,000/yr can offset ordinary (W-2) income if you actively participate and your MAGI is under $100k (phasing out to $0 by $150k); unused losses carry forward. On sale, claimed depreciation is recaptured at up to 25%, and gains may owe capital-gains tax (a 1031 exchange can defer both). Figures are a year-1 estimate at your 24.0% rate — not tax advice; consult a CPA.
Schools (NCES district)
- District
- Enid
- NCES district ID
- 4010920
- Math proficiency
- 19% ▼ -11.00%
- Reading proficiency
- 22% ▼ -9.00%
- Median HH income
- $42,389
- Composite
- 17.59/100
- National rank
- #9040
- State rank
- #168 of 270 in OK
Livability — Enid
- Score
- 63/100
- State rank
- #212
- US rank
- #15472
Category grades
Schools grade is shown separately in the Schools card above.
Census & demographics
- Census place
- Enid, OK
- County
- Garfield County · 55,032 people
- City population
- 55,032
- Metro
- Enid, OK
- Population (ZIP)
- 24,476
- Household income
- $50,843
- Rent vs Own
- Severe rent burden
- 576.0
Population outlook (Garfield County) Hauer SSP2
- Today (2025)
- 69,026 people
- By 2030
- 72,171 · +4.6%
- By 2040
- 79,366 · +15.0%
- By 2050
- 87,847 · +27.3%
- By 2075
- 112,714 · +63.3%
- By 2100
- 135,682 · +96.6%
Race, ethnicity, and origin ACS 2023
- Neighborhood character
- Diverse neighborhood (Simpson 0.61)
- Race & ethnicity
- White 58% Hispanic / Latino 22% Two or more races 11% Pacific Islander 10% Native American 4% Black 2%
- Hispanic origin (detail)
- Mexican 21%
- Common ancestry
- Iranian 4% Lithuanian 2% Slovak 1%
- Foreign-born
- 10% · Canada
- Languages at home
- 79% English-only · Spanish 14% Other Asian/Pacific 6%
Political lean MEDSL · Garfield
- 2024 margin
- Solid R (+53.8) · D 22.2% · R 76.0% · Other 1.8%
- 2008→2024 swing
- -2.8pp toward R · 2008: -51.0pp · 2024: -53.8pp
- All cycles
- 2024: R+53.8 2020: R+53.7 2016: R+53.5 2012: R+52.5 2008: R+51.0
Not yet ingested
- Civics
- —
Market trends
- HPI YoY
- ▼ -73.42%
- Current HPI
- 169.408
- Rent YoY
- ▲ 3.16%
- Metro
- Enid, OK
- State GDP YoY
- ▲ 1.55%
- F500 in state
- 6
Industry mix (Fortune 500 HQ in OK)
| Industry | F500 HQs | Revenue |
|---|---|---|
| Energy | 3 | $48B |
|
||
Price history
-6.7% since first listed8 events — show timeline
- 2026-06-10 Listed $69,900 NWOAR
- 2026-03-05 Rental Removed $425 BUILDIUM
- 2026-02-28 Listed for Rent $425 BUILDIUM
- 2026-02-03 Relisted — NWOAR
- 2026-01-20 Contingent — NWOAR
- 2025-12-04 Price Changed $69,900 NWOAR
- 2025-10-24 Price Changed $72,400 NWOAR
- 2025-09-16 Listed $74,900 NWOAR
Cash-flow waterfall
monthlySold comps — $/sqft
last 12 mo · ≤1 miLoading sold comps…