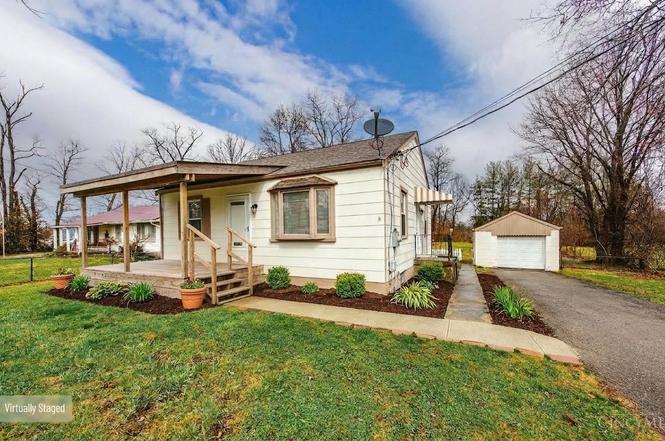
2192 Pinney Ln · New Burlington, OH
Flood risk 1/10 · Minimal
- FEMA flood zone
- X (unshaded)
- Chance of flooding over 30 yrs
- 0.0%
- Est. flood insurance / yr
- $473 – $860
Fire risk 1/10 · Minimal
- Est. fire insurance / yr
- $713 – $1,323
Heat risk 4/10 · Minor
- Hot days now (above 103°F)
- 7 days/yr
- Hot days in 30 yrs
- 19 days/yr
Wind risk 2/10 · Minimal
- Chance of severe wind over 30 yrs
- 1.0%
Air-quality risk 4/10 · Minor
- Unhealthy air days now
- 4 days/yr
- Unhealthy air days in 30 yrs
- 6 days/yr
Risk factors via First Street. Map © Google.
Why this score? — see what drove the C grade
The composite is a weighted blend of 9 inputs, each scored 0–100. Each bar is that input's sub-score; the figure is the points it added to the 100-point composite (weight × sub-score).
- Cash flow +19.1/30.0
- ARV discount +15.0/15.0
- DSCR +6.0/10.0
- 1% rule +4.9/10.0
- Rent growth +4.2/5.0
- Livability +3.2/5.0
- Condition / age +2.5/5.0
- Schools +1.6/10.0
- Appreciation +0.0/10.0
$155,000
🖨 Deal sheet 📄 Offer letter ✓ Due diligence
Listing remarks MLS
Stunning 2 bedroom renovation. Solid wood cabinets, butcher block counters, tile backsplash, gleaming hardwood floors, new roof, new windows, finished basement. Set on over a half acre with garage and storage shed on a no-outlet street. Fenced yard.
Key facts
- Community lake
- Private back yard
- Hardwood floors
Tags
Property features AI
Finance
- Other: Public transportation access nearby; Access via city street
- Financial info: Lease not considered
- HOA & community: No HOA
Exterior
- Parking: Detached garage at rear (1 garage space); Off-street parking and driveway
- Security: No specific security system listed
- Utilities: Public water; Septic tank sewer; Electric service; Cable available
- Home design: Ranch single-family home; One story; Block foundation; Wood siding; Shingle roof; Lot approx. 0.581 acre (approx. 90 x 267); Topography level to sloped; Residential zoning
- Construction: Wood siding construction; Block foundation; Shingle roof
- Exterior features: Covered deck/patio; Located on a cul-de-sac; Wood fencing; Shed on property
Interior
- Kitchen: Eat-in kitchen with pantry; Tile floor and wood cabinets; Walkout and window treatments; Includes dishwasher, microwave, oven/range, refrigerator, garbage disposal
- Bedrooms: 2 bedrooms on main level — each approx. 12 x 10
- Flooring: Wood floor in living room; Wall-to-wall carpet in family room and basement; Tile in kitchen
- Bathrooms: One full bathroom on main level
- Heating & cooling: Heat pump with forced air and electric heating; Central air conditioning; Electric water heater
- Interior features: Multi-panel doors; Finished basement with wall-to-wall carpet and glass block windows; Basement has sump pump with backup; Total of 5 rooms
- Laundry & utility: Laundry room on lower level (approx. 9 x 8); Washer and dryer included; 220-volt service available
Neighborhood map
What this means for you Summary
Snapshot
- This is a 2-bed/1.0-bath single-family listed at $155k.
Deal economics
- At list price, monthly cash flow is $165 ($2k/yr) — positive.
- The deal already cash-flows at list — no discount required.
- To meet the 1% rule (rent ≥ 1% of price), the offer needs to be $154k (0.9% below list).
- Recommended offer: $141k (9.0% below list) — sets the bar for market timing.
- Cap rate 7.6% vs local median 5.5% in New Burlington — top-decile yield for the area; either an underpriced asset or a hidden risk that comps aren't pricing in. Stress-test before assuming the spread holds.
Location & tenants
- Location reads 64/100 on livability (#782 in OH) — a middle-class / working-renter tenant base. Strengths: cost of living A+, housing A+, crime A-; Watch: schools F, amenities F, commute F.
- Mt Healthy City (suburban): math 12% / reading 24% proficiency, ranked #636 of 656 in OH (top 97%) — low school quality limits family demand, transient renter base, plan for 1-2y turnover; 75% free/reduced lunch — lower-income household profile, screen leases tightly.
- Market conditions: Rents rising fast (+6.9%/yr); 85 active listings in the ZIP; 6 comparable units currently listed for rent nearby; rentals leasing fast (median 2d on market — plan ~1-2 weeks tenant-placement turnaround); 801 units permitted in Hamilton County in 2024 (190 in 5+ unit buildings).
Forward outlook
- Local home prices are declining (-3.0%/yr); year-one equity from $1k of loan paydown is wiped out by about $5k of value loss. Plan a longer hold.
- At projected returns (-3.0% appreciation + 6.9% rent growth), your $43k cash investment doubles in ~10 years — after that, you're playing with house money.
Negotiation context
- It's been on market 99 days — a 9% lower offer ($141k) is reasonable based on typical stale-listing flexibility.
- 4 sale attempts since 7y ago; this cycle's ask has dropped $40k (21%) from the opening price — seller is motivated, your offer sets the floor, not the list.
- Current owner paid $130k; 19% above their basis — modest negotiation headroom, anchor on the comps not their cost.
Risks & watch-outs
- Watch-outs: built in 1951 — expect roof / HVAC / electrical / plumbing capex.
Questions for the listing agent
- It's been on market 99 days. Have you received any prior offers? Is the seller open to a 9% concession, seller financing, or rate buy-down credit?
- Built in 1951 — when were the roof, HVAC, electrical panel, plumbing, and water heater last replaced?
- Why hasn't it sold? Are there any deal-killer items the seller is aware of (foundation, flood, title, zoning, code violations)?
- Is there a deadline driving the sale (1031 exchange, divorce, estate, relocation)? That informs how much negotiation room exists.
- Schools are F-rated, which usually means shorter tenancies and higher turnover. Who's the typical renter profile here, and what's been the actual vacancy rate?
- What's the average days-on-market for RENTAL listings here right now (not sales)? A rising rental-DOM trend means longer vacancies and softer asking-rent achievability than the comps imply.
- What's the recent tenant-quality profile in this submarket — average credit score on applications, eviction rate, late-payment / NSF rate, and stable-employment percentage? A property-management company in the area should have these aggregated.
- How much new for-sale + rental construction is in the pipeline within 1–3 miles? Heavy new supply typically softens prices + rents 12–24 months out; constrained supply supports both.
Investment metrics
- 1% rule
- 0.99% ✗
- Cap rate
- 7.57%
- Cash-on-cash
- 4.55%
- DSCR
- 1.20
- GRM
- 8.4
CMA / ARV
- ARV (on-the-fly)
- $216,016
- Comps found
- 12
Show comp detail 12 sales within ~0.75 mi
| Address | Dist | Beds/Ba | Sqft | Sold | Price | $/sf | Match |
|---|---|---|---|---|---|---|---|
| 10731 Valiant Dr | 0.29mi | 3/1.0 (+1) | 1,194 (+2%) | 0mo | $209,000 | $175 | 79 |
| 10474 Gloria Ave | 0.25mi | 3/1.5 (+1) | 1,080 (-8%) | 2mo | $225,000 | $208 | 66 |
| 2333 Merriway Ln | 0.19mi | 3/1.0 (+1) | 1,040 (-11%) | 10mo | $177,500 | $171 | 59 |
| 2614 Impala Dr | 0.54mi | 3/1.0 (+1) | 1,073 (-9%) | 4mo | $170,000 | $158 | 53 |
| 10624 Breedshill Dr | 0.17mi | 3/1.5 (+1) | 1,000 (-15%) | 9mo | $236,900 | $237 | 53 |
| 2456 Fulbourne Dr | 0.42mi | 3/1.5 (+1) | 1,305 (+11%) | 3mo | $240,000 | $184 | 52 |
| 10410 Maria Ave | 0.74mi | 3/1.0 (+1) | 1,212 (+3%) | 5mo | $231,000 | $191 | 51 |
| 10366 Pippin Ln | 0.50mi | 3/1.5 (+1) | 1,028 (-12%) | 0mo | $247,000 | $240 | 49 |
| 2074 Roosevelt Ave | 0.64mi | 3/1.0 (+1) | 1,275 (+9%) | 4mo | $177,500 | $139 | 48 |
| 10372 Pippin Ln | 0.50mi | 3/2.0 (+1) | 1,276 (+9%) | 10mo | $205,000 | $161 | 46 |
| 1990 Bluehill Dr | 0.62mi | 3/1.5 (+1) | 1,025 (-13%) | 0mo | $180,000 | $176 | 43 |
| 1834 Aspenhill Dr | 0.74mi | 3/1.0 (+1) | 1,000 (-15%) | 6mo | $185,000 | $185 | 30 |
Match score weights: distance 35% · size 25% · config 20% · recency 20%. Top-matched comps best support the ARV.
Projected returns pro-forma
-3.0% appreciation · 6.92% rent growth · sell at horizon
- IRR
- -4.9%
- Equity multiple
- 0.81×
- Total profit
- $-8,324
- Equity at exit
- $23,111
- IRR
- 8.8%
- Equity multiple
- 1.79×
- Total profit
- $34,320
- Equity at exit
- $13,402
Cash invested: $43,400 (down + closing). Projections, not guarantees.
Landlord ↔ Tenant lean methodology
- Overall (STATE)
- 73 Landlord-Friendly
- State Ohio
- 73 Landlord-Friendly · R+6
- County
- — inherits STATE
- City
- — inherits STATE
ZIP-level market 45231
- Rents YoY
- 6.9%
- Active inventory
- 85
- Price-to-rent
- 8.4×
Monthly cashflow live
- Estimated rent
- $1,537 high interval (Pro) →
- Mortgage (P&I)
- −$813
- Tax from tax record
- −$172 /mo · $2,064/yr
- Insurance
- −$65
- HOA
- −$0
- Vacancy / Maint / Mgmt
- −$323
- Net cashflow
- $165
Break-even live
UW: 25.0% down · 7.5% · 30yr · 1.5% tax · 5.0% vac · 8.0% maint · 8.0% mgmt
Financing live
Cash to close
- Down payment
- $38,750
- Closing costs
- $4,650
- Reserves months
- —
- Total cash needed
- —
Loan-product check · same deal, 3 products live
Conventional
25% down · 7.5% · 30yr
- Down + closing
- —
- Monthly P&I
- —
- Monthly cashflow
- —
- DSCR
- —
- Eligible?
- —
Personal DTI + credit; lowest rate.
DSCR
20% down · 8.5% · 30yr
- Down + closing
- —
- Monthly P&I
- —
- Monthly cashflow
- —
- DSCR
- —
- Eligible?
- —
No personal income docs; deal must DSCR.
Hard money
10% down · 12.0% · 12mo
- Down + closing
- —
- Monthly P&I
- —
- Monthly cashflow
- —
- DSCR
- —
- Eligible?
- —
Short-term bridge; refi at stabilization.
Rent comps 6 comps
| Address | Beds | Baths | Sqft | Rent | $/sqft | DOM | Units | Dist |
|---|---|---|---|---|---|---|---|---|
| 2753 Town Terrace Dr Cincinnati, OH | 2.0–3.0 | 1.0–1.5 | 968 | $1,140 | $1.18 | 21d | 4 | 0.63mi |
| 2300 Walden Glen Cir Cincinnati, OH | 1.0–3.0 | 1.0–1.5 | 830 | $1,384 | $1.67 | 1d | 9 | 0.74mi |
| 11060 Quailwood Dr Cincinnati, OH | 1.0–2.0 | 1.0–2.0 | 702 | $1,226 | $1.75 | 1d | 3 | 0.90mi |
| 2096 Quail Ct Cincinnati, OH | 1.0–2.0 | 1.0–1.5 | 725 | $1,238 | $1.71 | 1d | 4 | 1.02mi |
| 2504 Houston Rd Cincinnati, OH | 2.0 | 2.0 | 1105 | $2,995 | $2.71 | 1d | 1 | 1.29mi |
| 10101 Arborwood Dr Cincinnati, OH | 1.0–3.0 | 1.0–1.5 | 912 | $1,336 | $1.46 | 1d | 26 | 1.50mi |
Listing history 31 events
-
2026-06-18days on market $155,000 Active 99 DOM
-
2026-06-17days on market $155,000 Active 98 DOM
-
2026-06-16days on market $155,000 Active 97 DOM
-
2026-06-15days on market $155,000 Active 96 DOM
-
2026-06-13days on market $155,000 Active 94 DOM
-
2026-06-13days on market $155,000 Active 93 DOM
-
2026-06-09days on market $155,000 Active 90 DOM
-
2026-06-08days on market $155,000 Active 89 DOM
-
2026-06-07days on market $155,000 Active 88 DOM
-
2026-06-05days on market $155,000 Active 85 DOM
-
2026-06-03days on market $155,000 Active 84 DOM
-
2026-06-02days on market $155,000 Active 83 DOM
-
2026-06-01days on market $155,000 Active 82 DOM
-
2026-05-31days on market $155,000 Active 81 DOM
-
2026-03-27status Active
-
2026-03-27price $155,000
-
2026-03-25historical
-
2026-03-12historical Contingency Pending
-
2026-03-09$195,000 Active
-
2020-09-16soldstatus $130,000
-
2020-07-17soldstatus $130,000
-
2020-06-26soldstatus $130,000 Sold 252-char remark
Show marketing remark (252 chars)
Stunning 2 bedroom renovation. Solid wood cabinets, butcher block counters, tile backsplash, gleaming hardwood floors, new roof, new windows, finished basement. Set on over a half acre with garage and storage shed on a no-outlet street. Fenced yard.
-
2020-04-13historical Contingency Pending 252-char remark
Show marketing remark (252 chars)
Stunning 2 bedroom renovation. Solid wood cabinets, butcher block counters, tile backsplash, gleaming hardwood floors, new roof, new windows, finished basement. Set on over a half acre with garage and storage shed on a no-outlet street. Fenced yard.
-
2020-04-09historical 252-char remark
Show marketing remark (252 chars)
Stunning 2 bedroom renovation. Solid wood cabinets, butcher block counters, tile backsplash, gleaming hardwood floors, new roof, new windows, finished basement. Set on over a half acre with garage and storage shed on a no-outlet street. Fenced yard.
-
2020-03-20historical Contingency Pending 252-char remark
Show marketing remark (252 chars)
Stunning 2 bedroom renovation. Solid wood cabinets, butcher block counters, tile backsplash, gleaming hardwood floors, new roof, new windows, finished basement. Set on over a half acre with garage and storage shed on a no-outlet street. Fenced yard.
-
2020-03-05$129,900 Active 252-char remark
Show marketing remark (252 chars)
Stunning 2 bedroom renovation. Solid wood cabinets, butcher block counters, tile backsplash, gleaming hardwood floors, new roof, new windows, finished basement. Set on over a half acre with garage and storage shed on a no-outlet street. Fenced yard.
-
2019-10-01soldstatus $45,000
-
2019-10-01soldstatus $54,900
-
2019-09-27soldstatus $45,000 Sold 209-char remark
Show marketing remark (209 chars)
Great opportunity for the handy person or Investor to add their own touch and TLC-2 bedroom being sold as is condition on .58 acre level lot-Detached garage and storage shed on no outlet street-Fenced in yard.
-
2019-09-13historical Contingency Pending 209-char remark
Show marketing remark (209 chars)
Great opportunity for the handy person or Investor to add their own touch and TLC-2 bedroom being sold as is condition on .58 acre level lot-Detached garage and storage shed on no outlet street-Fenced in yard.
-
2019-09-10$54,900 Active 209-char remark
Show marketing remark (209 chars)
Great opportunity for the handy person or Investor to add their own touch and TLC-2 bedroom being sold as is condition on .58 acre level lot-Detached garage and storage shed on no outlet street-Fenced in yard.
ⓘ Source: listings_history table (triggers on properties + properties_extension) + one-shot
backfill from property_details.listing_events for pre-trigger history.
Tax reassessment forecast OH · Partial reset (capped growth)
- Current annual tax
- $2,064 · $172/mo
- Projected year-2 tax
- $2,241 · $187/mo
- Expected delta
- +$177/yr (+$15/mo · 8.6%)
ⓘ Screening estimate from a state-policy table — verify with the county assessor before closing.
Climate risk First Street
- Flood 1/10 Low FEMA zone X (unshaded) · 0% chance over 30 yrs
- Wildfire 1/10 Low
- Heat 4/10 Moderate 7 d/yr ≥103°F today · 19 d/yr by 30 yrs out
- Wind 2/10 Low 100% chance of damaging wind over 30 yrs
- Air quality 4/10 Moderate 4 unhealthy d/yr today · 6 by 30 yrs out
Nearby sold comps map
Loading sold comps map…
Walkable amenities ~0.75 mi
Loading nearby amenities…
Taxation est. · year 1
- Rental income
- $18,441
- − Mortgage interest
- −$8,682
- − Property taxes
- −$2,064
- − Insurance
- −$775
- − Repairs & maintenance
- −$1,475
- − Management
- −$1,475
- − Depreciation
- −$4,509
- Taxable loss
- −$540
- Est. tax savings @ 24.0%
- +$130
- After-tax cash flow
- $2,105/yr
For passive investors: Depreciation is non-cash, so a rental often shows a tax loss while cash-flowing — sheltering income. Rental losses are passive: they offset passive income freely, and up to $25,000/yr can offset ordinary (W-2) income if you actively participate and your MAGI is under $100k (phasing out to $0 by $150k); unused losses carry forward. On sale, claimed depreciation is recaptured at up to 25%, and gains may owe capital-gains tax (a 1031 exchange can defer both). Figures are a year-1 estimate at your 24.0% rate — not tax advice; consult a CPA.
Schools (NCES district)
- District
- Mt Healthy City
- NCES district ID
- 3904441
- Math proficiency
- 12% ▼ -21.00%
- Reading proficiency
- 24% ▼ -9.00%
- Median HH income
- $42,699
- Composite
- 15.51/100
- National rank
- #9303
- State rank
- #636 of 656 in OH
Livability — New Burlington
- Score
- 64/100
- State rank
- #782
- US rank
- #14211
Category grades
Schools grade is shown separately in the Schools card above.
Census & demographics
- Census place
- New Burlington, OH
- County
- Hamilton County · 701,295 people
- Metro
- Cincinnati, OH-KY-IN
- Population (ZIP)
- 40,463
- Household income
- $71,353
- Rent vs Own
- Severe rent burden
- 846.0
Population outlook (Hamilton County) Hauer SSP2
- Today (2025)
- 826,054 people
- By 2030
- 830,947 · +0.6%
- By 2040
- 832,319 · +0.8%
- By 2050
- 822,428 · -0.4%
- By 2075
- 788,688 · -4.5%
- By 2100
- 710,674 · -14.0%
Race, ethnicity, and origin ACS 2023
- Neighborhood character
- Diverse neighborhood (Simpson 0.61)
- Race & ethnicity
- White 47% Black 40% Two or more races 8% Hispanic / Latino 3% Asian 2%
- Common ancestry
- Lithuanian 1% Slovak 1% Iranian 1%
- Foreign-born
- 5% · Canada, India
- Languages at home
- 94% English-only · Spanish 2% Other Indo-European 1% French/Haitian/Cajun 1%
Political lean MEDSL · Hamilton
- 2024 margin
- D (+14.9) · D 57.0% · R 42.1%
- 2008→2024 swing
- +7.9pp toward D · 2008: 7.0pp · 2024: 14.9pp
- All cycles
- 2024: D+14.9 2020: D+15.9 2016: D+9.5 2012: D+4.9 2008: D+7.0
Not yet ingested
- Civics
- —
Market trends
- HPI YoY
- ▼ -181.25%
- Current HPI
- 228.2912
- Rent YoY
- ▲ 6.92%
- Metro
- Cincinnati, OH-KY-IN
- State GDP YoY
- ▲ 1.98%
- F500 in state
- 48
Industry mix (Fortune 500 HQ in OH)
| Industry | F500 HQs | Revenue |
|---|---|---|
| Insurance | 3 | $145B |
|
||
| Industrial Machinery | 3 | $49B |
|
||
| Financial Services | 3 | $24B |
|
||
| Consumer Goods | 2 | $93B |
|
||
| Aerospace / Defense | 2 | $47B |
|
||
| Utilities | 2 | $33B |
|
||
Price history
+182.3% since first listed17 events — show timeline
- 2026-03-27 Relisted — Cincy MLS
- 2026-03-27 Price Changed $155,000 Cincy MLS
- 2026-03-25 Listing Removed — Cincy MLS
- 2026-03-12 Contingent — Cincy MLS
- 2026-03-09 Listed $195,000 Cincy MLS
- 2020-09-16 Sold (Public Records) $130,000 Public Records
- 2020-07-17 Sold (Public Records) $130,000 Public Records
- 2020-06-26 Sold (MLS) $130,000 Cincy MLS
- 2020-04-13 Contingent — Cincy MLS
- 2020-04-09 Listing Removed — Cincy MLS
- 2020-03-20 Contingent — Cincy MLS
- 2020-03-05 Listed $129,900 Cincy MLS
- 2019-10-01 Sold (Public Records) $54,900 Public Records
- 2019-10-01 Sold (Public Records) $45,000 Public Records
- 2019-09-27 Sold (MLS) $45,000 Cincy MLS
- 2019-09-13 Contingent — Cincy MLS
- 2019-09-10 Listed $54,900 Cincy MLS
Property tax history
+1.9%/yrLatest (2025): $2,064 · -21.7% YoY. Source: county tax records.
Cash-flow waterfall
monthlySold comps — $/sqft
last 12 mo · ≤1 miLoading sold comps…