3240 Effie St · Slidell, LA
Flood risk No data
- FEMA flood zone
- —
- Chance of flooding over 30 yrs
- —
- Est. flood insurance / yr
- —
Fire risk No data
- Est. fire insurance / yr
- —
Heat risk No data
- Hot days now (above threshold)
- —
- Hot days in 30 yrs
- —
Wind risk No data
- Chance of severe wind over 30 yrs
- —
Air-quality risk No data
- Unhealthy air days now
- —
- Unhealthy air days in 30 yrs
- —
Risk factors via First Street. Map © Google.
Why this score? — see what drove the C- grade
The composite is a weighted blend of 9 inputs, each scored 0–100. Each bar is that input's sub-score; the figure is the points it added to the 100-point composite (weight × sub-score).
- Cash flow +20.8/30.0
- DSCR +6.6/10.0
- ARV discount +6.1/15.0
- 1% rule +5.0/10.0
- Schools +4.3/10.0
- Livability +3.5/5.0
- Rent growth +2.9/5.0
- Condition / age +2.5/5.0
- Appreciation +0.0/10.0
$125,000
🖨 Deal sheet 📄 Offer letter ✓ Due diligence
Listing remarks MLS
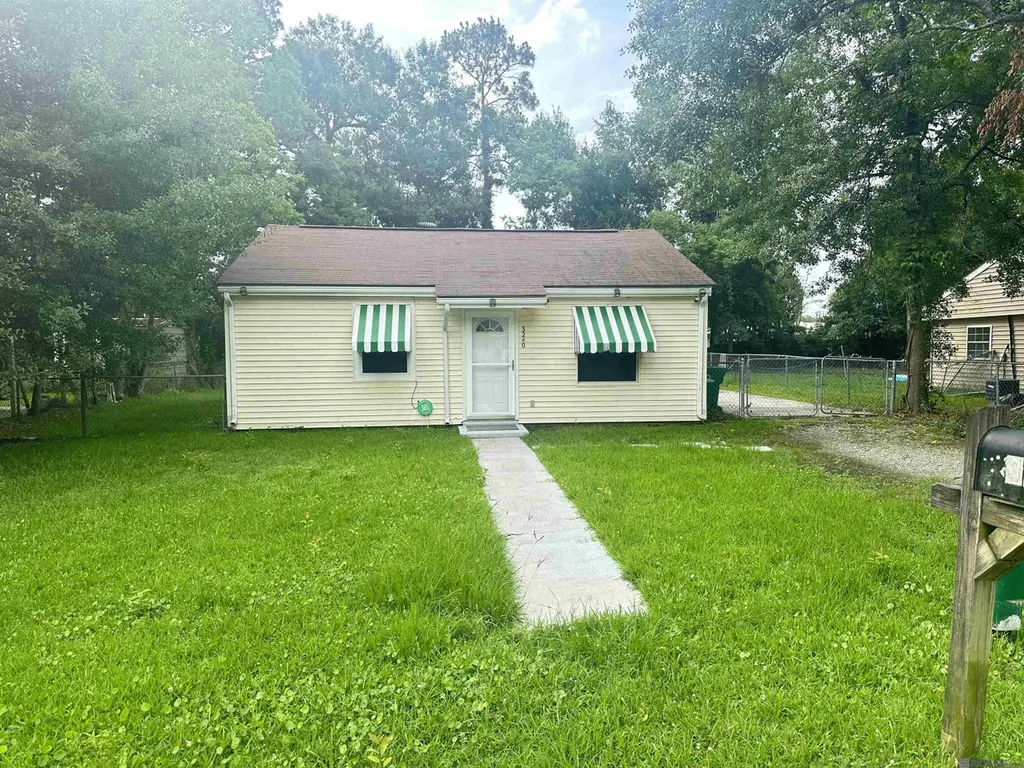
Charming and cozy cottage conveniently located near all the city's amenities. This delightful home features 2 bedrooms and 1 bath, highlighted by a neutral color palette, ceramic tile flooring, and a spacious back porch perfect for relaxing. The fenced backyard offers plenty of space along with ample parking.
Key facts
- Spacious back porch
- Ample parking
- Fenced backyard
Tags
Property features AI
Exterior
- Parking: 3 parking spaces
- Utilities: Public water; Public sewer
- Home design: Detached single-family residence; Residential property
- Construction: Wood siding exterior; Slab foundation; Built with traditional wood-frame construction
- Exterior features: Chain link fencing; Off-street parking; Open parking
Interior
- Kitchen: Range; Oven; Microwave
- Flooring: Tile; Ceramic tile
- Bathrooms: 1 full bathroom
- Heating & cooling: Central heating; Central air conditioning
- Interior features: Range, Oven, Microwave; Electric water heater; Tile and ceramic tile flooring
- Laundry & utility: Electric water heater
Neighborhood map
What this means for you Summary
Snapshot
- This is a 2-bed/1.0-bath single-family listed at $125k.
Deal economics
- At list price, monthly cash flow is $172 ($2k/yr) — positive.
- The deal already cash-flows at list — no discount required.
- Meets the 1% rule at list price ($1k rent vs $125k).
- Recommended offer: $123k (1.5% below list) — sets the bar for market timing.
- Cap rate 7.9% vs local median 5.9% in Slidell — top-decile yield for the area; either an underpriced asset or a hidden risk that comps aren't pricing in. Stress-test before assuming the spread holds.
Location & tenants
- Location reads 70/100 on livability (#57 in LA) — a middle-class / working-renter tenant base. Strengths: cost of living A+, housing A+, health & safety A+; Watch: amenities F, commute F.
- St. Tammany Parish (suburban): math 43% / reading 55% proficiency, ranked #11 of 98 in LA (top 11%) — families likely to look elsewhere, expect single-tenant / working-renter base with shorter leases.
- Market conditions: Rents rising (+1.5%/yr); 489 active listings in the ZIP; 6 comparable units currently listed for rent nearby; rentals at typical pace (median 17d on market — plan ~3-4 weeks tenant-placement turnaround); 1,064 units permitted in St. Tammany Parish in 2024 (0 in 5+ unit buildings).
Forward outlook
- Local home prices are declining (-3.0%/yr); year-one equity from $864 of loan paydown is wiped out by about $4k of value loss. Plan a longer hold.
- St. Tammany County population projected at +27% by 2050 — long-run rental-demand tailwind backs the buy-and-hold thesis.
Negotiation context
- It's been on market 19 days — a 2% lower offer ($123k) is reasonable based on typical stale-listing flexibility.
- 6 sale attempts since 22y ago with the ask held roughly flat each time — persistent listings suggest the price (not the market) is what's stuck; bring a comps-based counter.
Questions for the listing agent
- Built in 1965 — when were the roof, HVAC, electrical panel, plumbing, and water heater last replaced?
- Is there a deadline driving the sale (1031 exchange, divorce, estate, relocation)? That informs how much negotiation room exists.
- Schools are B-rated — typically a magnet for longer-tenancy family renters. What's the average tenant stay here, and is there a school-zone premium baked into asking?
- What's the average days-on-market for RENTAL listings here right now (not sales)? A rising rental-DOM trend means longer vacancies and softer asking-rent achievability than the comps imply.
- What's the recent tenant-quality profile in this submarket — average credit score on applications, eviction rate, late-payment / NSF rate, and stable-employment percentage? A property-management company in the area should have these aggregated.
- How much new for-sale + rental construction is in the pipeline within 1–3 miles? Heavy new supply typically softens prices + rents 12–24 months out; constrained supply supports both.
Investment metrics
- 1% rule
- 1.00% ✓
- Cap rate
- 7.94%
- Cash-on-cash
- 5.89%
- DSCR
- 1.26
- GRM
- 8.3
CMA / ARV
- ARV (on-the-fly)
- $121,296
- Comps found
- 1
Show comp detail 1 sale within ~0.75 mi
| Address | Dist | Beds/Ba | Sqft | Sold | Price | $/sf | Match |
|---|---|---|---|---|---|---|---|
| 3129 Effie St | 0.12mi | 2/1.0 | 745 (+3%) | 4mo | $125,000 | $168 | 86 |
Match score weights: distance 35% · size 25% · config 20% · recency 20%. Top-matched comps best support the ARV.
Projected returns pro-forma
-3.0% appreciation · 1.47% rent growth · sell at horizon
- IRR
- -8.9%
- Equity multiple
- 0.68×
- Total profit
- $-11,232
- Equity at exit
- $18,638
- IRR
- -1.5%
- Equity multiple
- 0.91×
- Total profit
- $-3,307
- Equity at exit
- $10,808
Cash invested: $35,000 (down + closing). Projections, not guarantees.
Landlord ↔ Tenant lean methodology
- Overall (STATE)
- 90 Strongly Landlord-Friendly
- State Louisiana
- 90 Strongly Landlord-Friendly · R+12
- County
- — inherits STATE
- City
- — inherits STATE
ZIP-level market 70458
- Rents YoY
- 1.5%
- Active inventory
- 489
- Price-to-rent
- 8.3×
Monthly cashflow live
- Estimated rent
- $1,255 high interval (Pro) →
- Mortgage (P&I)
- −$656
- Tax from tax record
- −$112 /mo · $1,347/yr
- Insurance
- −$52
- HOA
- −$0
- Vacancy / Maint / Mgmt
- −$264
- Net cashflow
- $172
Break-even live
UW: 25.0% down · 7.5% · 30yr · 1.5% tax · 5.0% vac · 8.0% maint · 8.0% mgmt
Financing live
Cash to close
- Down payment
- $31,250
- Closing costs
- $3,750
- Reserves months
- —
- Total cash needed
- —
Loan-product check · same deal, 3 products live
Conventional
25% down · 7.5% · 30yr
- Down + closing
- —
- Monthly P&I
- —
- Monthly cashflow
- —
- DSCR
- —
- Eligible?
- —
Personal DTI + credit; lowest rate.
DSCR
20% down · 8.5% · 30yr
- Down + closing
- —
- Monthly P&I
- —
- Monthly cashflow
- —
- DSCR
- —
- Eligible?
- —
No personal income docs; deal must DSCR.
Hard money
10% down · 12.0% · 12mo
- Down + closing
- —
- Monthly P&I
- —
- Monthly cashflow
- —
- DSCR
- —
- Eligible?
- —
Short-term bridge; refi at stabilization.
Rent comps 6 comps
| Address | Beds | Baths | Sqft | Rent | $/sqft | DOM | Units | Dist |
|---|---|---|---|---|---|---|---|---|
| 3109 Grandview Pl Slidell, LA | 1.0 | 1.5 | 522 | $950 | $1.82 | 17d | 1 | 0.89mi |
| 301 Spartan Dr Slidell, LA | 1.0–2.0 | 1.0–2.0 | 880 | $1,502 | $1.71 | 3d | 8 | 1.05mi |
| 511 Spartan Dr #6102 Slidell, LA | 1.0 | 1.0 | 662 | $1,000 | $1.51 | 43d | 1 | 1.18mi |
| 36326 Salmen St Apt A Slidell, LA | 1.0 | 1.0 | 650 | $1,100 | $1.69 | 23d | 1 | 1.29mi |
| 36326 Salmen St Unit B Slidell, LA | 1.0 | 1.0 | 650 | $1,100 | $1.69 | 11d | 1 | 1.29mi |
| 1303 Town Center Pkwy Slidell, LA | 3.0 | 1.0–2.0 | 990 | $1,588 | $1.60 | 2d | 31 | 1.46mi |
Listing history 12 events
-
2026-06-18days on market $125,000 Active 19 DOM
-
2026-06-17days on market $125,000 Active 18 DOM
-
2026-06-16days on market $125,000 Active 17 DOM
-
2026-06-15days on market $125,000 Active 16 DOM
-
2026-06-13days on market $125,000 Active 14 DOM
-
2026-06-10days on market $125,000 Active 11 DOM
-
2026-06-09days on market $125,000 Active 10 DOM
-
2026-06-08days on market $125,000 Active 9 DOM
-
2026-06-07days on market $125,000 Active 8 DOM
-
2026-06-03days on market $125,000 Active 4 DOM
-
2026-06-02days on market $125,000 Active 3 DOM
-
2026-06-01days on market $125,000 Active 2 DOM
ⓘ Source: listings_history table (triggers on properties + properties_extension) + one-shot
backfill from property_details.listing_events for pre-trigger history.
Tax reassessment forecast LA · Resets to sale price
- Current annual tax
- $1,347 · $112/mo
- Projected year-2 tax
- $1,347 · $112/mo
- Expected delta
- $0/yr ($0/mo · 0.0%)
ⓘ Screening estimate from a state-policy table — verify with the county assessor before closing.
Nearby sold comps map
Loading sold comps map…
Walkable amenities ~0.75 mi
Loading nearby amenities…
Taxation est. · year 1
- Rental income
- $15,061
- − Mortgage interest
- −$7,002
- − Property taxes
- −$1,347
- − Insurance
- −$625
- − Repairs & maintenance
- −$1,205
- − Management
- −$1,205
- − Depreciation
- −$3,636
- Taxable income
- $41
- Est. tax owed @ 24.0%
- −$10
- After-tax cash flow
- $2,050/yr
For passive investors: Depreciation is non-cash, so a rental often shows a tax loss while cash-flowing — sheltering income. Rental losses are passive: they offset passive income freely, and up to $25,000/yr can offset ordinary (W-2) income if you actively participate and your MAGI is under $100k (phasing out to $0 by $150k); unused losses carry forward. On sale, claimed depreciation is recaptured at up to 25%, and gains may owe capital-gains tax (a 1031 exchange can defer both). Figures are a year-1 estimate at your 24.0% rate — not tax advice; consult a CPA.
Schools (NCES district)
- District
- St. Tammany Parish
- NCES district ID
- 2201650
- Math proficiency
- 43% ▼ -32.00%
- Reading proficiency
- 55% ▼ -26.00%
- Median HH income
- $61,752
- Composite
- 43.04/100
- National rank
- #3098
- State rank
- #11 of 98 in LA
Livability — Slidell
- Score
- 70/100
- State rank
- #57
- US rank
- #7673
Category grades
Schools grade is shown separately in the Schools card above.
Census & demographics
- Census place
- Slidell, LA
- County
- Saint Tammany Parish · 228,296 people
- City population
- 95,511
- Metro
- New Orleans-Metairie, LA
- Population (ZIP)
- 39,034
- Household income
- $72,843
- Rent vs Own
- Severe rent burden
- 1331.0
Population outlook (St. Tammany County) Hauer SSP2
- Today (2025)
- 286,725 people
- By 2030
- 304,175 · +6.1%
- By 2040
- 336,203 · +17.3%
- By 2050
- 364,590 · +27.2%
- By 2075
- 433,362 · +51.1%
- By 2100
- 470,333 · +64.0%
Race, ethnicity, and origin ACS 2023
- Neighborhood character
- Predominantly White (66%)
- Race & ethnicity
- White 66% Black 17% Two or more races 10% Hispanic / Latino 9% Native American 2% Asian 1%
- Hispanic origin (detail)
- Mexican 3% Puerto Rican 1%
- Common ancestry
- Lithuanian 15% Slovak 2% Romanian 1%
- Foreign-born
- 3% · Canada, Vietnam
- Languages at home
- 93% English-only · Spanish 5% Vietnamese 1%
Political lean MEDSL · St. Tammany
- 2024 margin
- Solid R (+43.8) · D 27.3% · R 71.1% · Other 1.6%
- 2008→2024 swing
- +9.6pp toward D · 2008: -53.4pp · 2024: -43.8pp
- All cycles
- 2024: R+43.8 2020: R+44.2 2016: R+50.8 2012: R+52.2 2008: R+53.4
Not yet ingested
- Civics
- —
Market trends
- HPI YoY
- ▼ -173.60%
- Current HPI
- 147.4749
- Rent YoY
- ▲ 1.47%
- Metro
- New Orleans-Metairie, LA
- State GDP YoY
- ▲ 3.29%
- F500 in state
- 10
Industry mix (Fortune 500 HQ in LA)
| Industry | F500 HQs | Revenue |
|---|---|---|
| Telecommunications | 2 | $23B |
|
||
| Utilities | 1 | $12B |
|
||
| Wholesale / Distribution | 1 | $5B |
|
||
| Advertising | 1 | $2B |
|
||
Price history
+111.9% since first listed12 events — show timeline
- 2026-05-29 Listed $125,000 AcadianaMLS
- 2026-05-29 Listed $125,000 GBRMLS
- 2022-12-05 Sold (Public Records) $113,000 Public Records
- 2022-12-01 Sold (MLS) — GSREIN
- 2022-11-22 Rental Removed — GSREIN
- 2022-10-20 Pending — GSREIN
- 2022-10-04 Listed $114,750 GSREIN
- 2022-10-04 Listed $114,750 AcadianaMLS
- 2004-07-27 Sold (Public Records) — Public Records
- 2004-07-23 Sold (MLS) — GSREIN
- 2004-06-26 Listed $59,000 GSREIN
- 2004-06-26 Listed $59,000 AcadianaMLS
Property tax history
+9.8%/yrLatest (2025): $1,347 · -6.1% YoY. Source: county tax records.
Cash-flow waterfall
monthlySold comps — $/sqft
last 12 mo · ≤1 miLoading sold comps…