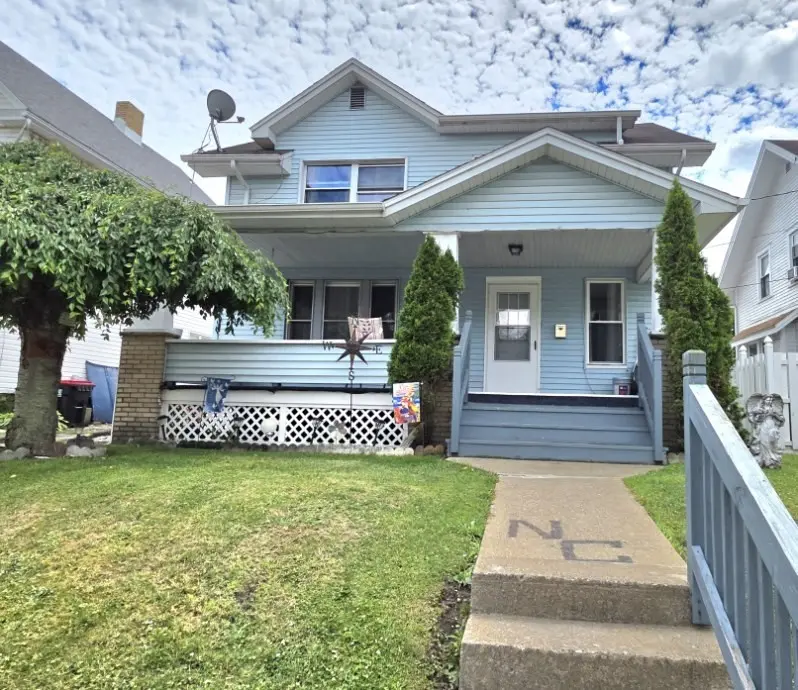
204 Boyles Ave · New Castle, PA
Flood risk 1/10 · Minimal
- FEMA flood zone
- X (unshaded)
- Chance of flooding over 30 yrs
- 0.0%
- Est. flood insurance / yr
- $473 – $860
Fire risk 1/10 · Minimal
- Est. fire insurance / yr
- $511 – $949
Heat risk 3/10 · Minor
- Hot days now (above 96°F)
- 7 days/yr
- Hot days in 30 yrs
- 18 days/yr
Wind risk 1/10 · Minimal
- Chance of severe wind over 30 yrs
- —
Air-quality risk 2/10 · Minimal
- Unhealthy air days now
- 1 days/yr
- Unhealthy air days in 30 yrs
- 3 days/yr
Risk factors via First Street. Map © Google.
Why this score? — see what drove the C grade
The composite is a weighted blend of 9 inputs, each scored 0–100. Each bar is that input's sub-score; the figure is the points it added to the 100-point composite (weight × sub-score).
- Cash flow +25.0/30.0
- DSCR +8.1/10.0
- ARV discount +7.3/15.0
- 1% rule +6.2/10.0
- Rent growth +5.0/5.0
- Livability +4.1/5.0
- Condition / age +2.5/5.0
- Schools +1.1/10.0
- Appreciation +0.0/10.0
$125,000
🖨 Deal sheet 📄 Offer letter ✓ Due diligence
Listing remarks
Step into timeless charm in this North Hill gem, where character and craftsmanship shine throughout. Beautiful original woodwork, classic architectural details, and build-in bookcases surrounding a cozy wood-burning fireplace atmosphere. This home features three bedrooms and one full bath, with a walk-in shower, so no worries about falls on entering the shower. There are wardrobes included in two of the bedrooms for added convenience. There is also a lift-chair on the staircase for your convenience and safety. A quaint backyard offs a peaceful retreat and includes a fire pit, making it the perfect spot to relax and enjoy the outdoors year-round. A one-car garage provides excellent storage s
Key facts
- Wardrobes included
- Built-in bookcases
- Walk-in shower
Tags
Property features AI
Exterior
- Parking: On-street parking
- Utilities: Public water service; Public sewer service; Gas for heating and some appliances
- Home design: Two-story residence; Resale property; Asphalt roof
- Construction: Asphalt roof
- Exterior features: Public water; Public sewer
Interior
- Kitchen: Refrigerator; Stove; Microwave; Some gas appliances
- Bedrooms: Three bedrooms (two upper bedrooms ~12x11, one upper bedroom ~11x12)
- Flooring: Hardwood; Vinyl; Carpet
- Bathrooms: One full bathroom
- Heating & cooling: Forced air heating (gas)
- Interior features: Window treatments and screens; Wood-burning fireplace (1)
Neighborhood map
What this means for you Summary
Snapshot
- This is a 3-bed/1.0-bath single-family listed at $125k.
Deal economics
- At list price, monthly cash flow is $272 ($3k/yr) — positive.
- The deal already cash-flows at list — no discount required.
- Meets the 1% rule at list price ($1k rent vs $125k).
Location & tenants
- Location reads 82/100 on livability (#137 in PA, #1,120 nationally) — a professional / high-income tenant draw. Strengths: crime A+, commute A+, cost of living A+; Watch: amenities F, employment F.
- New Castle Area SD (town): math 9% / reading 19% proficiency, ranked #519 of 539 in PA (top 96%) — low school quality limits family demand, transient renter base, plan for 1-2y turnover; 66% free/reduced lunch — lower-income household profile, screen leases tightly.
- Market conditions: Rents rising fast (+20.1%/yr); 118 active listings in the ZIP; 2 comparable units currently listed for rent nearby; 51 units permitted in Lawrence County in 2024 (0 in 5+ unit buildings).
- This rent runs 33% of the median local income ($51k/yr) — at the standard rent-burdened threshold; future hikes will face affordability resistance.
Forward outlook
- Local home prices are declining (-3.0%/yr); year-one equity from $864 of loan paydown is wiped out by about $4k of value loss. Plan a longer hold.
- Lawrence County population projected at -25% by 2050 — secular population decline; favor cash flow + early exit over multi-decade hold.
- At projected returns (-3.0% appreciation + 8.0% rent growth), your $35k cash investment doubles in ~8 years — after that, you're playing with house money.
Negotiation context
- Only 3 days on market — expect competitive offers; lowballing is unlikely to land.
- Current owner paid $19k; list at $125k implies a 558% gain — meaningful room to come down on a strong offer.
Risks & watch-outs
- Watch-outs: built in 1930 — expect roof / HVAC / electrical / plumbing capex.
Questions for the listing agent
- Built in 1930 — when were the roof, HVAC, electrical panel, plumbing, and water heater last replaced?
- Is there a deadline driving the sale (1031 exchange, divorce, estate, relocation)? That informs how much negotiation room exists.
- What's the average days-on-market for RENTAL listings here right now (not sales)? A rising rental-DOM trend means longer vacancies and softer asking-rent achievability than the comps imply.
- What's the recent tenant-quality profile in this submarket — average credit score on applications, eviction rate, late-payment / NSF rate, and stable-employment percentage? A property-management company in the area should have these aggregated.
- How much new for-sale + rental construction is in the pipeline within 1–3 miles? Heavy new supply typically softens prices + rents 12–24 months out; constrained supply supports both.
Investment metrics
- 1% rule
- 1.12% ✓
- Cap rate
- 8.90%
- Cash-on-cash
- 9.31%
- DSCR
- 1.41
- GRM
- 7.4
CMA / ARV
- ARV (on-the-fly)
- $124,384
- Comps found
- 12
Show comp detail 12 sales within ~0.75 mi
| Address | Dist | Beds/Ba | Sqft | Sold | Price | $/sf | Match |
|---|---|---|---|---|---|---|---|
| 142 E Garfield Ave | 0.44mi | 3/1.0 | 1,359 (+0%) | 3mo | $150,000 | $110 | 76 |
| 18 W Moody Ave | 0.40mi | 3/1.0 | 1,314 (-3%) | 3mo | $20,000 | $15 | 74 |
| 510 Laurel Blvd | 0.47mi | 3/1.0 | 1,401 (+4%) | 3mo | $101,510 | $72 | 70 |
| 212 E Garfield Ave | 0.44mi | 3/1.5 | 1,450 (+7%) | 0mo | $103,200 | $71 | 65 |
| 228 E Sheridan Ave | 0.52mi | 3/1.5 | 1,288 (-5%) | 2mo | $140,000 | $109 | 65 |
| 411 Crawford Ter | 0.33mi | 2/1.0 (-1) | 1,461 (+8%) | 6mo | $91,238 | $62 | 61 |
| 902 Delaware Ave | 0.48mi | 3/1.0 | 1,188 (-12%) | 2mo | $109,000 | $92 | 56 |
| 116 E Euclid Ave | 0.59mi | 3/1.0 | 1,481 (+10%) | 1mo | $167,500 | $113 | 56 |
| 518 E Winter Ave | 0.58mi | 3/1.5 | 1,449 (+7%) | 6mo | $111,900 | $77 | 54 |
| 304 E Winter Ave | 0.32mi | 4/1.0 (+1) | 1,552 (+15%) | 4mo | $125,000 | $81 | 52 |
| 229 E Euclid | 0.62mi | 4/1.5 (+1) | 1,460 (+8%) | 4mo | $189,900 | $130 | 48 |
| 527 E Moody Ave | 0.58mi | 3/2.0 | 1,188 (-12%) | 6mo | $109,500 | $92 | 44 |
Match score weights: distance 35% · size 25% · config 20% · recency 20%. Top-matched comps best support the ARV.
Projected returns pro-forma
-3.0% appreciation · 8.0% rent growth · sell at horizon
- IRR
- 3.2%
- Equity multiple
- 1.13×
- Total profit
- $4,482
- Equity at exit
- $18,638
- IRR
- 16.9%
- Equity multiple
- 2.72×
- Total profit
- $60,026
- Equity at exit
- $10,808
Cash invested: $35,000 (down + closing). Projections, not guarantees.
Landlord ↔ Tenant lean methodology
- Overall (STATE)
- 62 Landlord-Friendly
- State Pennsylvania
- 62 Landlord-Friendly · EVEN
- County
- — inherits STATE
- City
- — inherits STATE
ZIP-level market 16101
- Home prices YoY
- -26.3%
- Rents YoY
- 20.1%
- Active inventory
- 118
- Price-to-rent
- 7.4×
Monthly cashflow live
- Estimated rent
- $1,406 medium interval (Pro) →
- Mortgage (P&I)
- −$656
- Tax from tax record
- −$132 /mo · $1,579/yr
- Insurance
- −$52
- HOA
- −$0
- Vacancy / Maint / Mgmt
- −$295
- Net cashflow
- $272
Break-even live
UW: 25.0% down · 7.5% · 30yr · 1.5% tax · 5.0% vac · 8.0% maint · 8.0% mgmt
Financing live
Cash to close
- Down payment
- $31,250
- Closing costs
- $3,750
- Reserves months
- —
- Total cash needed
- —
Loan-product check · same deal, 3 products live
Conventional
25% down · 7.5% · 30yr
- Down + closing
- —
- Monthly P&I
- —
- Monthly cashflow
- —
- DSCR
- —
- Eligible?
- —
Personal DTI + credit; lowest rate.
DSCR
20% down · 8.5% · 30yr
- Down + closing
- —
- Monthly P&I
- —
- Monthly cashflow
- —
- DSCR
- —
- Eligible?
- —
No personal income docs; deal must DSCR.
Hard money
10% down · 12.0% · 12mo
- Down + closing
- —
- Monthly P&I
- —
- Monthly cashflow
- —
- DSCR
- —
- Eligible?
- —
Short-term bridge; refi at stabilization.
Rent comps 2 comps
| Address | Beds | Baths | Sqft | Rent | $/sqft | DOM | Units | Dist |
|---|---|---|---|---|---|---|---|---|
| 932 Morton St New Castle, PA | 3.0 | 1.0 | 1440 | $1,375 | $0.95 | 43d | 1 | 1.40mi |
| 1112 Williams St New Castle, PA | 2.0 | 1.0 | 1026 | $1,400 | $1.36 | 43d | 1 | 1.50mi |
Listing history 4 events
-
2026-06-19days on market $125,000 Active 3 DOM
-
2026-06-18days on market $125,000 Active 2 DOM
-
2026-06-17remarks 699-char remark
-
2026-06-17$125,000 Active 1 DOM
ⓘ Source: listings_history table (triggers on properties + properties_extension) + one-shot
backfill from property_details.listing_events for pre-trigger history.
Tax reassessment forecast PA · Partial reset (capped growth)
- Current annual tax
- $1,579 · $132/mo
- Projected year-2 tax
- $1,777 · $148/mo
- Expected delta
- +$198/yr (+$16/mo · 12.5%)
ⓘ Screening estimate from a state-policy table — verify with the county assessor before closing.
Climate risk First Street
- Flood 1/10 Low FEMA zone X (unshaded) · 0% chance over 30 yrs
- Wildfire 1/10 Low
- Heat 3/10 Moderate 7 d/yr ≥96°F today · 18 d/yr by 30 yrs out
- Wind 1/10 Low
- Air quality 2/10 Low 1 unhealthy d/yr today · 3 by 30 yrs out
Nearby sold comps map
Loading sold comps map…
Walkable amenities ~0.75 mi
Loading nearby amenities…
Taxation est. · year 1
- Rental income
- $16,873
- − Mortgage interest
- −$7,002
- − Property taxes
- −$1,579
- − Insurance
- −$625
- − Repairs & maintenance
- −$1,350
- − Management
- −$1,350
- − Depreciation
- −$3,636
- Taxable income
- $1,331
- Est. tax owed @ 24.0%
- −$319
- After-tax cash flow
- $2,940/yr
For passive investors: Depreciation is non-cash, so a rental often shows a tax loss while cash-flowing — sheltering income. Rental losses are passive: they offset passive income freely, and up to $25,000/yr can offset ordinary (W-2) income if you actively participate and your MAGI is under $100k (phasing out to $0 by $150k); unused losses carry forward. On sale, claimed depreciation is recaptured at up to 25%, and gains may owe capital-gains tax (a 1031 exchange can defer both). Figures are a year-1 estimate at your 24.0% rate — not tax advice; consult a CPA.
Schools (NCES district)
- District
- New Castle Area SD
- NCES district ID
- 4216620
- Math proficiency
- 9% ▼ -13.00%
- Reading proficiency
- 19% ▼ -23.00%
- Median HH income
- $30,967
- Composite
- 11.08/100
- National rank
- #9736
- State rank
- #519 of 539 in PA
Livability — New Castle
- Score
- 82/100
- State rank
- #137
- US rank
- #1120
Category grades
Schools grade is shown separately in the Schools card above.
Census & demographics
- Census place
- New Castle, PA
- County
- Lawrence County · 30,767 people
- City population
- 30,767
- Metro
- New Castle, PA
- Population (ZIP)
- 30,767
- Household income
- $51,128
- Rent vs Own
- Severe rent burden
- 1047.0
Population outlook (Lawrence County) Hauer SSP2
- Today (2025)
- 81,781 people
- By 2030
- 77,978 · -4.7%
- By 2040
- 69,522 · -15.0%
- By 2050
- 61,344 · -25.0%
- By 2075
- 45,027 · -44.9%
- By 2100
- 31,305 · -61.7%
Race, ethnicity, and origin ACS 2023
- Neighborhood character
- Predominantly White (82%)
- Race & ethnicity
- White 82% Two or more races 8% Black 7% Hispanic / Latino 3%
- Common ancestry
- Romanian 7% Serbian 3% Iranian 1%
- Foreign-born
- 2% · Canada
- Languages at home
- 96% English-only · Spanish 2% Other Indo-European 1%
Political lean MEDSL · Lawrence
- 2024 margin
- Solid R (+33.8) · D 32.8% · R 66.5%
- 2008→2024 swing
- -28.7pp toward R · 2008: -5.1pp · 2024: -33.8pp
- All cycles
- 2024: R+33.8 2020: R+29.6 2016: R+28.1 2012: R+9.0 2008: R+5.1
Not yet ingested
- Civics
- —
Market trends
- HPI YoY
- ▼ -56.77%
- Current HPI
- 159.3091
- Rent YoY
- ▲ 20.05%
- Metro
- New Castle, PA
- State GDP YoY
- ▲ 1.68%
- F500 in state
- 34
Industry mix (Fortune 500 HQ in PA)
| Industry | F500 HQs | Revenue |
|---|---|---|
| Healthcare | 2 | $309B |
|
||
| Insurance | 2 | $27B |
|
||
| Telecommunications / Media | 1 | $124B |
|
||
| Industrial Distribution | 1 | $22B |
|
||
| Financial Services | 1 | $20B |
|
||
| Chemicals / Materials | 1 | $18B |
|
||
Price history
+557.9% since first listed2 events — show timeline
- 2026-06-15 Listed $125,000 West Penn MLS
- 1999-05-03 Sold (Public Records) $19,000 Public Records
Property tax history
+1.2%/yrLatest (2026): $1,579 · +2.0% YoY. Source: county tax records.
Cash-flow waterfall
monthlySold comps — $/sqft
last 12 mo · ≤1 miLoading sold comps…