2 ACRES New Sulphur Springs Rd · San Antonio, TX
Flood risk No data
- FEMA flood zone
- —
- Chance of flooding over 30 yrs
- —
- Est. flood insurance / yr
- —
Fire risk No data
- Est. fire insurance / yr
- —
Heat risk No data
- Hot days now (above threshold)
- —
- Hot days in 30 yrs
- —
Wind risk No data
- Chance of severe wind over 30 yrs
- —
Air-quality risk No data
- Unhealthy air days now
- —
- Unhealthy air days in 30 yrs
- —
Risk factors via First Street. Map © Google.
Why this score? — see what drove the C grade
The composite is a weighted blend of 9 inputs, each scored 0–100. Each bar is that input's sub-score; the figure is the points it added to the 100-point composite (weight × sub-score).
- Cash flow +20.8/30.0
- ARV discount +12.3/15.0
- DSCR +6.6/10.0
- 1% rule +5.5/10.0
- Livability +4.0/5.0
- Condition / age +4.0/5.0
- Rent growth +2.5/5.0
- Schools +1.9/10.0
- Appreciation +0.0/10.0
$214,900
🖨 Deal sheet 📄 Offer letter ✓ Due diligence
Listing remarks MLS
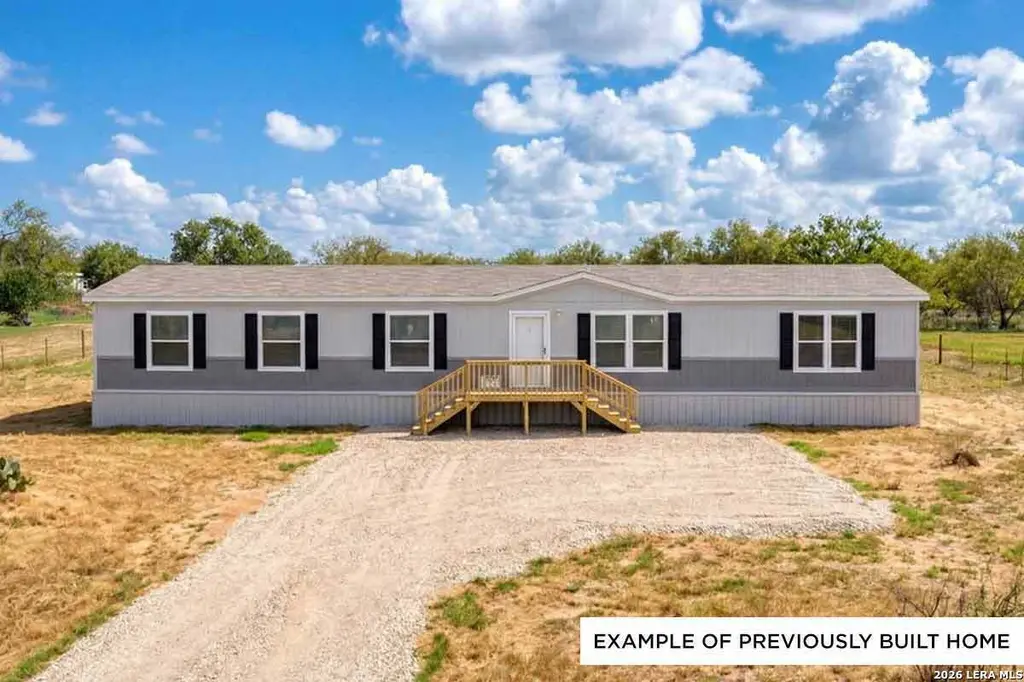
Brand-New Modular Home on 2 Acres - Under $215,000! Take advantage of this rare opportunity to own a new construction "to-be-built" modular home in a rural location, yet inside Loop 1604 - an ideal blend of country living with nearby conveniences! The home can be built on a concrete foundation and qualifies for FHA, VA, and Conventional financing. Enjoy the peace of mind that comes with all-new utilities, systems, and upgrades, paired with the freedom of living on a generously sized property. The proposed floor plan offers excellent living spaces including the open Living Room / Kitchen / Dining Room, plus a separate Family Room with nearby "Tech Space" Office & Mud Room! Custom finishes available - Buyers still have the chance to select interior finishes and personalize the home to their taste. This listing price is land and home only. Buyer has the option to install & connect utilities or add that to the total sales price. The land is ideal for country living and has space for your "mini farm", with a seasonal creek that renders some of the acreage in the 100-year flood plain. Home photos are for inspirational purposes only and are from similar nearby project. Final home placement, orientation, and features may vary.
Key facts
- 2 acre lot
- Built 2026
- Listed 73 days
Neighborhood map
What this means for you Summary
Snapshot
- This is a 4-bed/2.0-bath single-family listed at $215k. Condition is rated good.
Deal economics
- At list price, monthly cash flow is $293 ($4k/yr) — positive.
- The deal already cash-flows at list — no discount required.
- Meets the 1% rule at list price ($2k rent vs $215k).
- Recommended offer: $202k (6.0% below list) — sets the bar for market timing.
- Cap rate 7.9% vs local median 3.8% in San Antonio — top-decile yield for the area; either an underpriced asset or a hidden risk that comps aren't pricing in. Stress-test before assuming the spread holds.
Location & tenants
- Location reads 80/100 on livability (#31 in TX, #1,616 nationally) — a professional / high-income tenant draw. Strengths: amenities A+, commute A+, cost of living A+; Watch: schools C-, crime F.
- East Central ISD (rural): math 16% / reading 25% proficiency, ranked #758 of 826 in TX (top 92%) — low school quality limits family demand, transient renter base, plan for 1-2y turnover; 61% free/reduced lunch — lower-income household profile, screen leases tightly.
- Market conditions: 277 active listings in the ZIP; 2 comparable units currently listed for rent nearby; 8,308 units permitted in Bexar County in 2024 (2,506 in 5+ unit buildings).
Forward outlook
- Local home prices are declining (-3.0%/yr); year-one equity from $1k of loan paydown is wiped out by about $6k of value loss. Plan a longer hold.
- Bexar County population projected at +50% by 2050 — long-run rental-demand tailwind backs the buy-and-hold thesis.
Negotiation context
- It's been on market 73 days — a 6% lower offer ($202k) is reasonable based on typical stale-listing flexibility.
Questions for the listing agent
- It's been on market 73 days. Have you received any prior offers? Is the seller open to a 6% concession, seller financing, or rate buy-down credit?
- Why hasn't it sold? Are there any deal-killer items the seller is aware of (foundation, flood, title, zoning, code violations)?
- Is there a deadline driving the sale (1031 exchange, divorce, estate, relocation)? That informs how much negotiation room exists.
- Crime grade is F in this area — have there been break-ins, vandalism, or insurance claims at this property in the last 3 years? What carrier currently insures it and at what premium?
- What's the average days-on-market for RENTAL listings here right now (not sales)? A rising rental-DOM trend means longer vacancies and softer asking-rent achievability than the comps imply.
- What's the recent tenant-quality profile in this submarket — average credit score on applications, eviction rate, late-payment / NSF rate, and stable-employment percentage? A property-management company in the area should have these aggregated.
- How much new for-sale + rental construction is in the pipeline within 1–3 miles? Heavy new supply typically softens prices + rents 12–24 months out; constrained supply supports both.
Investment metrics
- 1% rule
- 1.05% ✓
- Cap rate
- 7.93%
- Cash-on-cash
- 5.85%
- DSCR
- 1.26
- GRM
- 8.0
CMA / ARV
- ARV (median comp)
- $240,479
- List price
- $214,900
- Delta
- -10.64%
- Verdict
- UNDERPRICED
- Comps
- 20 within 1.0 mi
Show comp detail 12 sales within ~0.75 mi
| Address | Dist | Beds/Ba | Sqft | Sold | Price | $/sf | Match |
|---|---|---|---|---|---|---|---|
| 5721 Provo | 0.74mi | 4/3.0 | 2,252 (-2%) | 2mo | $469,990 | $209 | 56 |
| 7105 Aqua Marine | 0.71mi | 4/3.0 | 2,210 (-4%) | 1mo | $286,999 | $130 | 55 |
| 7006 Aqua Marine | 0.71mi | 4/3.0 | 2,378 (+3%) | 3mo | $269,999 | $114 | 55 |
| 8217 Blue Pearls | 0.71mi | 4/3.0 | 2,378 (+3%) | 5mo | $279,999 | $118 | 53 |
| 8216 Blue Pearls | 0.71mi | 4/3.0 | 2,210 (-4%) | 4mo | $254,999 | $115 | 53 |
| 8203 Queen Marie | 0.71mi | 4/2.5 | 2,173 (-6%) | 6mo | $235,999 | $109 | 50 |
| 6915 Aqua Marine | 0.71mi | 4/3.0 | 2,210 (-4%) | 8mo | $271,999 | $123 | 50 |
| 7003 Aqua Marine | 0.71mi | 4/3.0 | 2,024 (-12%) | 4mo | $248,999 | $123 | 39 |
| 7002 Aqua Marine | 0.71mi | 4/3.0 | 2,024 (-12%) | 5mo | $274,999 | $136 | 38 |
| 8210 Blue Pearls | 0.71mi | 4/3.0 | 2,024 (-12%) | 6mo | $281,924 | $139 | 37 |
| 6903 Aqua Marine | 0.71mi | 4/3.0 | 2,024 (-12%) | 7mo | $286,999 | $142 | 36 |
| 6919 Aqua Marine | 0.71mi | 4/3.0 | 2,024 (-12%) | 8mo | $248,999 | $123 | 36 |
Match score weights: distance 35% · size 25% · config 20% · recency 20%. Top-matched comps best support the ARV.
Projected returns pro-forma
-3.0% appreciation · 3.0% rent growth · sell at horizon
- IRR
- -7.2%
- Equity multiple
- 0.73×
- Total profit
- $-16,096
- Equity at exit
- $32,042
- IRR
- 2.4%
- Equity multiple
- 1.17×
- Total profit
- $10,192
- Equity at exit
- $18,581
Cash invested: $60,172 (down + closing). Projections, not guarantees.
Landlord ↔ Tenant lean methodology
- Overall (STATE)
- 87 Strongly Landlord-Friendly
- State Texas
- 87 Strongly Landlord-Friendly · R+5
- County
- — inherits STATE
- City
- — inherits STATE
ZIP-level market 78263
- Home prices YoY
- -8.1%
- Active inventory
- 277
- Price-to-rent
- 8.0×
Monthly cashflow live
- Estimated rent
- $2,251 medium interval (Pro) →
- Mortgage (P&I)
- −$1,127
- Tax est. 1.5%
- −$269 /mo · $3,224/yr
- Insurance
- −$90
- HOA
- −$0
- Vacancy / Maint / Mgmt
- −$473
- Net cashflow
- $293
Break-even live
UW: 25.0% down · 7.5% · 30yr · 1.5% tax · 5.0% vac · 8.0% maint · 8.0% mgmt
Financing live
Cash to close
- Down payment
- $53,725
- Closing costs
- $6,447
- Reserves months
- —
- Total cash needed
- —
Loan-product check · same deal, 3 products live
Conventional
25% down · 7.5% · 30yr
- Down + closing
- —
- Monthly P&I
- —
- Monthly cashflow
- —
- DSCR
- —
- Eligible?
- —
Personal DTI + credit; lowest rate.
DSCR
20% down · 8.5% · 30yr
- Down + closing
- —
- Monthly P&I
- —
- Monthly cashflow
- —
- DSCR
- —
- Eligible?
- —
No personal income docs; deal must DSCR.
Hard money
10% down · 12.0% · 12mo
- Down + closing
- —
- Monthly P&I
- —
- Monthly cashflow
- —
- DSCR
- —
- Eligible?
- —
Short-term bridge; refi at stabilization.
Rent comps 2 comps
| Address | Beds | Baths | Sqft | Rent | $/sqft | DOM | Units | Dist |
|---|---|---|---|---|---|---|---|---|
| 7316 Green Sapphire San Antonio, TX | 4.0 | 2.0 | 1600 | $1,750 | $1.09 | 22d | 1 | 0.97mi |
| 5330 Kody Crk San Antonio, TX | 4.0 | 2.5 | 2251 | $2,695 | $1.20 | 24d | 1 | 1.21mi |
Listing history 14 events
-
2026-06-18days on market $214,900 Active 73 DOM
-
2026-06-17days on market $214,900 Active 72 DOM
-
2026-06-16days on market $214,900 Active 71 DOM
-
2026-06-15days on market $214,900 Active 70 DOM
-
2026-06-13days on market $214,900 Active 68 DOM
-
2026-06-09days on market $214,900 Active 64 DOM
-
2026-06-08days on market $214,900 Active 63 DOM
-
2026-06-07days on market $214,900 Active 62 DOM
-
2026-06-04days on market $214,900 Active 59 DOM
-
2026-06-03days on market $214,900 Active 58 DOM
-
2026-06-02days on market $214,900 Active 57 DOM
-
2026-06-01days on market $214,900 Active 56 DOM
-
2026-05-31days on market $214,900 Active 55 DOM
-
2026-04-06$214,900 New 1279-char remark
Show marketing remark (1279 chars)
Brand-New Modular Home on 2 Acres - Under $215,000! Take advantage of this rare opportunity to own a new construction "to-be-built" modular home in a rural location, yet inside Loop 1604 - an ideal blend of country living with nearby conveniences! The home can be built on a concrete foundation and qualifies for FHA, VA, and Conventional financing. Enjoy the peace of mind that comes with all-new utilities, systems, and upgrades, paired with the freedom of living on a generously sized property. The proposed floor plan offers excellent living spaces including the open Living Room / Kitchen / Dining Room, plus a separate Family Room with nearby "Tech Space" Office & Mud Room! Custom finishes available - Buyers still have the chance to select interior finishes and personalize the home to their taste. This listing price is land and home only. Buyer has the option to install & connect utilities or add that to the total sales price. The land is ideal for country living and has space for your "mini farm", with a seasonal creek that renders some of the acreage in the 100-year flood plain. Home photos are for inspirational purposes only and are from similar nearby project. Final home placement, orientation, and features may vary.
ⓘ Source: listings_history table (triggers on properties + properties_extension) + one-shot
backfill from property_details.listing_events for pre-trigger history.
Nearby sold comps map
Loading sold comps map…
Walkable amenities ~0.75 mi
Loading nearby amenities…
Taxation est. · year 1
- Rental income
- $27,017
- − Mortgage interest
- −$12,038
- − Property taxes
- −$3,224
- − Insurance
- −$1,074
- − Repairs & maintenance
- −$2,161
- − Management
- −$2,161
- − Depreciation
- −$6,252
- Taxable income
- $107
- Est. tax owed @ 24.0%
- −$26
- After-tax cash flow
- $3,496/yr
For passive investors: Depreciation is non-cash, so a rental often shows a tax loss while cash-flowing — sheltering income. Rental losses are passive: they offset passive income freely, and up to $25,000/yr can offset ordinary (W-2) income if you actively participate and your MAGI is under $100k (phasing out to $0 by $150k); unused losses carry forward. On sale, claimed depreciation is recaptured at up to 25%, and gains may owe capital-gains tax (a 1031 exchange can defer both). Figures are a year-1 estimate at your 24.0% rate — not tax advice; consult a CPA.
Condition & rehab AI · 12 photos
This brand-new modular home is in excellent condition with modern finishes and a spacious layout. It offers a great opportunity for a buyer looking for a move-in-ready property with potential for further value enhancement.
Value-add opportunities
- Both Landscaping and curb appeal improvements — Enhances the home's curb appeal and can attract more buyers
- Both Add a small garden or flower bed near the front door — Improves the home's aesthetic and can increase its value
- Both Install a smart home system — Enhances convenience and can appeal to tech-savvy buyers
Renovation cost estimate screening
Value-add ROI direction
- Both Landscaping and curb appeal improvements — Enhances the home's curb appeal and can attract more buyers ↑
- Both Add a small garden or flower bed near the front door — Improves the home's aesthetic and can increase its value ↑
- Both Install a smart home system — Enhances convenience and can appeal to tech-savvy buyers ↑
ⓘ Cost ranges are severity-bucket heuristics (US national rule-of-thumb). Get contractor quotes + a written scope before underwriting a rehab budget.
Schools (NCES district)
- District
- East Central ISD
- NCES district ID
- 4817850
- Math proficiency
- 16% ▼ -12.00%
- Reading proficiency
- 25% ▼ -6.00%
- Median HH income
- $53,941
- Composite
- 18.67/100
- National rank
- #8887
- State rank
- #758 of 826 in TX
Livability — San Antonio
- Score
- 80/100
- State rank
- #31
- US rank
- #1616
Category grades
Schools grade is shown separately in the Schools card above.
Census & demographics
- City population
- 1,806,925
- Population (ZIP)
- 4,514
Population outlook (Bexar County) Hauer SSP2
- Today (2025)
- 2,336,851 people
- By 2030
- 2,560,728 · +9.6%
- By 2040
- 3,020,569 · +29.3%
- By 2050
- 3,493,522 · +49.5%
- By 2075
- 4,668,459 · +99.8%
- By 2100
- 5,533,242 · +136.8%
Race, ethnicity, and origin ACS 2023
- Neighborhood character
- Diverse neighborhood (Simpson 0.61)
- Race & ethnicity
- Hispanic / Latino 45% White 43% Two or more races 24% Black 10%
- Hispanic origin (detail)
- Mexican 35% Puerto Rican 2% Dominican 2%
- Common ancestry
- Romanian 9% Iranian 1% Scotch-Irish 1%
- Foreign-born
- 10% · Canada, Dominican Republic
- Languages at home
- 71% English-only · Spanish 29%
Political lean MEDSL · Bexar
- 2024 margin
- Lean D (+9.8) · D 54.3% · R 44.6% · Other 1.1%
- 2008→2024 swing
- +4.2pp toward D · 2008: 5.6pp · 2024: 9.8pp
- All cycles
- 2024: D+9.8 2020: D+18.2 2016: D+13.5 2012: D+4.6 2008: D+5.6
Not yet ingested
- Civics
- —
Market trends
- HPI YoY
- ▼ -28.29%
- Current HPI
- 322.4738
- Rent YoY
- —
- Metro
- —
- State GDP YoY
- ▲ 3.95%
- F500 in state
- 110
Industry mix (Fortune 500 HQ in TX)
| Industry | F500 HQs | Revenue |
|---|---|---|
| Energy | 16 | $1,198B |
|
||
| Technology | 5 | $198B |
|
||
| Engineering / Construction | 4 | $72B |
|
||
| Energy Services | 3 | $60B |
|
||
| Utilities | 3 | $41B |
|
||
| Healthcare | 2 | $330B |
|
||
Price history
1 event — show timeline
- 2026-04-06 Listed $214,900 LERA
Cash-flow waterfall
monthlySold comps — $/sqft
last 12 mo · ≤1 miLoading sold comps…