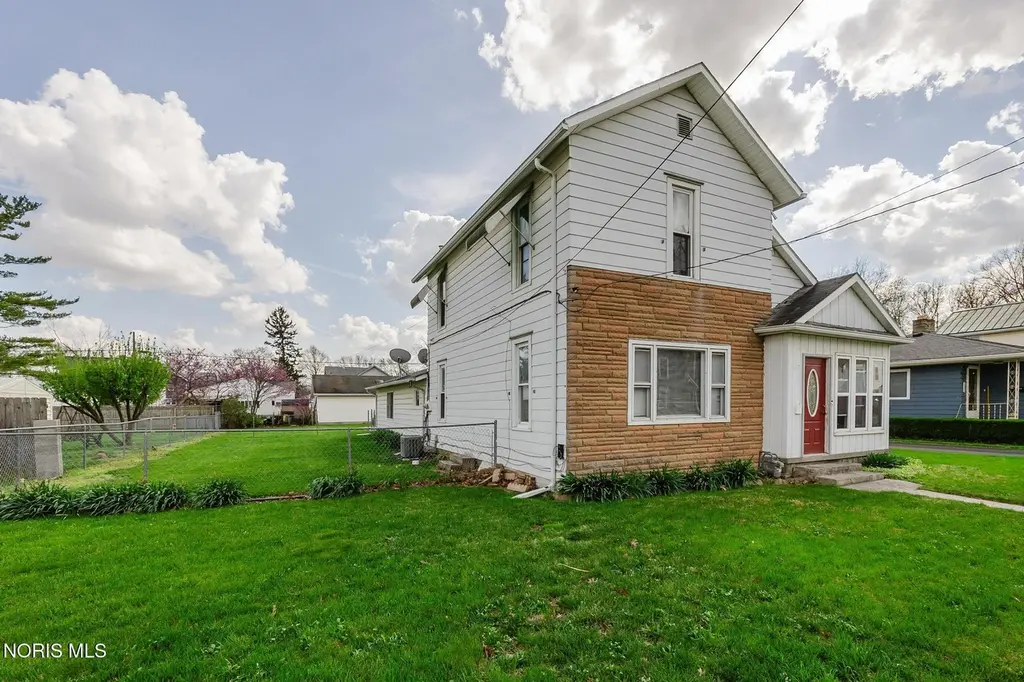
137 Allen Ave · Findlay, OH
Flood risk 1/10 · Minimal
- FEMA flood zone
- X (unshaded)
- Chance of flooding over 30 yrs
- 0.0%
- Est. flood insurance / yr
- $507 – $1,088
Fire risk 1/10 · Minimal
- Est. fire insurance / yr
- $713 – $1,323
Heat risk 3/10 · Minor
- Hot days now (above 98°F)
- 7 days/yr
- Hot days in 30 yrs
- 17 days/yr
Wind risk 2/10 · Minimal
- Chance of severe wind over 30 yrs
- —
Air-quality risk 2/10 · Minimal
- Unhealthy air days now
- 1 days/yr
- Unhealthy air days in 30 yrs
- 2 days/yr
Risk factors via First Street. Map © Google.
Why this score? — see what drove the C grade
The composite is a weighted blend of 9 inputs, each scored 0–100. Each bar is that input's sub-score; the figure is the points it added to the 100-point composite (weight × sub-score).
- Cash flow +20.3/30.0
- ARV discount +12.6/15.0
- DSCR +6.4/10.0
- Schools +4.7/10.0
- 1% rule +4.6/10.0
- Livability +4.0/5.0
- Rent growth +3.9/5.0
- Condition / age +2.5/5.0
- Appreciation +0.0/10.0
$179,900
🖨 Deal sheet 📄 Offer letter ✓ Due diligence
Listing remarks
Sunny windowed front porch to enjoy. Older home is in very nice condition. Updated utilities and new roof. 4 bedrooms, walking distance to University of Findlay, shopping and restaurants. Beautiful new hickory kitchen cabinets. There is a large storage room beside the garage that could very easily be used as a work-out rm. Fenced Yard for kiddos and or pets. Hope you enjoy viewing this very nice property. REALTOR. Com has this property listed as a Foreclosure it has never been a foreclosure.
Key facts
- 0.23 acre lot
- 2 garage spots
- Built 1900
Property features AI
Finance
- HOA & community: Curbs; Street lights
Exterior
- Parking: Attached garage with garage door opener; 2 garage spaces; Total parking for 4 vehicles; Alley access; Additional parking; Gravel and off-street parking; On-site storage
- Security: Smoke detector(s)
- Utilities: Public water; Public sewer; 200+ amp electric service; Natural gas connected; Electricity connected; Cable available; Fiber and WiFi available; Internet available
- Home design: Single-family residence (house); Two levels / 2 stories; No attached units or common walls; Green energy efficient windows
- Construction: Aluminum siding and stone exterior; Asphalt roof; Combination foundation with crawl space; Year built per public records
- Exterior features: Awning(s); Storage; Private entrance; Enclosed front porch; Front porch; Chain link full fencing; Level lot; City street frontage; Asphalt road surface
Interior
- Kitchen: Electric range; Dishwasher; Refrigerator; Eat-in kitchen
- Bedrooms: Upper-level bedrooms (three bedrooms on upper level); Main-level bedroom (one bedroom on main level)
- Flooring: Carpet; Hardwood; Laminate; Vinyl
- Bathrooms: 2 full bathrooms
- Heating & cooling: Forced air heating (natural gas); Central air conditioning
- Interior features: Eat-in kitchen; Storage; Ceiling fans; Drop ceilings; Double-pane windows with storm windows and screens; Window coverings; Storm door(s); 8 total rooms; Refinished hardwood in one bedroom; Interior entry, partial unfinished basement
- Laundry & utility: Washer hookup; Electric dryer hookup; Laundry on main level; Accessible utilities or laundry; Water heater included
Neighborhood map
What this means for you Summary
Snapshot
- This is a 3-bed/1.0-bath single-family listed at $180k.
Deal economics
- At list price, monthly cash flow is $230 ($3k/yr) — positive.
- The deal already cash-flows at list — no discount required.
- To meet the 1% rule (rent ≥ 1% of price), the offer needs to be $172k (4.1% below list).
- Recommended offer: $172k (4.1% below list) — sets the bar for 1% rule.
- Cap rate 7.8% vs local median 5.0% in Findlay — top-decile yield for the area; either an underpriced asset or a hidden risk that comps aren't pricing in. Stress-test before assuming the spread holds.
Location & tenants
- Location reads 81/100 on livability (#98 in OH, #1,496 nationally) — a professional / high-income tenant draw. Strengths: amenities A+, cost of living A+, housing A+; Watch: employment D+, commute F.
- Findlay City (town): math 56% / reading 56% proficiency, ranked #357 of 656 in OH (top 54%) — acceptable for families but not a draw, mixed tenant base, ~2y average lease.
- Zoned schools: Northview Primary School (math 57% / reading 57%, grade C+, #729 of 1,584 statewide, top 48%, 361 students, 54% FRL); Glenwood Middle School (math 47% / reading 41%, grade D, #484 of 654 statewide, top 74%, 535 students, 45% FRL); Findlay High School (math 51% / reading 60%, grade C, #296 of 781 statewide, top 39%, 1,915 students, 31% FRL).
- Market conditions: Rents rising fast (+5.7%/yr); 219 active listings in the ZIP; 1 comparable units currently listed for rent nearby; 257 units permitted in Hancock County in 2024 (150 in 5+ unit buildings).
- This rent runs 30% of the median local income ($68k/yr) — at the standard rent-burdened threshold; future hikes will face affordability resistance.
Forward outlook
- Local home prices are declining (-3.0%/yr); year-one equity from $1k of loan paydown is wiped out by about $5k of value loss. Plan a longer hold.
- Hancock County population projected to shrink 4% by 2050 — rents likely to lag national; underwrite the cash flow, not the appreciation.
Negotiation context
- It's been on market 42 days — a 3% lower offer ($175k) is reasonable based on typical stale-listing flexibility.
- 7 sale attempts since 14y ago with the ask held roughly flat each time — persistent listings suggest the price (not the market) is what's stuck; bring a comps-based counter.
- Current owner paid $77k; list at $180k implies a 134% gain — meaningful room to come down on a strong offer.
Risks & watch-outs
- Watch-outs: built in 1900 — expect roof / HVAC / electrical / plumbing capex.
Questions for the listing agent
- It's been on market 42 days. Have you received any prior offers? Is the seller open to a 4% concession, seller financing, or rate buy-down credit?
- Built in 1900 — when were the roof, HVAC, electrical panel, plumbing, and water heater last replaced?
- Is there a deadline driving the sale (1031 exchange, divorce, estate, relocation)? That informs how much negotiation room exists.
- Schools are B-rated — typically a magnet for longer-tenancy family renters. What's the average tenant stay here, and is there a school-zone premium baked into asking?
- What's the average days-on-market for RENTAL listings here right now (not sales)? A rising rental-DOM trend means longer vacancies and softer asking-rent achievability than the comps imply.
- What's the recent tenant-quality profile in this submarket — average credit score on applications, eviction rate, late-payment / NSF rate, and stable-employment percentage? A property-management company in the area should have these aggregated.
- How much new for-sale + rental construction is in the pipeline within 1–3 miles? Heavy new supply typically softens prices + rents 12–24 months out; constrained supply supports both.
Investment metrics
- 1% rule
- 0.96% ✗
- Cap rate
- 7.83%
- Cash-on-cash
- 5.48%
- DSCR
- 1.24
- GRM
- 8.7
CMA / ARV
- ARV (on-the-fly)
- $203,000
- Comps found
- 12
Show comp detail 12 sales within ~0.75 mi
| Address | Dist | Beds/Ba | Sqft | Sold | Price | $/sf | Match |
|---|---|---|---|---|---|---|---|
| 137 Allen Ave | 0.00mi | 4/2.0 (+1) | 1,624 (0%) | 1mo | $181,500 | $112 | 90 |
| 115 George St | 0.18mi | 4/3.0 (+1) | 1,597 (-2%) | 5mo | $150,000 | $94 | 72 |
| 1934 Geffs Ave | 0.53mi | 4/1.5 (+1) | 1,643 (+1%) | 0mo | $213,500 | $130 | 66 |
| 142 Clifton Ave | 0.42mi | 3/1.5 | 1,494 (-8%) | 1mo | $156,277 | $105 | 64 |
| 217 Prentiss Ave | 0.51mi | 2/2.0 (-1) | 1,588 (-2%) | 2mo | $260,000 | $164 | 62 |
| 533 Hull Ave | 0.50mi | 3/2.0 | 1,516 (-7%) | 1mo | $189,900 | $125 | 60 |
| 315 W Melrose Ave | 0.74mi | 3/1.0 | 1,542 (-5%) | 2mo | $204,500 | $133 | 56 |
| 224 Defiance Ave | 0.61mi | 4/2.0 (+1) | 1,716 (+6%) | 4mo | $199,900 | $116 | 50 |
| 421 Clifton Ave | 0.57mi | 3/1.5 | 1,820 (+12%) | 2mo | $210,000 | $115 | 50 |
| 1908 Gayle Ln | 0.66mi | 4/1.5 (+1) | 1,536 (-5%) | 5mo | $272,000 | $177 | 49 |
| 1010 Brenda Ct | 0.70mi | 3/1.0 | 1,476 (-9%) | 5mo | $180,000 | $122 | 48 |
| 2215 Beecher St | 0.74mi | 3/2.0 | 1,383 (-15%) | 1mo | $254,000 | $184 | 36 |
Match score weights: distance 35% · size 25% · config 20% · recency 20%. Top-matched comps best support the ARV.
Projected returns pro-forma
-3.0% appreciation · 5.68% rent growth · sell at horizon
- IRR
- -5.1%
- Equity multiple
- 0.81×
- Total profit
- $-9,760
- Equity at exit
- $26,824
- IRR
- 7.3%
- Equity multiple
- 1.61×
- Total profit
- $30,909
- Equity at exit
- $15,554
Cash invested: $50,372 (down + closing). Projections, not guarantees.
Landlord ↔ Tenant lean methodology
- Overall (STATE)
- 73 Landlord-Friendly
- State Ohio
- 73 Landlord-Friendly · R+6
- County
- — inherits STATE
- City
- — inherits STATE
ZIP-level market 45840
- Rents YoY
- 5.7%
- Active inventory
- 219
- Price-to-rent
- 8.7×
Monthly cashflow live
- Estimated rent
- $1,725 medium interval (Pro) →
- Mortgage (P&I)
- −$943
- Tax from tax record
- −$114 /mo · $1,368/yr
- Insurance
- −$75
- HOA
- −$0
- Vacancy / Maint / Mgmt
- −$362
- Net cashflow
- $230
Break-even live
UW: 25.0% down · 7.5% · 30yr · 1.5% tax · 5.0% vac · 8.0% maint · 8.0% mgmt
Financing live
Cash to close
- Down payment
- $44,975
- Closing costs
- $5,397
- Reserves months
- —
- Total cash needed
- —
Loan-product check · same deal, 3 products live
Conventional
25% down · 7.5% · 30yr
- Down + closing
- —
- Monthly P&I
- —
- Monthly cashflow
- —
- DSCR
- —
- Eligible?
- —
Personal DTI + credit; lowest rate.
DSCR
20% down · 8.5% · 30yr
- Down + closing
- —
- Monthly P&I
- —
- Monthly cashflow
- —
- DSCR
- —
- Eligible?
- —
No personal income docs; deal must DSCR.
Hard money
10% down · 12.0% · 12mo
- Down + closing
- —
- Monthly P&I
- —
- Monthly cashflow
- —
- DSCR
- —
- Eligible?
- —
Short-term bridge; refi at stabilization.
Rent comps 1 comps
| Address | Beds | Baths | Sqft | Rent | $/sqft | DOM | Units | Dist |
|---|---|---|---|---|---|---|---|---|
| 606 South St Findlay, OH | 3.0 | 1.0 | 1351 | $1,700 | $1.26 | 43d | 1 | 1.45mi |
Listing history 21 events
-
2026-05-30statusdays on market $179,900 Pending 42 DOM
-
2026-04-27historical Contingent
-
2026-04-18$179,900 Active
-
2026-04-14historical $179,900
-
2026-03-18historical $1,550
-
2026-02-10price $1,550
-
2026-01-01$1,650
-
2025-12-29historical
-
2025-12-08$149,900 Active
-
2015-01-20soldstatus $77,000
-
2014-07-21historical
-
2014-07-21historical
-
2013-09-23$91,500
-
2013-09-23$91,500
-
2012-06-18soldstatus $85,000
-
2012-06-14soldstatus $85,000
-
2012-06-14soldstatus $85,000
-
2012-04-11$85,000
-
2012-04-11$89,900
-
2004-09-21soldstatus $87,000
-
2003-09-25soldstatus $76,800
ⓘ Source: listings_history table (triggers on properties + properties_extension) + one-shot
backfill from property_details.listing_events for pre-trigger history.
Tax reassessment forecast OH · Partial reset (capped growth)
- Current annual tax
- $1,368 · $114/mo
- Projected year-2 tax
- $2,087 · $174/mo
- Expected delta
- +$719/yr (+$60/mo · 52.5%)
ⓘ Screening estimate from a state-policy table — verify with the county assessor before closing.
Climate risk First Street
- Flood 1/10 Low FEMA zone X (unshaded) · 0% chance over 30 yrs
- Wildfire 1/10 Low
- Heat 3/10 Moderate 7 d/yr ≥98°F today · 17 d/yr by 30 yrs out
- Wind 2/10 Low
- Air quality 2/10 Low 1 unhealthy d/yr today · 2 by 30 yrs out
Nearby sold comps map
Loading sold comps map…
Walkable amenities ~0.75 mi
Loading nearby amenities…
Taxation est. · year 1
- Rental income
- $20,697
- − Mortgage interest
- −$10,077
- − Property taxes
- −$1,368
- − Insurance
- −$900
- − Repairs & maintenance
- −$1,656
- − Management
- −$1,656
- − Depreciation
- −$5,233
- Taxable loss
- −$193
- Est. tax savings @ 24.0%
- +$46
- After-tax cash flow
- $2,808/yr
For passive investors: Depreciation is non-cash, so a rental often shows a tax loss while cash-flowing — sheltering income. Rental losses are passive: they offset passive income freely, and up to $25,000/yr can offset ordinary (W-2) income if you actively participate and your MAGI is under $100k (phasing out to $0 by $150k); unused losses carry forward. On sale, claimed depreciation is recaptured at up to 25%, and gains may owe capital-gains tax (a 1031 exchange can defer both). Figures are a year-1 estimate at your 24.0% rate — not tax advice; consult a CPA.
Schools (NCES district)
- District
- Findlay City
- NCES district ID
- 3910000
- Math proficiency
- 56% ▼ -11.00%
- Reading proficiency
- 56% ▼ -9.00%
- Median HH income
- $45,261
- Composite
- 47.31/100
- National rank
- #2300
- State rank
- #357 of 656 in OH
Livability — Findlay
- Score
- 81/100
- State rank
- #98
- US rank
- #1496
Category grades
Schools grade is shown separately in the Schools card above.
Census & demographics
- Census place
- Findlay, OH
- County
- Hancock County · 54,559 people
- City population
- 54,559
- Metro
- Findlay, OH
- Population (ZIP)
- 54,559
- Household income
- $68,083
- Rent vs Own
- Severe rent burden
- 1540.0
Population outlook (Hancock County) Hauer SSP2
- Today (2025)
- 77,526 people
- By 2030
- 77,777 · +0.3%
- By 2040
- 76,976 · -0.7%
- By 2050
- 74,479 · -3.9%
- By 2075
- 65,741 · -15.2%
- By 2100
- 52,942 · -31.7%
Race, ethnicity, and origin ACS 2023
- Neighborhood character
- Predominantly White (85%)
- Race & ethnicity
- White 85% Hispanic / Latino 6% Two or more races 5% Asian 2% Black 2%
- Hispanic origin (detail)
- Mexican 5%
- Common ancestry
- Romanian 3% Italian 2% Lithuanian 2%
- Foreign-born
- 4% · Canada, China
- Languages at home
- 94% English-only · Spanish 3% Other Asian/Pacific 1% Arabic 1%
Political lean MEDSL · Hancock
- 2024 margin
- Solid R (+38.4) · D 30.2% · R 68.7% · Other 1.1%
- 2008→2024 swing
- -15.3pp toward R · 2008: -23.1pp · 2024: -38.4pp
- All cycles
- 2024: R+38.4 2020: R+37.5 2016: R+40.8 2012: R+28.3 2008: R+23.1
Not yet ingested
- Civics
- —
Market trends
- HPI YoY
- ▼ -250.43%
- Current HPI
- 194.9132
- Rent YoY
- ▲ 5.68%
- Metro
- Findlay, OH
- State GDP YoY
- ▲ 1.98%
- F500 in state
- 48
Industry mix (Fortune 500 HQ in OH)
| Industry | F500 HQs | Revenue |
|---|---|---|
| Insurance | 3 | $145B |
|
||
| Industrial Machinery | 3 | $49B |
|
||
| Financial Services | 3 | $24B |
|
||
| Consumer Goods | 2 | $93B |
|
||
| Aerospace / Defense | 2 | $47B |
|
||
| Utilities | 2 | $33B |
|
||
Price history
+134.2% since first listed20 events — show timeline
- 2026-04-27 Contingent — NORIS
- 2026-04-18 Listed $179,900 NORIS
- 2026-04-14 Coming Soon $179,900 NORIS
- 2026-03-18 Rental Removed $1,550 APPFOLIO
- 2026-02-10 Price Changed $1,550 APPFOLIO
- 2026-01-01 Listed for Rent $1,650 APPFOLIO
- 2025-12-29 Listing Removed — NORIS
- 2025-12-08 Listed $149,900 NORIS
- 2015-01-20 Sold (Public Records) $77,000 Public Records
- 2014-07-21 Listing Removed — NORIS
- 2014-07-21 Listing Removed — NORIS
- 2013-09-23 Listed $91,500 NORIS
- 2013-09-23 Listed $91,500 NORIS
- 2012-06-18 Sold (Public Records) $85,000 Public Records
- 2012-06-14 Sold (MLS) $85,000 NORIS
- 2012-06-14 Sold (MLS) $85,000 NORIS
- 2012-04-11 Listed $89,900 NORIS
- 2012-04-11 Listed $85,000 NORIS
- 2004-09-21 Sold (Public Records) $87,000 Public Records
- 2003-09-25 Sold (Public Records) $76,800 Public Records
Property tax history
+2.7%/yrLatest (2025): $1,368 · -6.6% YoY. Source: county tax records.
Cash-flow waterfall
monthlySold comps — $/sqft
last 12 mo · ≤1 miLoading sold comps…