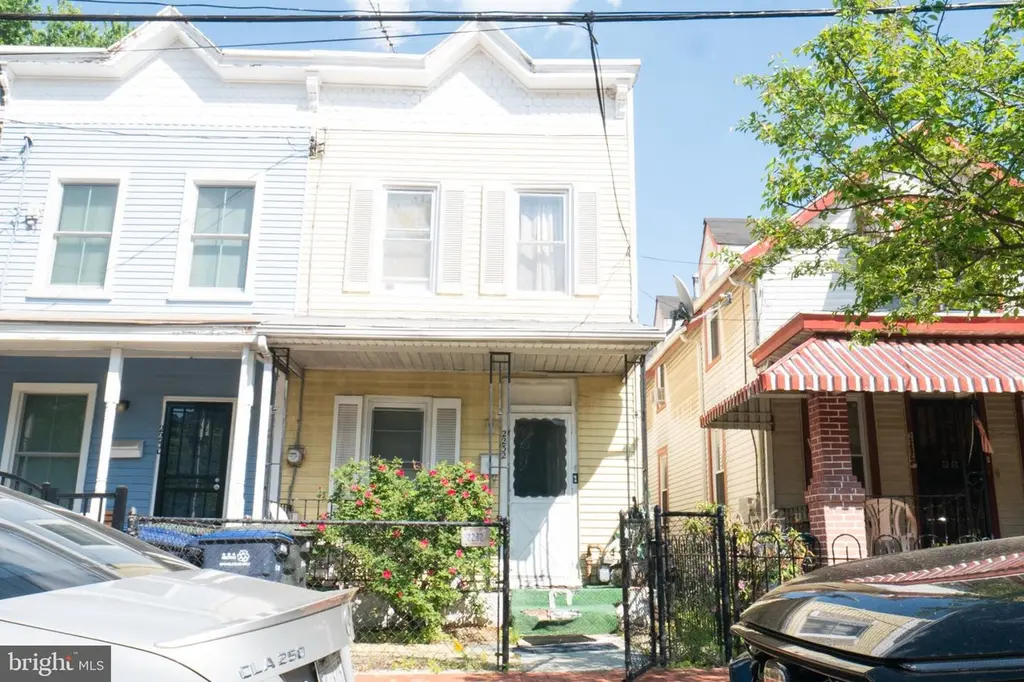
2232 Chester St SE · Washington, DC
Flood risk 6/10 · Moderate
- FEMA flood zone
- X (unshaded)
- Chance of flooding over 30 yrs
- 0.75%
- Est. flood insurance / yr
- $473 – $860
Fire risk 1/10 · Minimal
- Est. fire insurance / yr
- $631 – $1,173
Heat risk 7/10 · Major
- Hot days now (above 104°F)
- 7 days/yr
- Hot days in 30 yrs
- 15 days/yr
Wind risk 4/10 · Minor
- Chance of severe wind over 30 yrs
- 20.0%
Air-quality risk 4/10 · Minor
- Unhealthy air days now
- 4 days/yr
- Unhealthy air days in 30 yrs
- 5 days/yr
Risk factors via First Street. Map © Google.
Why this score? — see what drove the B grade
The composite is a weighted blend of 9 inputs, each scored 0–100. Each bar is that input's sub-score; the figure is the points it added to the 100-point composite (weight × sub-score).
- Cash flow +30.0/30.0
- 1% rule +10.0/10.0
- DSCR +10.0/10.0
- ARV discount +7.5/15.0
- Livability +3.7/5.0
- Schools +3.6/10.0
- Rent growth +3.5/5.0
- Condition / age +2.5/5.0
- Appreciation +0.0/10.0
$125,000
🖨 Deal sheet 📄 Offer letter ✓ Due diligence
Listing remarks
This property will be sold at ONLINE AUCTION. LIST PRICE REPRESENTS OPENING BID. This three-bedroom, one-bathroom offers a terrific opportunity for an investor or handy homeowner looking to build equity. Located in the Historic district of Anacostia’s bustling commercial corridor, this home has significant potential. Whether you’re looking to renovate and rent, flip, or hold as a long-term investment, this is your GEM. Just minutes from Anacostia Metro (Green Line) with easy access to downtown D. C. , Joint Base Anacostia-Bolling, The Wharf, Nationals Park, and National Harbor, this location is ideal for commuters and city dwellers alike. This property is being sold AS IS and pr
Key facts
- Historic district
- Growing area
- Built 1900
Tags
Property features AI
Finance
- Other: Fee simple ownership; Not in federal flood zone; Property condition listed as average to below average; Above-grade finished area per assessor
Exterior
- Parking: On-street parking
- Utilities: Public water; Public sewer; Electric available; Natural gas available; Cable internet available; Electric transformer on property
- Home design: End of row townhouse; 2 total levels; Building not winterized
- Construction: Wood siding exterior; Concrete perimeter foundation; Tar/gravel and metal roof; Wood-frame windows; Pets allowed with no restrictions; Year built per assessor
- Exterior features: Front yard; Private lot; Rear yard; Level entry at main
Interior
- Kitchen: Electric oven/range; Refrigerator
- Bedrooms: Three bedrooms on the upper level
- Flooring: Hardwood flooring
- Bathrooms: One full bathroom
- Heating & cooling: Baseboard hot water heating; Heat pump cooling (electric)
- Interior features: Carpeted areas; Formal separate dining room; Efficiency-style kitchen; Traditional floor plan; Drywall walls and ceilings; Insulated door(s); Not furnished
- Laundry & utility: Hot water: Electric
Neighborhood map
What this means for you Summary
Snapshot
- This is a 3-bed/1.0-bath townhouse listed at $125k.
Deal economics
- At list price, monthly cash flow is $1k ($17k/yr) — positive.
- The deal already cash-flows at list — no discount required.
- Meets the 1% rule at list price ($3k rent vs $125k).
- Cap rate 20.0% vs local median 2.5% in Washington — top-decile yield for the area; either an underpriced asset or a hidden risk that comps aren't pricing in. Stress-test before assuming the spread holds.
Location & tenants
- Location reads 73/100 on livability (#1 in DC) — a middle-class / working-renter tenant base. Strengths: amenities A+, commute A+, employment A+; Watch: crime F, cost of living F.
- District Of Columbia Public Schools (urban): math 33% / reading 40% proficiency, ranked #8 of 32 in DC (top 25%) — families likely to look elsewhere, expect single-tenant / working-renter base with shorter leases; 65% free/reduced lunch — lower-income household profile, screen leases tightly.
- Zoned schools: Savoy Es (238 students, 0% FRL); Kramer Ms (203 students, 0% FRL); Anacostia Hs (287 students, 0% FRL) — zoned schools average 0% FRL vs 65% district-wide (65 pts lower); this property's tenant base skews higher-income than the district average.
- Market conditions: Rents rising (+3.9%/yr); 296 active listings in the ZIP; 40 comparable units currently listed for rent nearby; rentals at typical pace (median 20d on market — plan ~3-4 weeks tenant-placement turnaround); 1,737 units permitted in District of Columbia in 2024 (1,506 in 5+ unit buildings).
- At $2,762/mo this rent would consume 61% of the median local household income ($54k/yr) (locally 5148% of renters already pay >50% of income on rent) — very limited rent-growth headroom before tenants either downsize or default.
Forward outlook
- Local home prices are declining (-3.0%/yr); year-one equity from $864 of loan paydown is wiped out by about $4k of value loss. Plan a longer hold.
- District of Columbia County population projected at +50% by 2050 — long-run rental-demand tailwind backs the buy-and-hold thesis.
- At projected returns (-3.0% appreciation + 3.9% rent growth), your $35k cash investment doubles in ~3 years — after that, you're playing with house money.
Negotiation context
- Only 13 days on market — expect competitive offers; lowballing is unlikely to land.
- Current owner paid $18k; list at $125k implies a 614% gain — meaningful room to come down on a strong offer.
Risks & watch-outs
- Watch-outs: built in 1900 — expect roof / HVAC / electrical / plumbing capex.
- Climate carrying-cost: major flood risk; extreme-heat days projected 7→15/yr by 2055 (HVAC capex compounding) — expect insurance premiums to compound above CPI over the hold.
Questions for the listing agent
- Built in 1900 — when were the roof, HVAC, electrical panel, plumbing, and water heater last replaced?
- Is there a deadline driving the sale (1031 exchange, divorce, estate, relocation)? That informs how much negotiation room exists.
- Crime grade is F in this area — have there been break-ins, vandalism, or insurance claims at this property in the last 3 years? What carrier currently insures it and at what premium?
- What's the average days-on-market for RENTAL listings here right now (not sales)? A rising rental-DOM trend means longer vacancies and softer asking-rent achievability than the comps imply.
- What's the recent tenant-quality profile in this submarket — average credit score on applications, eviction rate, late-payment / NSF rate, and stable-employment percentage? A property-management company in the area should have these aggregated.
- How much new for-sale + rental construction is in the pipeline within 1–3 miles? Heavy new supply typically softens prices + rents 12–24 months out; constrained supply supports both.
Investment metrics
- 1% rule
- 2.21% ✓
- Cap rate
- 20.01%
- Cash-on-cash
- 49.00%
- DSCR
- 3.18
- GRM
- 3.8
CMA / ARV
- ARV (on-the-fly)
- $337,326
- Comps found
- 12
Show comp detail 12 sales within ~0.75 mi
| Address | Dist | Beds/Ba | Sqft | Sold | Price | $/sf | Match |
|---|---|---|---|---|---|---|---|
| 1239 U St SE | 0.20mi | 3/2.5 | 1,280 (+2%) | 7mo | $360,000 | $281 | 76 |
| 1316 Dexter Ter SE | 0.25mi | 2/1.0 (-1) | 1,210 (-4%) | 3mo | $245,000 | $202 | 75 |
| 1385 Morris Rd SE | 0.22mi | 4/3.5 (+1) | 1,266 (+1%) | 10mo | $335,000 | $265 | 65 |
| 1430 W St SE | 0.12mi | 4/2.0 (+1) | 1,414 (+13%) | 3mo | $380,000 | $269 | 61 |
| 1830 T St SE | 0.56mi | 3/1.0 | 1,140 (-9%) | 1mo | $315,000 | $276 | 58 |
| 1439 Bangor St SE | 0.22mi | 2/1.0 (-1) | 1,080 (-14%) | 5mo | $273,000 | $253 | 57 |
| 1837 T St SE | 0.58mi | 2/2.0 (-1) | 1,305 (+4%) | 1mo | $415,000 | $318 | 56 |
| 1630 Ridge Pl SE | 0.49mi | 2/1.0 (-1) | 1,142 (-9%) | 1mo | $255,000 | $223 | 56 |
| 1917 T Pl SE | 0.57mi | 3/2.0 | 1,356 (+8%) | 0mo | $430,000 | $317 | 55 |
| 1748 Galen St SE | 0.40mi | 3/2.5 | 1,138 (-9%) | 6mo | $389,990 | $343 | 55 |
| 1902 T St SE | 0.60mi | 3/1.0 | 1,140 (-9%) | 8mo | $284,050 | $249 | 50 |
| 1409 18th St SE | 0.74mi | 3/1.0 | 1,152 (-8%) | 9mo | $285,000 | $247 | 44 |
Match score weights: distance 35% · size 25% · config 20% · recency 20%. Top-matched comps best support the ARV.
Projected returns pro-forma
-3.0% appreciation · 3.86% rent growth · sell at horizon
- IRR
- 47.5%
- Equity multiple
- 3.09×
- Total profit
- $73,157
- Equity at exit
- $18,638
- IRR
- 53.5%
- Equity multiple
- 6.45×
- Total profit
- $190,878
- Equity at exit
- $10,808
Cash invested: $35,000 (down + closing). Projections, not guarantees.
Landlord ↔ Tenant lean methodology
- Overall (CITY)
- 0 Strongly Tenant-Friendly
- State District of Columbia
- 12 Strongly Tenant-Friendly · D+43
- County
- — inherits STATE
- City Washington
- 0 Strongly Tenant-Friendly · D+43
ZIP-level market 20020
- Rents YoY
- 3.9%
- Active inventory
- 296
- Price-to-rent
- 3.8×
Monthly cashflow live
- Estimated rent
- $2,762 high interval (Pro) →
- Mortgage (P&I)
- −$656
- Tax from tax record
- −$46 /mo · $546/yr
- Insurance
- −$52
- HOA
- −$0
- Vacancy / Maint / Mgmt
- −$580
- Net cashflow
- $1,429
Break-even live
UW: 25.0% down · 7.5% · 30yr · 1.5% tax · 5.0% vac · 8.0% maint · 8.0% mgmt
Financing live
Cash to close
- Down payment
- $31,250
- Closing costs
- $3,750
- Reserves months
- —
- Total cash needed
- —
Loan-product check · same deal, 3 products live
Conventional
25% down · 7.5% · 30yr
- Down + closing
- —
- Monthly P&I
- —
- Monthly cashflow
- —
- DSCR
- —
- Eligible?
- —
Personal DTI + credit; lowest rate.
DSCR
20% down · 8.5% · 30yr
- Down + closing
- —
- Monthly P&I
- —
- Monthly cashflow
- —
- DSCR
- —
- Eligible?
- —
No personal income docs; deal must DSCR.
Hard money
10% down · 12.0% · 12mo
- Down + closing
- —
- Monthly P&I
- —
- Monthly cashflow
- —
- DSCR
- —
- Eligible?
- —
Short-term bridge; refi at stabilization.
Rent comps 40 comps
| Address | Beds | Baths | Sqft | Rent | $/sqft | DOM | Units | Dist |
|---|---|---|---|---|---|---|---|---|
| 2227 14th St SE Washington, DC | 3.0 | 1.0 | 1222 | $2,495 | $2.04 | 24d | 1 | 0.05mi |
| 1430 V St SE Washington, DC | 3.0 | 2.0 | 1680 | $3,100 | $1.85 | 24d | 1 | 0.15mi |
| 1214 U St SE Washington, DC | 3.0 | 2.5 | 1350 | $3,375 | $2.50 | 24d | 1 | 0.20mi |
| 1328 Morris Rd SE Washington, DC | 3.0 | 2.5 | 1372 | $3,250 | $2.37 | 17d | 1 | 0.20mi |
| 1351 Morris Rd SE Unit Upstairs Washington, DC | 3.0 | 2.0 | 1522 | $2,700 | $1.77 | 4d | 1 | 0.23mi |
| 1308 Talbert Ct SE Washington, DC | 3.0 | 2.5 | 1446 | $2,995 | $2.07 | 5d | 1 | 0.25mi |
| 1516 Marion Barry Ave SE Unit 301 Washington, DC | 3.0 | 2.0 | 1100 | $1,795 | $1.63 | 7d | 1 | 0.27mi |
| 1300 Dexter Ter SE Washington, DC | 2.0 | 1.5 | 1100 | $2,600 | $2.36 | 24d | 1 | 0.27mi |
| 1802 14th St SE Washington, DC | 3.0 | 2.0 | 1800 | $2,800 | $1.56 | 24d | 1 | 0.30mi |
| 2322 Shannon Pl SE Washington, DC | 3.0 | 3.5 | 1800 | $2,800 | $1.56 | 24d | 1 | 0.30mi |
| 2648 Bowen Rd SE Washington, DC | 3.0 | 1.5 | 1220 | $2,500 | $2.05 | 24d | 1 | 0.36mi |
| 1705 W St SE Washington, DC | 4.0 | 2.0 | 1550 | $2,500 | $1.61 | 2d | 1 | 0.38mi |
| 2501 Sayles Pl SE #9 Washington, DC | 2.0 | 2.0 | 1157 | $2,500 | $2.16 | 24d | 1 | 0.40mi |
| 2501 Sayles Pl SE #9 Washington, DC | 2.0 | 2.0 | 1157 | $2,500 | $2.16 | 10d | 1 | 0.40mi |
| 1750 Galen St SE Washington, DC | 3.0 | 3.0 | 1138 | $2,300 | $2.02 | 3d | 1 | 0.41mi |
| 1527 Morris Rd SE Washington, DC | 3.0 | 2.5 | 1508 | $2,700 | $1.79 | 7d | 1 | 0.42mi |
| 1634 Ridge Pl SE Washington, DC | 3.0 | 3.5 | 1248 | $3,200 | $2.56 | 24d | 1 | 0.47mi |
| 2629 Douglass Rd SE Washington, DC | 2.0–3.0 | 1.0–1.5 | 888 | $2,245 | $2.53 | 1d | 13 | 0.50mi |
| 1953 19th Pl SE Apt 301 Washington, DC | 3.0 | 1.0 | 980 | $5,301 | $5.41 | 24d | 1 | 0.51mi |
| 1953 19th Pl SE Apt 104 Washington, DC | 3.0 | 1.0 | 980 | $2,800 | $2.86 | 5d | 1 | 0.51mi |
| 1907 Marion Barry Ave SE Washington, DC | 2.0 | 1.0 | 900 | $1,495 | $1.66 | 24d | 1 | 0.54mi |
| 2609 Douglass Rd SE #402 Washington, DC | 2.0 | 2.0 | 990 | $2,200 | $2.22 | 24d | 1 | 0.57mi |
| 2202 U Pl SE Washington, DC | 2.0 | 1.5 | 1232 | $3,500 | $2.84 | 24d | 1 | 0.62mi |
| 2460 James Bank Rd SE Washington, DC | 3.0 | 3.5 | 1687 | $3,190 | $1.89 | 14d | 1 | 0.63mi |
| 1938 S St SE Washington, DC | 3.0 | 2.0 | 1522 | $2,999 | $1.97 | 24d | 1 | 0.68mi |
| 650 Howard Rd SE Washington, DC | 3.0 | 1.0–2.0 | 852 | $4,431 | $5.20 | 1d | 53 | 0.69mi |
| 2300 Good Hope Rd SE Washington, DC | 2.0 | 1.0–2.0 | 1020 | $1,913 | $1.88 | 24d | 6 | 0.70mi |
| 632 Howard Rd SE Unit 933 Washington, DC | 2.0 | 2.0 | 942 | $3,862 | $4.10 | 21d | 1 | 0.75mi |
| 632 Howard Rd SE Unit 338 Washington, DC | 2.0 | 2.0 | 926 | $3,862 | $4.17 | 16d | 1 | 0.75mi |
| 632 Howard Rd SE Unit 532 Washington, DC | 2.0 | 2.0 | 942 | $3,862 | $4.10 | 17d | 1 | 0.75mi |
| 632 Howard Rd SE Washington, DC | 2.0 | 1.0–2.0 | 673 | $4,100 | $6.09 | 20d | 112 | 0.75mi |
| 632 Howard Rd SE Unit 633 Washington, DC | 2.0 | 2.0 | 942 | $3,862 | $4.10 | 19d | 1 | 0.75mi |
| 600 Howard Rd SE Washington, DC | 2.0 | 1.0–2.5 | 805 | $6,344 | $7.88 | 1d | 89 | 0.75mi |
| 1955 Fairlawn Ave SE Unit 2A Washington, DC | 2.0 | 2.0 | 1000 | $2,499 | $2.50 | 24d | 1 | 0.86mi |
| 2215 Minnesota Ave SE Unit 18 Washington, DC | 4.0 | 2.0 | 990 | $4,500 | $4.55 | 24d | 1 | 0.87mi |
| 2003 Fairlawn Ave SE Washington, DC | 4.0 | 2.0 | 1500 | $5,800 | $3.87 | 2d | 1 | 0.87mi |
| 2562 Naylor Rd SE Washington, DC | 1.0–2.0 | 1.0 | 790 | $2,075 | $2.63 | 2d | 21 | 0.96mi |
| 2515 R St SE Washington, DC | 1.0–2.0 | 1.0 | 812 | $1,755 | $2.16 | 5d | 2 | 0.98mi |
| 1346 4th St SE Washington, DC | 2.0 | 1.0–2.0 | 864 | $4,280 | $4.95 | 1d | 25 | 0.99mi |
| 1300 4th St SE Washington, DC | 1.0–2.0 | 1.0–2.0 | 854 | $3,950 | $4.63 | 19d | 4 | 1.01mi |
Listing history 17 events
-
2026-06-18days on market $125,000 Active 13 DOM
-
2026-06-17days on market $125,000 Active 12 DOM
-
2026-06-16days on market $125,000 Active 11 DOM
-
2026-06-15days on market $125,000 Active 10 DOM
-
2026-06-13days on market $125,000 Active 8 DOM
-
2026-06-09days on market $125,000 Active 4 DOM
-
2026-06-08days on market $125,000 Active 3 DOM
-
2026-06-07remarks 687-char remark
-
2026-06-07pricedays on market $125,000 Active 2 DOM
-
2026-06-04days on market $300,000 Active 54 DOM
-
2026-06-03days on market $300,000 Active 53 DOM
-
2026-06-02days on market $300,000 Active 52 DOM
-
2026-06-01days on market $300,000 Active 51 DOM
-
2026-05-31days on market $300,000 Active 50 DOM
-
2026-04-12$300,000 Active
-
2026-04-11historical $300,000
-
1978-07-12soldstatus $17,500
ⓘ Source: listings_history table (triggers on properties + properties_extension) + one-shot
backfill from property_details.listing_events for pre-trigger history.
Tax reassessment forecast DC · Partial reset (capped growth)
- Current annual tax
- $546 · $46/mo
- Projected year-2 tax
- $654 · $55/mo
- Expected delta
- +$108/yr (+$9/mo · 19.8%)
ⓘ Screening estimate from a state-policy table — verify with the county assessor before closing.
Climate risk First Street
- Flood 6/10 Major FEMA zone X (unshaded) · 75% chance over 30 yrs
- Wildfire 1/10 Low
- Heat 7/10 Severe 7 d/yr ≥104°F today · 15 d/yr by 30 yrs out
- Wind 4/10 Moderate 20% chance of damaging wind over 30 yrs
- Air quality 4/10 Moderate 4 unhealthy d/yr today · 5 by 30 yrs out
Nearby sold comps map
Loading sold comps map…
Walkable amenities ~0.75 mi
Loading nearby amenities…
Taxation est. · year 1
- Rental income
- $33,150
- − Mortgage interest
- −$7,002
- − Property taxes
- −$546
- − Insurance
- −$625
- − Repairs & maintenance
- −$2,652
- − Management
- −$2,652
- − Depreciation
- −$3,636
- Taxable income
- $16,036
- Est. tax owed @ 24.0%
- −$3,849
- After-tax cash flow
- $13,302/yr
For passive investors: Depreciation is non-cash, so a rental often shows a tax loss while cash-flowing — sheltering income. Rental losses are passive: they offset passive income freely, and up to $25,000/yr can offset ordinary (W-2) income if you actively participate and your MAGI is under $100k (phasing out to $0 by $150k); unused losses carry forward. On sale, claimed depreciation is recaptured at up to 25%, and gains may owe capital-gains tax (a 1031 exchange can defer both). Figures are a year-1 estimate at your 24.0% rate — not tax advice; consult a CPA.
Schools (NCES district)
- District
- District Of Columbia Public Schools
- NCES district ID
- 1100030
- Math proficiency
- 33% ▲ 3.00%
- Reading proficiency
- 40% ▲ 5.00%
- Median HH income
- $67,671
- Composite
- 35.84/100
- National rank
- #9606
- State rank
- #8 of 32 in DC
Livability — Washington
- Score
- 73/100
- State rank
- #1
- US rank
- #5327
Category grades
Schools grade is shown separately in the Schools card above.
Census & demographics
- Census place
- Washington, DC
- County
- District of Columbia · 671,873 people
- City population
- 671,873
- Metro
- Washington-Arlington-Alexandria, DC-VA-MD-WV
- Population (ZIP)
- 53,005
- Household income
- $54,032
- Rent vs Own
- Severe rent burden
- 5148.0
Population outlook (District of Columbia County) Hauer SSP2
- Today (2025)
- 821,926 people
- By 2030
- 899,517 · +9.4%
- By 2040
- 1,061,162 · +29.1%
- By 2050
- 1,231,493 · +49.8%
- By 2075
- 1,603,312 · +95.1%
- By 2100
- 1,847,141 · +124.7%
Race, ethnicity, and origin ACS 2023
- Neighborhood character
- Predominantly Black (90%)
- Race & ethnicity
- Black 90% Two or more races 3% Hispanic / Latino 3% White 3%
- Common ancestry
- Lithuanian 1%
- Foreign-born
- 3% · Canada
- Languages at home
- 95% English-only · Spanish 2% French/Haitian/Cajun 1%
Political lean MEDSL · District of Columbia
- 2024 margin
- Solid D (+86.1) · D 91.2% · R 5.1% · Other 3.8%
- 2008→2024 swing
- +0.1pp no change · 2008: 85.9pp · 2024: 86.1pp
- All cycles
- 2024: D+86.1 2020: D+86.8 2016: D+88.7 2012: D+84.2 2008: D+85.9
Not yet ingested
- Civics
- —
Market trends
- HPI YoY
- ▼ -415.44%
- Current HPI
- 306.5068
- Rent YoY
- ▲ 3.86%
- Metro
- Washington-Arlington-Alexandria, DC-VA-MD-WV
- State GDP YoY
- ▲ 1.33%
- F500 in state
- 6
Industry mix (Fortune 500 HQ in DC)
| Industry | F500 HQs | Revenue |
|---|---|---|
| Financial Services | 1 | $153B |
|
||
| Life Sciences / Industrials | 1 | $25B |
|
||
| Industrial Machinery | 1 | $8B |
|
||
Price history
+1614.3% since first listed3 events — show timeline
- 2026-04-12 Listed $300,000 BRIGHT MLS
- 2026-04-11 Coming Soon $300,000 BRIGHT MLS
- 1978-07-12 Sold (Public Records) $17,500 Public Records
Property tax history
-3.6%/yrLatest (2025): $546 · +3.3% YoY. Source: county tax records.
Cash-flow waterfall
monthlySold comps — $/sqft
last 12 mo · ≤1 miLoading sold comps…