335 Byrd St · Hopewell, VA
Flood risk 1/10 · Minimal
- FEMA flood zone
- X (unshaded)
- Chance of flooding over 30 yrs
- 0.0%
- Est. flood insurance / yr
- $507 – $1,088
Fire risk 3/10 · Minor
- Est. fire insurance / yr
- $666 – $1,236
Heat risk 7/10 · Major
- Hot days now (above 110°F)
- 7 days/yr
- Hot days in 30 yrs
- 16 days/yr
Wind risk 6/10 · Moderate
- Chance of severe wind over 30 yrs
- 42.0%
Air-quality risk 2/10 · Minimal
- Unhealthy air days now
- 1 days/yr
- Unhealthy air days in 30 yrs
- 2 days/yr
Risk factors via First Street. Map © Google.
Why this score? — see what drove the B+ grade
The composite is a weighted blend of 9 inputs, each scored 0–100. Each bar is that input's sub-score; the figure is the points it added to the 100-point composite (weight × sub-score).
- Cash flow +30.0/30.0
- ARV discount +15.0/15.0
- 1% rule +10.0/10.0
- DSCR +10.0/10.0
- Rent growth +4.7/5.0
- Livability +3.5/5.0
- Schools +3.0/10.0
- Condition / age +2.5/5.0
- Appreciation +0.0/10.0
$100,000
🖨 Deal sheet 📄 Offer letter ✓ Due diligence
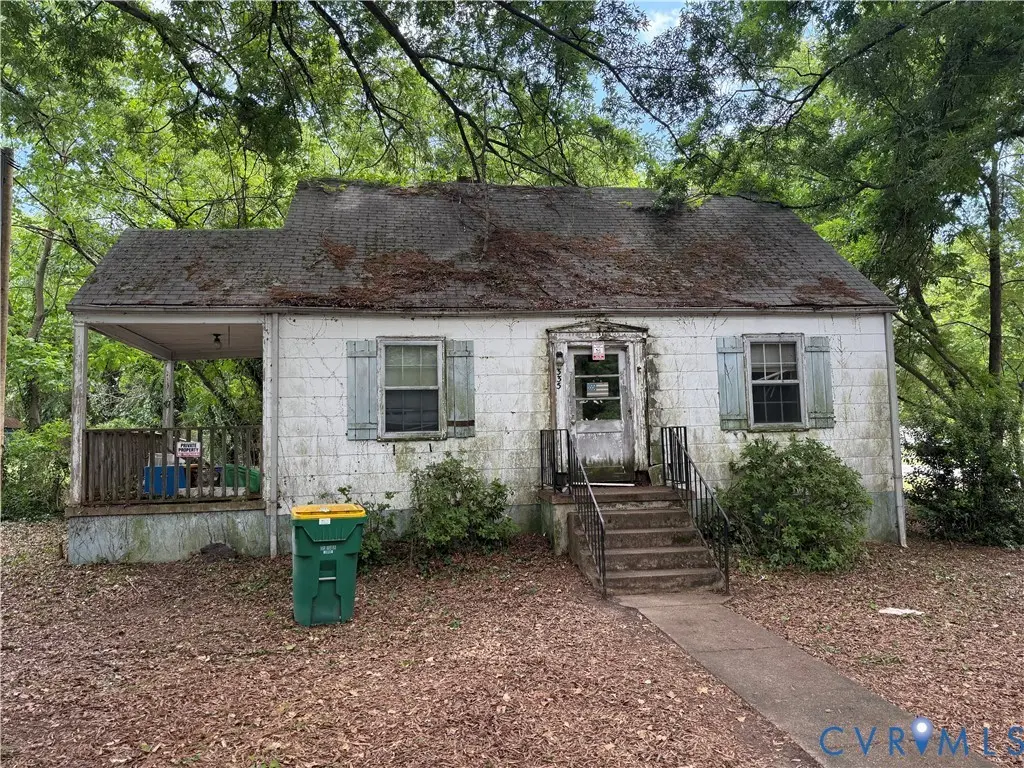
Listing remarks
Come take on the latest restoration project available in Hopewell. 335 Byrd Street is a cape cod style home- located on a corner lot- with "good bones" and an additional detached 1-car garage. The property has 1,209 sq. ft. of living space, 3 bedrooms and 1 full bath with the ability to convert the upstairs bedroom into a suite. Byrd St. has original hardwood flooring and an additional covered side porch. Property is being sold AS IS. No assignable contracts will be accepted. Property will not qualify for traditional financing.
Key facts
- 8,520 sq ft lot
- Garage
- Built 1949
Property features AI
Exterior
- Parking: Detached garage; Off-street parking; On-street parking; 1 garage space
- Utilities: Public water; Public sewer
- Home design: Single-story property; Resale condition; R2 zoning
- Construction: Built with frame, drywall and asbestos materials; Asphalt shingle roof
- Exterior features: Porch; Deck; Side porch; Corner lot
Interior
- Kitchen: Kitchen on the first level
- Bedrooms: One bedroom on the second level; One bedroom on the first level
- Flooring: Linoleum; Wood
- Bathrooms: One full bathroom with tub and shower
- Heating & cooling: Electric heating; Floor furnace; Window air conditioning units
- Interior features: Bedroom on main level; Crawl space basement
- Laundry & utility: Electric water heater
Neighborhood map
What this means for you Summary
Snapshot
- This is a 3-bed/1.0-bath single-family listed at $100k.
Deal economics
- At list price, monthly cash flow is $383 ($5k/yr) — positive.
- The deal already cash-flows at list — no discount required.
- Meets the 1% rule at list price ($2k rent vs $100k).
- Cap rate 10.9% vs local median 4.2% in Hopewell — top-decile yield for the area; either an underpriced asset or a hidden risk that comps aren't pricing in. Stress-test before assuming the spread holds.
Location & tenants
- Location reads 70/100 on livability (#224 in VA) — a middle-class / working-renter tenant base. Strengths: cost of living A+, health & safety A+, schools A-; Watch: crime D+, amenities F, commute F.
- Hopewell City Public School District (suburban): math 23% / reading 49% proficiency, ranked #129 of 131 in VA (top 98%) — families likely to look elsewhere, expect single-tenant / working-renter base with shorter leases; 68% free/reduced lunch — lower-income household profile, screen leases tightly.
- Market conditions: Rents rising fast (+8.9%/yr); 228 active listings in the ZIP; 21 comparable units currently listed for rent nearby; rentals at typical pace (median 16d on market — plan ~3-4 weeks tenant-placement turnaround); 42 units permitted in Hopewell city in 2024 (0 in 5+ unit buildings).
Forward outlook
- Local home prices are declining (-3.0%/yr); year-one equity from $691 of loan paydown is wiped out by about $3k of value loss. Plan a longer hold.
- Hopewell County population projected to shrink 7% by 2050 — rents likely to lag national; underwrite the cash flow, not the appreciation.
- At projected returns (-3.0% appreciation + 8.0% rent growth), your $28k cash investment doubles in ~6 years — after that, you're playing with house money.
Negotiation context
- Only 2 days on market — expect competitive offers; lowballing is unlikely to land.
Risks & watch-outs
- Watch-outs: property tax is 2.9% of price; built in 1949 — expect roof / HVAC / electrical / plumbing capex.
- Climate carrying-cost: major wind risk, 42% chance of damaging wind over 30y; extreme-heat days projected 7→16/yr by 2055 (HVAC capex compounding) — expect insurance premiums to compound above CPI over the hold.
Questions for the listing agent
- Built in 1949 — when were the roof, HVAC, electrical panel, plumbing, and water heater last replaced?
- Property tax is high relative to price — has the assessment been appealed recently, and will the sale trigger a re-assessment?
- Is there a deadline driving the sale (1031 exchange, divorce, estate, relocation)? That informs how much negotiation room exists.
- Schools are A-rated — typically a magnet for longer-tenancy family renters. What's the average tenant stay here, and is there a school-zone premium baked into asking?
- Crime grade is D in this area — have there been break-ins, vandalism, or insurance claims at this property in the last 3 years? What carrier currently insures it and at what premium?
- What's the average days-on-market for RENTAL listings here right now (not sales)? A rising rental-DOM trend means longer vacancies and softer asking-rent achievability than the comps imply.
- What's the recent tenant-quality profile in this submarket — average credit score on applications, eviction rate, late-payment / NSF rate, and stable-employment percentage? A property-management company in the area should have these aggregated.
- How much new for-sale + rental construction is in the pipeline within 1–3 miles? Heavy new supply typically softens prices + rents 12–24 months out; constrained supply supports both.
Investment metrics
- 1% rule
- 1.50% ✓
- Cap rate
- 10.89%
- Cash-on-cash
- 16.42%
- DSCR
- 1.73
- GRM
- 5.5
CMA / ARV
- ARV (median comp)
- $190,374
- List price
- $100,000
- Delta
- -47.47%
- Verdict
- UNDERPRICED
- Comps
- 20 within 1.0 mi
Show comp detail 12 sales within ~0.75 mi
| Address | Dist | Beds/Ba | Sqft | Sold | Price | $/sf | Match |
|---|---|---|---|---|---|---|---|
| 335 Byrd St | 0.00mi | 3/1.0 | 1,209 (0%) | 0mo | $150,000 | $124 | 100 |
| 2107 Day St | 0.30mi | 3/2.0 | 1,304 (+8%) | 3mo | $259,000 | $199 | 66 |
| 301 Memorial Ave | 0.46mi | 3/2.0 | 1,151 (-5%) | 2mo | $135,000 | $117 | 65 |
| 200 Mohawk Ave | 0.66mi | 4/1.0 (+1) | 1,203 (-0%) | 2mo | $235,000 | $195 | 62 |
| 311 N 5th Ave | 0.64mi | 3/1.5 | 1,158 (-4%) | 2mo | $220,000 | $190 | 60 |
| 2211 Johnson St | 0.58mi | 3/1.0 | 1,132 (-6%) | 3mo | $210,000 | $186 | 60 |
| 317 S 19th Ave | 0.70mi | 3/2.0 | 1,260 (+4%) | 1mo | $299,999 | $238 | 56 |
| 309 S 17th Ave | 0.66mi | 3/2.0 | 1,278 (+6%) | 2mo | $263,000 | $206 | 54 |
| 306 N 4th Ave | 0.67mi | 3/1.0 | 1,089 (-10%) | 0mo | $152,200 | $140 | 52 |
| 322 Maryland Ave | 0.70mi | 3/2.0 | 1,316 (+9%) | 1mo | $305,000 | $232 | 48 |
| 126 S 11th Ave | 0.54mi | 3/1.0 | 1,029 (-15%) | 3mo | $159,000 | $155 | 48 |
| 320 Maryland Ave | 0.70mi | 3/2.0 | 1,316 (+9%) | 2mo | $302,400 | $230 | 47 |
Match score weights: distance 35% · size 25% · config 20% · recency 20%. Top-matched comps best support the ARV.
Projected returns pro-forma
-3.0% appreciation · 8.0% rent growth · sell at horizon
- IRR
- 13.6%
- Equity multiple
- 1.58×
- Total profit
- $16,237
- Equity at exit
- $14,910
- IRR
- 26.3%
- Equity multiple
- 3.93×
- Total profit
- $82,094
- Equity at exit
- $8,646
Cash invested: $28,000 (down + closing). Projections, not guarantees.
Landlord ↔ Tenant lean methodology
- Overall (STATE)
- 55 Moderately Landlord-Leaning
- State Virginia
- 55 Moderately Landlord-Leaning · D+2
- County
- — inherits STATE
- City
- — inherits STATE
ZIP-level market 23860
- Home prices YoY
- -22.0%
- Rents YoY
- 8.9%
- Active inventory
- 228
- Price-to-rent
- 5.5×
Monthly cashflow live
- Estimated rent
- $1,503 high interval (Pro) →
- Mortgage (P&I)
- −$524
- Tax from tax record
- −$238 /mo · $2,859/yr
- Insurance
- −$42
- HOA
- −$0
- Vacancy / Maint / Mgmt
- −$316
- Net cashflow
- $383
Break-even live
UW: 25.0% down · 7.5% · 30yr · 1.5% tax · 5.0% vac · 8.0% maint · 8.0% mgmt
Financing live
Cash to close
- Down payment
- $25,000
- Closing costs
- $3,000
- Reserves months
- —
- Total cash needed
- —
Loan-product check · same deal, 3 products live
Conventional
25% down · 7.5% · 30yr
- Down + closing
- —
- Monthly P&I
- —
- Monthly cashflow
- —
- DSCR
- —
- Eligible?
- —
Personal DTI + credit; lowest rate.
DSCR
20% down · 8.5% · 30yr
- Down + closing
- —
- Monthly P&I
- —
- Monthly cashflow
- —
- DSCR
- —
- Eligible?
- —
No personal income docs; deal must DSCR.
Hard money
10% down · 12.0% · 12mo
- Down + closing
- —
- Monthly P&I
- —
- Monthly cashflow
- —
- DSCR
- —
- Eligible?
- —
Short-term bridge; refi at stabilization.
Rent comps 21 comps
| Address | Beds | Baths | Sqft | Rent | $/sqft | DOM | Units | Dist |
|---|---|---|---|---|---|---|---|---|
| 310 Woodbine St Hopewell, VA | 1.0–3.0 | 1.0–1.5 | 800 | $1,534 | $1.92 | 1d | 3 | 0.18mi |
| 1208 W Broadway Hopewell, VA | 3.0 | 1.0 | 1200 | $1,495 | $1.25 | 16d | 1 | 0.29mi |
| 2009 Day St Hopewell, VA | 2.0 | 1.0 | 780 | $895 | $1.15 | 23d | 1 | 0.34mi |
| 1201 W City Point Rd Hopewell, VA | 1.0–2.0 | 1.0–1.5 | 711 | $1,250 | $1.76 | 1d | 7 | 0.39mi |
| 1201 W City Point Rd Hopewell, VA | 1.0–2.0 | 1.0–1.5 | 710 | $1,250 | $1.76 | 14d | 3 | 0.40mi |
| 508 N 7th Ave Hopewell, VA | 4.0 | 1.0 | 1183 | $1,599 | $1.35 | 1d | 1 | 0.49mi |
| 404 N 4th Ave Hopewell, VA | 3.0 | 1.0 | 1132 | $1,495 | $1.32 | 43d | 1 | 0.64mi |
| 305 S 9th Ave Hopewell, VA | 4.0 | 1.0 | 1056 | $1,599 | $1.51 | 3d | 1 | 0.70mi |
| 101 S Main St Unit 1 Hopewell, VA | 2.0 | 2.0 | 800 | $1,395 | $1.74 | 4d | 1 | 0.91mi |
| 221 S Mesa Dr Hopewell, VA | 3.0 | 1.0 | 1152 | $1,300 | $1.13 | 23d | 1 | 0.94mi |
| 800 Chestnut St Hopewell, VA | 2.0 | 1.0 | 884 | $1,395 | $1.58 | 43d | 1 | 0.96mi |
| 460 Highland Ave Hopewell, VA | 3.0 | 1.0 | 1212 | $1,700 | $1.40 | 19d | 1 | 0.98mi |
| 552 S 22nd Ave Hopewell, VA | 3.0 | 2.0 | 1368 | $1,800 | $1.32 | 23d | 1 | 1.00mi |
| 522 S 22nd Ave Hopewell, VA | 3.0 | 2.0 | 1368 | $1,800 | $1.32 | 23d | 1 | 1.01mi |
| 311 E Cawson St Hopewell, VA | 2.0–3.0 | 1.0 | 978 | $2,154 | $2.20 | 1d | 9 | 1.02mi |
| 507 Hill Ave Hopewell, VA | 3.0 | 1.0 | 932 | $1,395 | $1.50 | 23d | 1 | 1.07mi |
| 2305 Poplar St Unit B Hopewell, VA | 2.0 | 1.5 | 959 | $1,050 | $1.09 | 23d | 1 | 1.15mi |
| 600 Winston Churchill Dr Hopewell, VA | 2.0 | 1.0 | 900 | $1,075 | $1.19 | 1d | 1 | 1.23mi |
| 525 E Cawson St Hopewell, VA | 4.0 | 2.0 | 1411 | $1,791 | $1.27 | 10d | 1 | 1.24mi |
| 2303 Maclin Cir Hopewell, VA | 3.0 | 2.0 | 1150 | $1,499 | $1.30 | 3d | 1 | 1.37mi |
| 15219 Spruce Ave Chester, VA | 3.0 | 1.5 | 1052 | $1,991 | $1.89 | 23d | 1 | 1.47mi |
Listing history 3 events
-
2026-05-14historical $100,000 556-char remark
-
1999-04-02soldstatus $61,500
-
1992-12-29soldstatus $46,500
ⓘ Source: listings_history table (triggers on properties + properties_extension) + one-shot
backfill from property_details.listing_events for pre-trigger history.
Tax reassessment forecast VA · Resets to sale price
- Current annual tax
- $2,859 · $238/mo
- Projected year-2 tax
- $2,859 · $238/mo
- Expected delta
- $0/yr ($0/mo · 0.0%)
ⓘ Screening estimate from a state-policy table — verify with the county assessor before closing.
Climate risk First Street
- Flood 1/10 Low FEMA zone X (unshaded) · 0% chance over 30 yrs
- Wildfire 3/10 Moderate
- Heat 7/10 Severe 7 d/yr ≥110°F today · 16 d/yr by 30 yrs out
- Wind 6/10 Major 42% chance of damaging wind over 30 yrs
- Air quality 2/10 Low 1 unhealthy d/yr today · 2 by 30 yrs out
Nearby sold comps map
Loading sold comps map…
Walkable amenities ~0.75 mi
Loading nearby amenities…
Taxation est. · year 1
- Rental income
- $18,038
- − Mortgage interest
- −$5,602
- − Property taxes
- −$2,859
- − Insurance
- −$500
- − Repairs & maintenance
- −$1,443
- − Management
- −$1,443
- − Depreciation
- −$2,909
- Taxable income
- $3,282
- Est. tax owed @ 24.0%
- −$788
- After-tax cash flow
- $3,810/yr
For passive investors: Depreciation is non-cash, so a rental often shows a tax loss while cash-flowing — sheltering income. Rental losses are passive: they offset passive income freely, and up to $25,000/yr can offset ordinary (W-2) income if you actively participate and your MAGI is under $100k (phasing out to $0 by $150k); unused losses carry forward. On sale, claimed depreciation is recaptured at up to 25%, and gains may owe capital-gains tax (a 1031 exchange can defer both). Figures are a year-1 estimate at your 24.0% rate — not tax advice; consult a CPA.
Schools (NCES district)
- District
- Hopewell City Public School District
- NCES district ID
- 5101980
- Math proficiency
- 23% ▼ -54.00%
- Reading proficiency
- 49% ▼ -18.00%
- Median HH income
- $38,234
- Composite
- 29.95/100
- National rank
- #6377
- State rank
- #129 of 131 in VA
Livability — Hopewell
- Score
- 70/100
- State rank
- #224
- US rank
- #7437
Category grades
Schools grade is shown separately in the Schools card above.
Census & demographics
- Census place
- Hopewell, VA
- County
- Hopewell City · 31,404 people
- City population
- 31,404
- Metro
- Richmond, VA
- Population (ZIP)
- 31,404
- Household income
- $62,141
- Rent vs Own
- Severe rent burden
- 1055.0
Population outlook (Hopewell County) Hauer SSP2
- Today (2025)
- 21,776 people
- By 2030
- 21,457 · -1.5%
- By 2040
- 20,882 · -4.1%
- By 2050
- 20,239 · -7.1%
- By 2075
- 18,905 · -13.2%
- By 2100
- 16,949 · -22.2%
Race, ethnicity, and origin ACS 2023
- Neighborhood character
- Diverse neighborhood (Simpson 0.64)
- Race & ethnicity
- White 43% Black 42% Two or more races 9% Hispanic / Latino 8% Asian 1%
- Hispanic origin (detail)
- Mexican 2% Puerto Rican 2%
- Common ancestry
- Slovak 1% Romanian 1% Serbian 1%
- Foreign-born
- 3% · Canada
- Languages at home
- 94% English-only · Spanish 4% German/W. Germanic 1%
Political lean MEDSL · Hopewell
- 2024 margin
- D (+13.8) · D 56.4% · R 42.6% · Other 1.0%
- 2008→2024 swing
- +1.8pp toward D · 2008: 11.9pp · 2024: 13.8pp
- All cycles
- 2024: D+13.8 2020: D+14.7 2016: D+9.3 2012: D+16.0 2008: D+11.9
Not yet ingested
- Civics
- —
Market trends
- HPI YoY
- ▼ -85.28%
- Current HPI
- 302.6343
- Rent YoY
- ▲ 8.86%
- Metro
- Richmond, VA
- State GDP YoY
- ▲ 2.40%
- F500 in state
- 50
Industry mix (Fortune 500 HQ in VA)
| Industry | F500 HQs | Revenue |
|---|---|---|
| Aerospace / Defense | 4 | $236B |
|
||
| Technology / Defense | 3 | $32B |
|
||
| Financial Services | 2 | $176B |
|
||
| Utilities | 2 | $27B |
|
||
| Insurance | 2 | $25B |
|
||
| Technology | 2 | $15B |
|
||
Price history
+222.6% since first listed6 events — show timeline
- 2026-06-05 Sold (MLS) $150,000 CVRMLS
- 2026-05-21 Pending — CVRMLS
- 2026-05-19 Listed $100,000 CVRMLS
- 2026-05-14 Coming Soon $100,000 CVRMLS
- 1999-04-02 Sold (Public Records) $61,500 Public Records
- 1992-12-29 Sold (Public Records) $46,500 Public Records
Property tax history
+11.6%/yrLatest (2024): $2,859 · +244.7% YoY. Source: county tax records.
Cash-flow waterfall
monthlySold comps — $/sqft
last 12 mo · ≤1 miLoading sold comps…