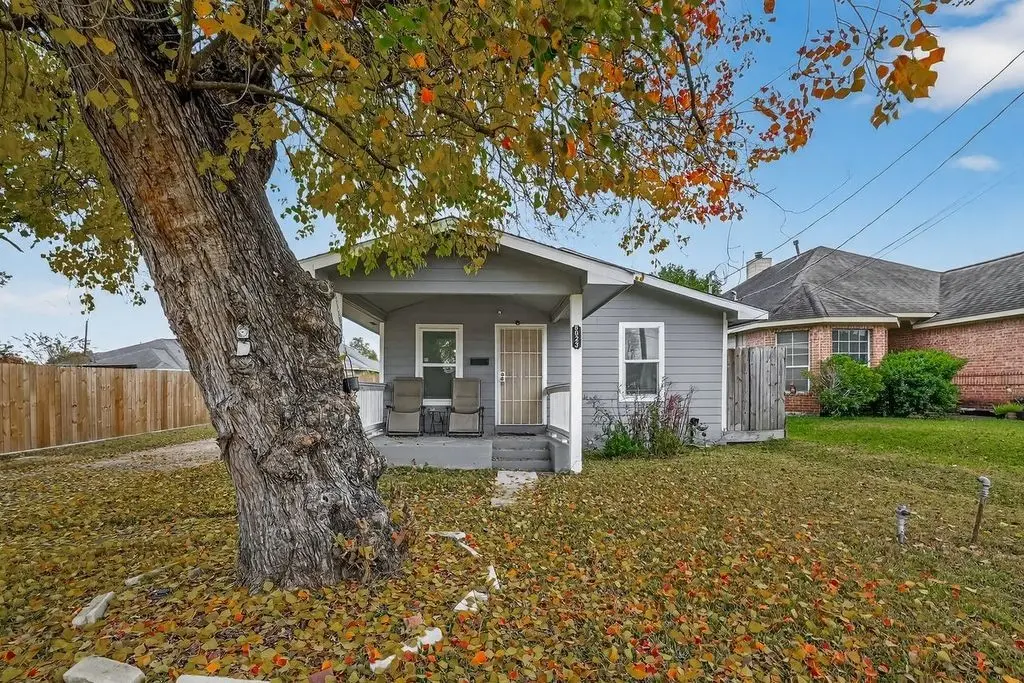
8023 Fountain St · Houston, TX
Flood risk 6/10 · Moderate
- FEMA flood zone
- X (unshaded)
- Chance of flooding over 30 yrs
- 0.74%
- Est. flood insurance / yr
- $507 – $1,088
Fire risk 2/10 · Minimal
- Est. fire insurance / yr
- $1,222 – $2,270
Heat risk 9/10 · Severe
- Hot days now (above 109°F)
- 7 days/yr
- Hot days in 30 yrs
- 24 days/yr
Wind risk 9/10 · Severe
- Chance of severe wind over 30 yrs
- 99.0%
Air-quality risk 2/10 · Minimal
- Unhealthy air days now
- 2 days/yr
- Unhealthy air days in 30 yrs
- 2 days/yr
Risk factors via First Street. Map © Google.
Why this score? — see what drove the D grade
The composite is a weighted blend of 9 inputs, each scored 0–100. Each bar is that input's sub-score; the figure is the points it added to the 100-point composite (weight × sub-score).
- Cash flow +13.0/30.0
- Appreciation +10.0/10.0
- 1% rule +4.2/10.0
- DSCR +3.9/10.0
- Rent growth +3.7/5.0
- Livability +3.7/5.0
- Schools +2.7/10.0
- Condition / age +2.5/5.0
- ARV discount +0.0/15.0
$195,000
🖨 Deal sheet (PDF) 📄 Offer letter ✓ Due diligence
Listing remarks MLS
This 3-bedroom, 2-bath home features an open-concept layout that’s perfect for entertaining. Enjoy beautifully tiled bathrooms and a modern kitchen with vinyl plank flooring that flows throughout the main living areas. The bedrooms offer comfortable carpeting for added warmth. Relax on the cozy front porch or take advantage of the large, fenced-in backyard complete with a storage shed—ideal for outdoor living and extra storage.
Key facts
- Tiled bathrooms
- Modern kitchen
- Vinyl plank flooring
Tags
Neighborhood map
What this means for you Summary
Snapshot
- This is a 3-bed/2.0-bath single-family listed at $195k.
Deal economics
- At list price, monthly cash flow is $-12 ($-139/yr) — negative.
- To cash-flow at today's rent, offer at most $193k (1.0% below list).
- To meet the 1% rule (rent ≥ 1% of price), the offer needs to be $179k (8.0% below list).
- Recommended offer: $172k (12.0% below list) — sets the bar for market timing.
Location & tenants
- Location reads 74/100 on livability (#184 in TX, #4,771 nationally) — a middle-class / working-renter tenant base. Strengths: amenities A+, cost of living A+, housing A+; Watch: crime F.
- Houston ISD (urban): math 27% / reading 35% proficiency, ranked #593 of 826 in TX (top 72%) — families likely to look elsewhere, expect single-tenant / working-renter base with shorter leases; 71% free/reduced lunch — lower-income household profile, screen leases tightly.
- Zoned schools: Young El (math 17% / reading 17%, grade F, #3,836 of 4,322 statewide, top 91%, 385 students, 99% FRL); Attucks Middle (math 15% / reading 22%, grade F, #1,478 of 1,662 statewide, top 90%, 439 students, 98% FRL); Worthing H S (math 22% / reading 21%, grade F, #1,377 of 1,632 statewide, top 85%, 827 students, 96% FRL) — zoned schools average 97% FRL vs 71% district-wide (26 pts higher); higher-poverty schools than district average — tighter screening recommended.
- Zoned-school proficiency averages 19% at this address vs 31% district-wide (-12 pts) — the specific schools serving this property underperform the Houston ISD average; the district grade overstates school quality for this exact location.
- Market conditions: Rents rising fast (+4.8%/yr); 321 active listings in the ZIP; 40 comparable units currently listed for rent nearby; rentals leasing fast (median 13d on market — plan ~1-2 weeks tenant-placement turnaround); lower-income renter base — watch delinquency; 29,883 units permitted in Harris County in 2024 (8,621 in 5+ unit buildings).
Forward outlook
- In year one you build about $21k of equity ($1k loan paydown + $20k appreciation (10.0% local appreciation)).
- Harris County population projected at +47% by 2050 — long-run rental-demand tailwind backs the buy-and-hold thesis.
- At projected returns (10.0% appreciation + 4.8% rent growth), your $55k cash investment doubles in ~3 years — after that, you're playing with house money.
- By year 2, paydown + projected appreciation supports a ~$34k cash-out refi (75% LTV) — recoverable capital for the next deal without selling this one.
Negotiation context
- It's been on market 182 days — a 12% lower offer ($172k) is reasonable based on typical stale-listing flexibility.
- 5 sale attempts since 7y ago; this cycle's ask has dropped $12k (6%) from the opening price — seller is motivated, your offer sets the floor, not the list.
Risks & watch-outs
- Watch-outs: built in 1950 — expect roof / HVAC / electrical / plumbing capex.
- Climate carrying-cost: major flood risk; severe wind risk, 99% chance of damaging wind over 30y; extreme-heat days projected 7→24/yr by 2055 (HVAC capex compounding) — expect insurance premiums to compound above CPI over the hold.
Questions for the listing agent
- What do current leases actually rent for vs. the listed asking? Can we see a recent rent roll and the last 12 months of T-12 income?
- It's been on market 182 days. Have you received any prior offers? Is the seller open to a 12% concession, seller financing, or rate buy-down credit?
- Built in 1950 — when were the roof, HVAC, electrical panel, plumbing, and water heater last replaced?
- Why hasn't it sold? Are there any deal-killer items the seller is aware of (foundation, flood, title, zoning, code violations)?
- Is there a deadline driving the sale (1031 exchange, divorce, estate, relocation)? That informs how much negotiation room exists.
- Schools are D-rated, which usually means shorter tenancies and higher turnover. Who's the typical renter profile here, and what's been the actual vacancy rate?
- Crime grade is F in this area — have there been break-ins, vandalism, or insurance claims at this property in the last 3 years? What carrier currently insures it and at what premium?
- The area grade is low — what's the realistic commute time and amenity access for the typical tenant pool here? Any planned neighborhood developments (good or bad) we should know about?
- What's the average days-on-market for RENTAL listings here right now (not sales)? A rising rental-DOM trend means longer vacancies and softer asking-rent achievability than the comps imply.
- What's the recent tenant-quality profile in this submarket — average credit score on applications, eviction rate, late-payment / NSF rate, and stable-employment percentage? A property-management company in the area should have these aggregated.
- How much new for-sale + rental construction is in the pipeline within 1–3 miles? Heavy new supply typically softens prices + rents 12–24 months out; constrained supply supports both.
Investment metrics
- 1% rule
- 0.92% ✗
- Cap rate
- 6.22%
- Cash-on-cash
- -0.25%
- DSCR
- 0.99
- GRM
- 9.1
CMA / ARV
- ARV (median comp)
- $165,241
- List price
- $195,000
- Delta
- 18.01%
- Verdict
- OVERPRICED
- Comps
- 20 within 1.0 mi
Show comp detail 12 sales within ~0.75 mi
| Address | Dist | Beds/Ba | Sqft | Sold | Price | $/sf | Match |
|---|---|---|---|---|---|---|---|
| 8015 Cannon St | 0.06mi | 2/1.0 (-1) | 1,114 (-3%) | 11mo | $175,000 | $157 | 74 |
| 8122 Corinth St Unit B | 0.29mi | 3/2.0 | 1,094 (-5%) | 13mo | $286,000 | $261 | 68 |
| 8412 Fountain St | 0.31mi | 3/1.0 | 1,048 (-9%) | 12mo | $200,000 | $191 | 57 |
| 8416 Livingston St | 0.39mi | 3/2.0 | 1,247 (+8%) | 15mo | $210,000 | $168 | 56 |
| 3902 Aledo St | 0.72mi | 3/1.0 | 1,176 (+2%) | 4mo | $90,000 | $77 | 55 |
| 8017 Lawler St | 0.20mi | 3/1.0 | 1,300 (+13%) | 14mo | $98,000 | $75 | 53 |
| 3417 Bacon St | 0.64mi | 4/1.0 (+1) | 1,150 (-0%) | 12mo | $135,000 | $117 | 51 |
| 8019 Lawler St | 0.20mi | 2/1.0 (-1) | 1,008 (-12%) | 14mo | $98,000 | $97 | 49 |
| 3438 Goodhope St | 0.69mi | 3/2.0 | 1,236 (+7%) | 12mo | $154,900 | $125 | 45 |
| 7905 Corinth St | 0.33mi | 3/2.5 | 1,324 (+15%) | 15mo | $275,000 | $208 | 45 |
| 3454 Bacon St | 0.58mi | 3/2.0 | 1,278 (+11%) | 11mo | $255,000 | $200 | 45 |
| 7634 Lady St | 0.54mi | 3/1.0 | 1,270 (+10%) | 12mo | $120,000 | $94 | 43 |
Match score weights: distance 35% · size 25% · config 20% · recency 20%. Top-matched comps best support the ARV.
Projected returns pro-forma
10.0% appreciation · 4.77% rent growth · sell at horizon
- IRR
- 24.7%
- Equity multiple
- 2.99×
- Total profit
- $108,792
- Equity at exit
- $175,671
- IRR
- 22.4%
- Equity multiple
- 7.01×
- Total profit
- $328,196
- Equity at exit
- $378,842
Cash invested: $54,600 (down + closing). Projections, not guarantees.
Landlord ↔ Tenant lean methodology
- Overall (STATE)
- 87 Strongly Landlord-Friendly
- State Texas
- 87 Strongly Landlord-Friendly · R+5
- County
- — inherits STATE
- City
- — inherits STATE
ZIP-level market 77051
- Home prices YoY
- 9.7%
- Rents YoY
- 4.8%
- Active inventory
- 321
- Price-to-rent
- 9.1×
Monthly cashflow live
- Estimated rent
- $1,794 high interval (Pro) →
- Mortgage (P&I)
- −$1,023
- Tax from tax record
- −$325 /mo · $3,897/yr
- Insurance
- −$81
- HOA
- −$0
- Vacancy / Maint / Mgmt
- −$377
- Net cashflow
- $-12
Break-even live
Sensitivity live
| Price | -10% $99 | -5% $44 | +0% $-12 | +5% $-67 | +10% $-122 |
|---|---|---|---|---|---|
| Rent | -10% $-153 | -5% $-82 | +0% $-12 | +5% $59 | +10% $130 |
| Rate | -1.0pp $87 | -0.5pp $38 | base $-12 | +0.5pp $-62 | +1.0pp $-114 |
UW: 25.0% down · 7.5% · 30yr · 1.5% tax · 5.0% vac · 8.0% maint · 8.0% mgmt
Financing live
Cash to close
- Down payment
- $48,750
- Closing costs
- $5,850
- Reserves months
- —
- Total cash needed
- —
Loan-product check · same deal, 3 products live
Conventional
25% down · 7.5% · 30yr
- Down + closing
- —
- Monthly P&I
- —
- Monthly cashflow
- —
- DSCR
- —
- Eligible?
- —
Personal DTI + credit; lowest rate.
DSCR
20% down · 8.5% · 30yr
- Down + closing
- —
- Monthly P&I
- —
- Monthly cashflow
- —
- DSCR
- —
- Eligible?
- —
No personal income docs; deal must DSCR.
Hard money
10% down · 12.0% · 12mo
- Down + closing
- —
- Monthly P&I
- —
- Monthly cashflow
- —
- DSCR
- —
- Eligible?
- —
Short-term bridge; refi at stabilization.
Rent comps 40 comps
| Address | Beds | Baths | Sqft | Rent | $/sqft | DOM | Units | Dist |
|---|---|---|---|---|---|---|---|---|
| 8010 Livingston St Houston, TX | 3.0 | 2.0 | 1400 | $1,800 | $1.29 | 45d | 1 | 0.22mi |
| 8328 Corinth St Unit B Houston, TX | 3.0 | 2.5 | 1500 | $2,800 | $1.87 | 22d | 1 | 0.39mi |
| 7826 Gladstone St Houston, TX | 2.0 | 1.0 | 760 | $1,250 | $1.64 | 1d | 1 | 0.48mi |
| 7812 Tierwester St Houston, TX | 2.0 | 1.0 | 800 | $950 | $1.19 | 18d | 2 | 0.50mi |
| 7823 Gladstone St Houston, TX | 2.0 | 2.0 | 850 | $1,600 | $1.88 | 45d | 1 | 0.52mi |
| 3137 W Bellfort Ave Houston, TX | 2.0 | 2.0 | 1164 | $1,802 | $1.55 | 45d | 1 | 0.60mi |
| 4117 Shelby Cir Unit 1230900P Houston, TX | 4.0 | 2.0 | 1367 | $5,253 | $3.84 | 1d | 1 | 0.67mi |
| 8181 El Mundo St Houston, TX | 1.0–3.0 | 1.0–2.0 | 1241 | $2,041 | $1.64 | 26d | 18 | 0.71mi |
| 8181 El Mundo St Houston, TX | 1.0–3.0 | 1.0–2.5 | 1356 | $2,262 | $1.67 | 0d | 48 | 0.71mi |
| 8383 El Mundo St Unit 422 Houston, TX | 2.0 | 2.0 | 1104 | $1,529 | $1.38 | 9d | 1 | 0.80mi |
| 8383 El Mundo St Unit 8440 Houston, TX | 2.0 | 2.0 | 1104 | $1,558 | $1.41 | 45d | 1 | 0.80mi |
| 8383 El Mundo St Unit 2187 Houston, TX | 2.0 | 2.0 | 1104 | $1,554 | $1.41 | 0d | 1 | 0.80mi |
| 8383 El Mundo St Unit 2174 Houston, TX | 2.0 | 2.0 | 1104 | $1,553 | $1.41 | 12d | 1 | 0.80mi |
| 8383 El Mundo St Unit 2165 Houston, TX | 2.0 | 2.0 | 1104 | $1,513 | $1.37 | 0d | 1 | 0.80mi |
| 8300 El Mundo St Unit 422 Houston, TX | 2.0 | 2.0 | 970 | $1,265 | $1.30 | 9d | 1 | 0.87mi |
| 8300 El Mundo St Unit 2174 Houston, TX | 2.0 | 2.0 | 970 | $1,300 | $1.34 | 12d | 1 | 0.87mi |
| 8300 El Mundo St Unit 2112 Houston, TX | 2.0 | 2.0 | 970 | $1,249 | $1.29 | 0d | 1 | 0.87mi |
| 8300 El Mundo St Unit 2174 Houston, TX | 2.0 | 2.0 | 970 | $1,290 | $1.33 | 0d | 1 | 0.87mi |
| 8300 El Mundo St Unit 424 Houston, TX | 2.0 | 2.0 | 970 | $1,265 | $1.30 | 7d | 1 | 0.87mi |
| 8300 El Mundo St Unit 8357 Houston, TX | 2.0 | 2.0 | 970 | $1,289 | $1.33 | 12d | 1 | 0.87mi |
| 8380 El Mundo St Houston, TX | 1.0–2.0 | 1.0–2.0 | 712 | $1,245 | $1.75 | 0d | 26 | 0.87mi |
| 2750 Holly Hall St Houston, TX | 1.0–2.0 | 1.0–2.0 | 704 | $2,000 | $2.84 | 4d | 12 | 0.87mi |
| 2750 Holly Hall St Houston, TX | 1.0–2.0 | 1.0–2.0 | 796 | $2,000 | $2.51 | 45d | 10 | 0.87mi |
| 4410 Bellfort Ave Unit 4404 8 Houston, TX | 2.0 | 1.0 | 812 | $999 | $1.23 | 9d | 1 | 0.96mi |
| 7379 Ardmore St Unit 1303 Houston, TX | 3.0 | 2.0 | 1442 | $1,967 | $1.36 | 24d | 1 | 1.04mi |
| 7379 Ardmore St Unit 1303 Houston, TX | 3.0 | 2.0 | 1442 | $1,967 | $1.36 | 45d | 1 | 1.04mi |
| 2889 Reed Rd Houston, TX | 1.0–2.0 | 1.0–2.0 | 997 | $1,648 | $1.65 | 4d | 2 | 1.05mi |
| 7373 Ardmore St Houston, TX | 1.0–3.0 | 1.0–2.0 | 1095 | $1,887 | $1.72 | 6d | 24 | 1.06mi |
| 4530 Mayflower St Houston, TX | 3.0 | 2.0 | 1302 | $1,800 | $1.38 | 45d | 1 | 1.14mi |
| 4007 Corder St Houston, TX | 2.0 | 1.0 | 814 | $885 | $1.09 | 26d | 1 | 1.14mi |
| 8401 Almeda Rd Unit SATMC3 Houston, TX | 2.0 | 2.0 | 1027 | $1,585 | $1.54 | 26d | 1 | 1.15mi |
| 8401 Almeda Rd Houston, TX | 2.0 | 2.0 | 1027 | $1,585 | $1.54 | 24d | 1 | 1.15mi |
| 2725 Reed Rd Houston, TX | 1.0–3.0 | 1.0–2.5 | 911 | $975 | $1.07 | 45d | 1 | 1.15mi |
| 8521 Dosia St Houston, TX | 3.0 | 2.0 | 1028 | $1,665 | $1.62 | 14d | 1 | 1.16mi |
| 3360 Alice St Unit 2047 Houston, TX | 2.0 | 2.0 | 968 | $1,347 | $1.39 | 5d | 1 | 1.17mi |
| 3360 Alice St Unit 3047 Houston, TX | 3.0 | 2.0 | 1154 | $1,172 | $1.02 | 13d | 1 | 1.17mi |
| 4609 Bricker St Unit B Houston, TX | 3.0 | 2.5 | 1300 | $3,500 | $2.69 | 14d | 1 | 1.17mi |
| 4609 Bricker St Unit ABC Houston, TX | 3.0 | 2.5 | 1375 | $3,500 | $2.55 | 13d | 1 | 1.17mi |
| 4609 Bricker St Unit C Houston, TX | 2.0 | 1.5 | 1100 | $3,200 | $2.91 | 14d | 1 | 1.17mi |
| 3360 Alice St Unit 3174 Houston, TX | 3.0 | 2.0 | 1154 | $1,121 | $0.97 | 0d | 1 | 1.17mi |
Listing history 30 events
-
2026-06-21days on market $195,000 Active 182 DOM
-
2026-06-18price $195,000 Active 179 DOM
-
2026-06-18days on market $199,000 Active 179 DOM
-
2026-06-17days on market $199,000 Active 178 DOM
-
2026-06-16days on market $199,000 Active 177 DOM
-
2026-06-15days on market $199,000 Active 176 DOM
-
2026-06-13days on market $199,000 Active 174 DOM
-
2026-06-10days on market $199,000 Active 170 DOM
-
2026-06-08days on market $199,000 Active 169 DOM
-
2026-06-07days on market $199,000 Active 168 DOM
-
2026-06-04days on market $199,000 Active 165 DOM
-
2026-06-01days on market $199,000 Active 162 DOM
-
2026-05-31days on market $199,000 Active 161 DOM
-
2025-12-21$207,000 Active 443-char remark
Show marketing remark (443 chars)
This 3-bedroom, 2-bath home features an open-concept layout that’s perfect for entertaining. Enjoy beautifully tiled bathrooms and a modern kitchen with vinyl plank flooring that flows throughout the main living areas. The bedrooms offer comfortable carpeting for added warmth. Relax on the cozy front porch or take advantage of the large, fenced-in backyard complete with a storage shed—ideal for outdoor living and extra storage.
-
2020-06-30soldstatus
-
2020-06-26soldstatus Sold 443-char remark
Show marketing remark (443 chars)
Better than new construction! This gorgeous home is located in the medical center area right in the heart of the city. The kitchen is open, bright with a breakfast nook and features plenty of counter top and cabinet space! The living room is filled with natural light. Master suite is a great size with a walk in closet. The yard is a great size for company and entertainment. Located conveniently close to shopping, dining, and entertainment!
-
2020-05-30status Pending 443-char remark
Show marketing remark (443 chars)
Better than new construction! This gorgeous home is located in the medical center area right in the heart of the city. The kitchen is open, bright with a breakfast nook and features plenty of counter top and cabinet space! The living room is filled with natural light. Master suite is a great size with a walk in closet. The yard is a great size for company and entertainment. Located conveniently close to shopping, dining, and entertainment!
-
2020-04-02$147,777 Active 443-char remark
Show marketing remark (443 chars)
Better than new construction! This gorgeous home is located in the medical center area right in the heart of the city. The kitchen is open, bright with a breakfast nook and features plenty of counter top and cabinet space! The living room is filled with natural light. Master suite is a great size with a walk in closet. The yard is a great size for company and entertainment. Located conveniently close to shopping, dining, and entertainment!
-
2020-03-30historical
-
2020-03-06price $149,900
-
2019-11-19$159,900 Active
-
2019-11-19historical
-
2019-10-07price $164,999
-
2019-09-26$174,900 Active
-
2019-05-02soldstatus
-
2019-03-26historical
-
2019-03-08$58,000 Active
-
2018-11-08soldstatus
-
1991-01-10soldstatus
-
1988-01-02soldstatus
ⓘ Source: listings_history table (triggers on properties + properties_extension) + one-shot
backfill from property_details.listing_events for pre-trigger history.
Tax reassessment forecast TX · Resets to sale price
- Current annual tax
- $3,897 · $325/mo
- Projected year-2 tax
- $3,897 · $325/mo
- Expected delta
- $0/yr ($0/mo · 0.0%)
ⓘ Screening estimate from a state-policy table — verify with the county assessor before closing.
Climate risk First Street
- Flood 6/10 Major FEMA zone X (unshaded) · 74% chance over 30 yrs
- Wildfire 2/10 Low
- Heat 9/10 Extreme 7 d/yr ≥109°F today · 24 d/yr by 30 yrs out
- Wind 9/10 Extreme 99% chance of damaging wind over 30 yrs
- Air quality 2/10 Low 2 unhealthy d/yr today · 2 by 30 yrs out
Nearby sold comps map
Loading sold comps map…
Walkable amenities ~0.75 mi
Loading nearby amenities…
Taxation est. · year 1
- Rental income
- $21,524
- − Mortgage interest
- −$10,923
- − Property taxes
- −$3,897
- − Insurance
- −$975
- − Repairs & maintenance
- −$1,722
- − Management
- −$1,722
- − Depreciation
- −$5,673
- Taxable loss
- −$3,387
- Est. tax savings @ 24.0%
- +$813
- After-tax cash flow
- $674/yr
For passive investors: Depreciation is non-cash, so a rental often shows a tax loss while cash-flowing — sheltering income. Rental losses are passive: they offset passive income freely, and up to $25,000/yr can offset ordinary (W-2) income if you actively participate and your MAGI is under $100k (phasing out to $0 by $150k); unused losses carry forward. On sale, claimed depreciation is recaptured at up to 25%, and gains may owe capital-gains tax (a 1031 exchange can defer both). Figures are a year-1 estimate at your 24.0% rate — not tax advice; consult a CPA.
Schools (NCES district)
- District
- Houston ISD
- NCES district ID
- 4823640
- Math proficiency
- 27% ▼ -18.00%
- Reading proficiency
- 35% ▼ -6.00%
- Median HH income
- $46,054
- Composite
- 26.63/100
- National rank
- #7173
- State rank
- #593 of 826 in TX
Livability — Houston
- Score
- 74/100
- State rank
- #184
- US rank
- #4771
Category grades
Schools grade is shown separately in the Schools card above.
Census & demographics
- Census place
- Houston, TX
- County
- Harris County · 4,702,590 people
- City population
- 3,226,434
- Metro
- Houston-The Woodlands-Sugar Land, TX
- Population (ZIP)
- 19,795
- Household income
- $37,415
- Rent vs Own
- Severe rent burden
- 1446.0
Population outlook (Harris County) Hauer SSP2
- Today (2025)
- 5,571,493 people
- By 2030
- 6,089,821 · +9.3%
- By 2040
- 7,142,806 · +28.2%
- By 2050
- 8,185,864 · +46.9%
- By 2075
- 10,574,329 · +89.8%
- By 2100
- 12,109,958 · +117.4%
Race, ethnicity, and origin ACS 2023
- Neighborhood character
- Predominantly Black (77%)
- Race & ethnicity
- Black 77% Hispanic / Latino 16% Two or more races 11% White 3%
- Hispanic origin (detail)
- Mexican 6% Puerto Rican 1%
- Foreign-born
- 8% · Canada, China
- Languages at home
- 88% English-only · Spanish 10%
Political lean MEDSL · Harris
- 2024 margin
- Lean D (+5.5) · D 52.0% · R 46.4% · Other 1.6%
- 2008→2024 swing
- +3.9pp toward D · 2008: 1.6pp · 2024: 5.5pp
- All cycles
- 2024: D+5.5 2020: D+13.3 2016: D+12.4 2012: D+0.1 2008: D+1.6
Not yet ingested
- Civics
- —
Market trends
- HPI YoY
- ▲ 16.02%
- Current HPI
- 180.4283
- Rent YoY
- ▲ 4.77%
- Metro
- Houston-The Woodlands-Sugar Land, TX
- State GDP YoY
- ▲ 3.95%
- F500 in state
- 110
Industry mix (Fortune 500 HQ in TX)
| Industry | F500 HQs | Revenue |
|---|---|---|
| Energy | 16 | $1,198B |
|
||
| Technology | 5 | $198B |
|
||
| Engineering / Construction | 4 | $72B |
|
||
| Energy Services | 3 | $60B |
|
||
| Utilities | 3 | $41B |
|
||
| Healthcare | 2 | $330B |
|
||
Price history
+256.9% since first listed17 events — show timeline
- 2025-12-21 Listed $207,000 HARMLS
- 2020-06-30 Sold (Public Records) — Public Records
- 2020-06-26 Sold (MLS) — HARMLS
- 2020-05-30 Pending — HARMLS
- 2020-04-02 Listed $147,777 HARMLS
- 2020-03-30 Listing Removed — HARMLS
- 2020-03-06 Price Changed $149,900 HARMLS
- 2019-11-19 Listing Removed — HARMLS
- 2019-11-19 Listed $159,900 HARMLS
- 2019-10-07 Price Changed $164,999 HARMLS
- 2019-09-26 Listed $174,900 HARMLS
- 2019-05-02 Sold (Public Records) — Public Records
- 2019-03-26 Listing Removed — HARMLS
- 2019-03-08 Listed $58,000 HARMLS
- 2018-11-08 Sold (Public Records) — Public Records
- 1991-01-10 Sold (Public Records) — Public Records
- 1988-01-02 Sold (Public Records) — Public Records
Property tax history
+10.4%/yrLatest (2025): $3,897 · -13.8% YoY. Source: county tax records.
Cash-flow waterfall
monthlySold comps — $/sqft
last 12 mo · ≤1 miLoading sold comps…