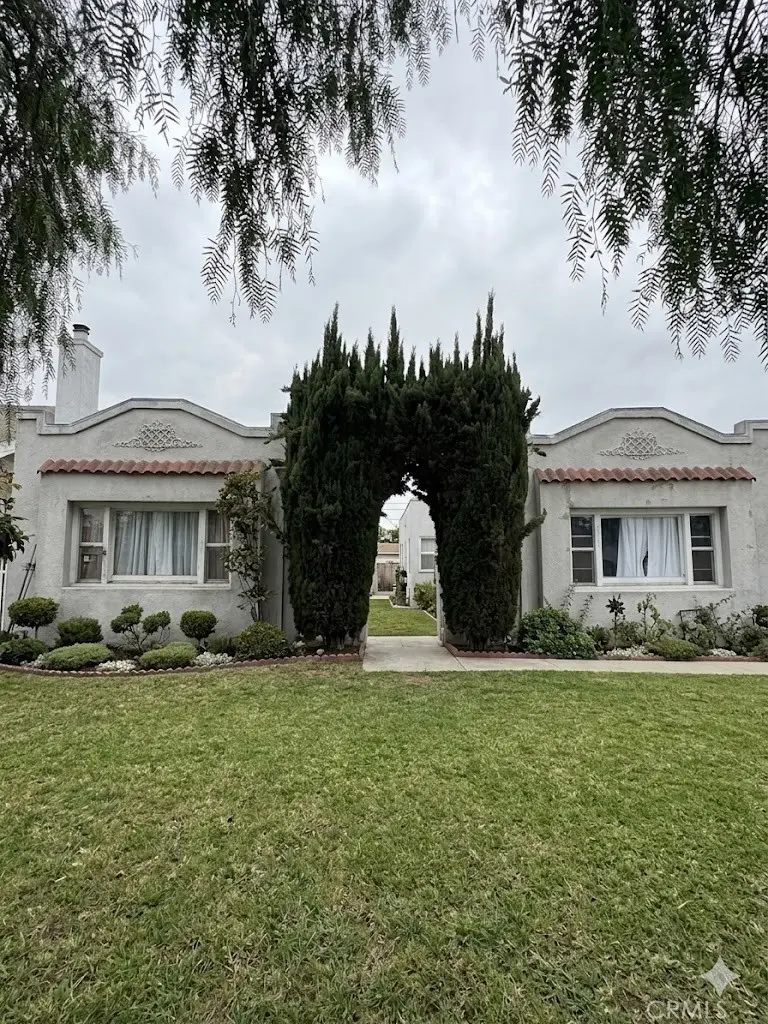
 Fourplex
1646 W 52nd · Los Angeles, CA
Flood risk 1/10 · Minimal
- FEMA flood zone
- X (unshaded)
- Chance of flooding over 30 yrs
- 0.0%
- Est. flood insurance / yr
- $507 – $1,088
Fire risk 1/10 · Minimal
- Est. fire insurance / yr
- $659 – $1,223
Heat risk 6/10 · Moderate
- Hot days now (above 88°F)
- 7 days/yr
- Hot days in 30 yrs
- 21 days/yr
Wind risk 1/10 · Minimal
- Chance of severe wind over 30 yrs
- —
Air-quality risk 5/10 · Moderate
- Unhealthy air days now
- 7 days/yr
- Unhealthy air days in 30 yrs
- 7 days/yr
Risk factors via First Street. Map © Google.
Why this score? — see what drove the B- grade
The composite is a weighted blend of 9 inputs, each scored 0–100. Each bar is that input's sub-score; the figure is the points it added to the 100-point composite (weight × sub-score).
- Cash flow +29.0/30.0
- DSCR +10.0/10.0
- ARV discount +7.5/15.0
- 1% rule +6.9/10.0
- Rent growth +5.0/5.0
- Schools +3.6/10.0
- Livability +3.4/5.0
- Condition / age +2.5/5.0
- Appreciation +0.0/10.0
$1,050,000
🖨 Deal sheet (PDF) 📄 Offer letter ✓ Due diligence
Multi-family units
County records classify this as Multi-Family (2-4 Unit). Listing-text estimate: 4 units. confirmed
Listing remarks
Income Fourplex near USC with ADU & Rental Upside! Fantastic 4-unit investment in South LA's Vermont Square. Features 2,824 SF of living space on a 6,502 SF lot. Includes a detached, unassigned 4-car garage presenting an exceptional value-add opportunity for an ADU conversion. Delivered fully occupied with reliable cash flow under LA City RSO (rent control), leaving excellent long-term rental upside for the next owner. Located in a designated Opportunity Zone. Minutes from USC, Exposition Park, the Metro, and 10/110 freeways.
Key facts
- Fourplex
- Adu
- Opportunity zone
Tags
Property features AI
Finance
- Other: Property contains four total units; No ADU on the property
- Financial info: Total building area 2,824; Total scheduled gross income approximately $71,832; Gross income reported $5,986; Net operating income approximately $70,632; Operating expenses approximately $12,000; Insurance expense approximately $4,800; Water/sewer expense approximately $7,200; Rent control applies; Tenants pay gas, trash, phone, cable TV and electricity
Exterior
- Parking: Four garage parking spaces (total); Four parking spaces (total)
- Utilities: Public sewer; District/public water; Four separate gas meters; Four separate electric meters
- Home design: Attached property; Single-story building; Four separate buildings on the parcel; Two- to five-units-per-acre lot character
- Construction: Year built per assessor; One common wall
- Exterior features: No pool; Street lighting and sidewalks in the neighborhood
Interior
- Bedrooms: Four one-bedroom units; One two-bedroom unit
- Bathrooms: Three units with one full bathroom
- Heating & cooling: Electric heating
- Interior features: Front entry; Single-story entry
- Laundry & utility: No on-site laundry listed
Neighborhood map
What this means for you Summary
Snapshot
- This is a 4 × 5-bed/2.0-bath units multifamily listed at $1.05M.
Deal economics
- At list price, monthly cash flow is $4k ($43k/yr) — positive. Per door: $897/mo.
- The deal already cash-flows at list — no discount required.
- Meets the 1% rule at list price ($13k rent vs $1.05M).
- Recommended offer: $1.03M (1.5% below list) — sets the bar for market timing.
- Cap rate 10.4% vs local median 2.1% in Los Angeles — top-decile yield for the area; either an underpriced asset or a hidden risk that comps aren't pricing in. Stress-test before assuming the spread holds.
Location & tenants
- Location reads 68/100 on livability (#273 in CA) — a middle-class / working-renter tenant base. Strengths: amenities A+, commute A+, employment B; Watch: health & safety C-, schools D+, crime F.
- Los Angeles Unified (urban): math 29% / reading 54% proficiency, ranked #223 of 517 in CA (top 43%) — families likely to look elsewhere, expect single-tenant / working-renter base with shorter leases; 67% free/reduced lunch — lower-income household profile, screen leases tightly.
- Market conditions: Rents rising fast (+14.5%/yr); 85 active listings in the ZIP; 40 comparable units currently listed for rent nearby; rentals at typical pace (median 26d on market — plan ~3-4 weeks tenant-placement turnaround); 45% of comp listings sitting > 30 days — soft ceiling on asking rent; 19,697 units permitted in Los Angeles County in 2024 (9,426 in 5+ unit buildings).
- At $12,517/mo this rent would consume 222% of the median local household income ($68k/yr) (locally 1890% of renters already pay >50% of income on rent) — very limited rent-growth headroom before tenants either downsize or default.
Forward outlook
- Local home prices are declining (-3.0%/yr); year-one equity from $7k of loan paydown is wiped out by about $32k of value loss. Plan a longer hold.
- Los Angeles County population projected at +9% by 2050 — modest demand growth; plan on rents tracking national, not racing it.
- At projected returns (-3.0% appreciation + 8.0% rent growth), your $294k cash investment doubles in ~7 years — after that, you're playing with house money.
Negotiation context
- It's been on market 20 days — a 2% lower offer ($1.03M) is reasonable based on typical stale-listing flexibility.
- 3 sale attempts since 26y ago with the ask held roughly flat each time — persistent listings suggest the price (not the market) is what's stuck; bring a comps-based counter.
- Current owner paid $219k; list at $1.05M implies a 379% gain — meaningful room to come down on a strong offer.
Risks & watch-outs
- Watch-outs: built in 1922 — expect roof / HVAC / electrical / plumbing capex.
- Climate carrying-cost: extreme-heat days projected 7→21/yr by 2055 (HVAC capex compounding) — expect insurance premiums to compound above CPI over the hold.
Questions for the listing agent
- Can we see the unit-by-unit rent roll, current vacancy, and any below-market leases? What's the average tenancy length?
- What capital expenditures (roof, boiler, parking lot, exteriors) have been made in the last 5 years, and what's planned in the next 2?
- Built in 1922 — when were the roof, HVAC, electrical panel, plumbing, and water heater last replaced?
- Is there a deadline driving the sale (1031 exchange, divorce, estate, relocation)? That informs how much negotiation room exists.
- Schools are D-rated, which usually means shorter tenancies and higher turnover. Who's the typical renter profile here, and what's been the actual vacancy rate?
- Crime grade is F in this area — have there been break-ins, vandalism, or insurance claims at this property in the last 3 years? What carrier currently insures it and at what premium?
- What's the average days-on-market for RENTAL listings here right now (not sales)? A rising rental-DOM trend means longer vacancies and softer asking-rent achievability than the comps imply.
- What's the recent tenant-quality profile in this submarket — average credit score on applications, eviction rate, late-payment / NSF rate, and stable-employment percentage? A property-management company in the area should have these aggregated.
- How much new apartment / multifamily construction is in the pipeline within 1–3 miles? Heavy new supply (>2% of stock underway) typically softens rents 12–24 months out; light construction supports rent growth.
Investment metrics
- 1% rule
- 1.19% ✓
- Cap rate
- 10.40%
- Cash-on-cash
- 14.65%
- DSCR
- 1.65
- GRM
- 7.0
CMA / ARV
- ARV (on-the-fly)
- $691,236
- Comps found
- 12
Show comp detail 12 sales within ~0.75 mi
| Address | Dist | Beds/Ba | Sqft | Sold | Price | $/sf | Match |
|---|---|---|---|---|---|---|---|
| 1543 W 52nd St | 0.13mi | 4/2.0 (+1) | 1,600 (-2%) | 14mo | $675,000 | $422 | 73 |
| 1649 W 56th St | 0.23mi | 3/2.0 | 1,448 (-12%) | 4mo | $515,000 | $356 | 67 |
| 5214 Cimarron St #5216 | 0.55mi | 2/2.0 (-1) | 1,600 (-2%) | 1mo | $580,000 | $363 | 65 |
| 1416 W 51st Pl | 0.31mi | 4/3.0 (+1) | 1,686 (+3%) | 9mo | $912,000 | $541 | 64 |
| 1530 W 54th St | 0.21mi | 4/3.0 (+1) | 1,727 (+5%) | 11mo | $620,000 | $359 | 63 |
| 5600 S Manhattan Pl | 0.32mi | 4/2.0 (+1) | 1,860 (+14%) | 5mo | $785,000 | $422 | 53 |
| 5112 S Van Ness | 0.62mi | 2/2.0 (-1) | 1,760 (+7%) | 2mo | $480,000 | $273 | 52 |
| 5735 S St Andrews Pl | 0.47mi | 4/2.0 (+1) | 1,792 (+9%) | 8mo | $700,000 | $391 | 51 |
| 1132 W 56th | 0.70mi | 4/3.0 (+1) | 1,758 (+7%) | 1mo | $644,000 | $366 | 45 |
| 1449--1451 W 45th St | 0.61mi | 4/2.0 (+1) | 1,494 (-9%) | 8mo | $850,000 | $569 | 45 |
| 4406 S Gramercy Pl | 0.72mi | 4/2.0 (+1) | 1,693 (+3%) | 15mo | $775,000 | $458 | 44 |
| 1722 W 60th Pl | 0.70mi | 4/4.0 (+1) | 1,742 (+6%) | 7mo | $820,000 | $471 | 38 |
Match score weights: distance 35% · size 25% · config 20% · recency 20%. Top-matched comps best support the ARV.
Projected returns pro-forma
-3.0% appreciation · 8.0% rent growth · sell at horizon
- IRR
- 10.2%
- Equity multiple
- 1.42×
- Total profit
- $124,242
- Equity at exit
- $156,558
- IRR
- 22.8%
- Equity multiple
- 3.39×
- Total profit
- $702,044
- Equity at exit
- $90,785
Cash invested: $294,000 (down + closing). Projections, not guarantees.
Landlord ↔ Tenant lean methodology
- Overall (CITY)
- 0 Strongly Tenant-Friendly
- State California
- 18 Strongly Tenant-Friendly · D+13
- County
- — inherits STATE
- City Los Angeles
- 0 Strongly Tenant-Friendly · D+22
ZIP-level market 90062
- Rents YoY
- 14.5%
- Active inventory
- 85
- Price-to-rent
- 28.0×
Monthly cashflow live
- Estimated rent
- $12,517 medium interval (Pro) →
- Mortgage (P&I)
- −$5,506
- Tax from tax record
- −$355 /mo · $4,258/yr
- Insurance
- −$438
- HOA
- −$0
- Vacancy / Maint / Mgmt
- −$2,629
- Net cashflow
- $3,590
Break-even live
Sensitivity live
| Price | -10% $4,184 | -5% $3,887 | +0% $3,590 | +5% $3,293 | +10% $2,995 |
|---|---|---|---|---|---|
| Rent | -10% $2,601 | -5% $3,095 | +0% $3,590 | +5% $4,084 | +10% $4,579 |
| Rate | -1.0pp $4,119 | -0.5pp $3,857 | base $3,590 | +0.5pp $3,318 | +1.0pp $3,041 |
4-unit breakdown (identical units grouped — click to expand)
| Units | Beds | Baths | Est. rent |
|---|---|---|---|
| 4× units | 5 | 2 | $12,516 |
| #1 | 5 | 2 | $3,129 |
| #2 | 5 | 2 | $3,129 |
| #3 | 5 | 2 | $3,129 |
| #4 | 5 | 2 | $3,129 |
| Total (4 units) | $12,517 | ||
UW: 25.0% down · 7.5% · 30yr · 1.5% tax · 5.0% vac · 8.0% maint · 8.0% mgmt
Financing live
Cash to close
- Down payment
- $262,500
- Closing costs
- $31,500
- Reserves months
- —
- Total cash needed
- —
Loan-product check · same deal, 3 products live
Conventional
25% down · 7.5% · 30yr
- Down + closing
- —
- Monthly P&I
- —
- Monthly cashflow
- —
- DSCR
- —
- Eligible?
- —
Personal DTI + credit; lowest rate.
DSCR
20% down · 8.5% · 30yr
- Down + closing
- —
- Monthly P&I
- —
- Monthly cashflow
- —
- DSCR
- —
- Eligible?
- —
No personal income docs; deal must DSCR.
Hard money
10% down · 12.0% · 12mo
- Down + closing
- —
- Monthly P&I
- —
- Monthly cashflow
- —
- DSCR
- —
- Eligible?
- —
Short-term bridge; refi at stabilization.
Rent comps 40 comps
| Address | Beds | Baths | Sqft | Rent | $/sqft | DOM | Units | Dist |
|---|---|---|---|---|---|---|---|---|
| 1726 W 55th St Los Angeles, CA | 3.0 | 3.0 | 1291 | $3,000 | $2.32 | 45d | 1 | 0.22mi |
| 5200 S St Andrews Pl Los Angeles, CA | 3.0 | 2.0 | 1300 | $3,295 | $2.53 | 0d | 1 | 0.29mi |
| 5507 S Manhattan Pl Unit 5509 Los Angeles, CA | 3.0 | 2.0 | 1200 | $3,125 | $2.60 | 45d | 1 | 0.33mi |
| 1415 W 49th St Los Angeles, CA | 2.0 | 1.0 | 1634 | $2,200 | $1.35 | 15d | 1 | 0.42mi |
| 1512 W 45th St Los Angeles, CA | 3.0 | 2.5 | 1549 | $3,500 | $2.26 | 26d | 1 | 0.53mi |
| 1416 W 46th St Los Angeles, CA | 2.0 | 1.0 | 1301 | $2,400 | $1.84 | 23d | 1 | 0.55mi |
| 1424 W 45th St Los Angeles, CA | 3.0 | 1.5 | 1450 | $3,750 | $2.59 | 45d | 1 | 0.59mi |
| 4523 Arlington Ave Los Angeles, CA | 4.0 | 2.0 | 1276 | $3,850 | $3.02 | 9d | 1 | 0.86mi |
| 5850 Arlington Ave Los Angeles, CA | 2.0 | 1.0 | 1281 | $2,500 | $1.95 | 45d | 1 | 0.87mi |
| 4167 Denker Ave Los Angeles, CA | 2.0 | 1.0 | 1100 | $3,200 | $2.91 | 0d | 1 | 0.89mi |
| 4312 Walton Ave Unit 1/2 back Los Angeles, CA | 2.0 | 1.0 | 1100 | $2,800 | $2.55 | 45d | 1 | 0.95mi |
| 2710 W 54th St Unit 1/2 Los Angeles, CA | 3.0 | 2.0 | 1100 | $3,250 | $2.95 | 26d | 1 | 0.98mi |
| 1541 W 65th St Los Angeles, CA | 2.0 | 2.0 | 1100 | $4,000 | $3.64 | 45d | 1 | 0.99mi |
| 860 W 56th St Unit 1 Los Angeles, CA | 3.0 | 1.0 | 1344 | $2,995 | $2.23 | 18d | 1 | 1.00mi |
| 860 W 56th St Los Angeles, CA | 3.0 | 1.0 | 1344 | $2,849 | $2.12 | 0d | 1 | 1.00mi |
| 1049 W 62nd St Unit 1049 Los Angeles, CA | 3.0 | 2.0 | 1129 | $3,695 | $3.27 | 4d | 1 | 1.08mi |
| 1233 W 41st St Unit 1233 Los Angeles, CA | 2.0 | 2.0 | 1100 | $2,800 | $2.55 | 26d | 1 | 1.11mi |
| 2014 W 41st Dr Los Angeles, CA | 3.0 | 2.0 | 1200 | $3,500 | $2.92 | 45d | 1 | 1.11mi |
| 5324 8th Ave Los Angeles, CA | 2.0 | 2.0 | 1088 | $3,299 | $3.03 | 26d | 1 | 1.12mi |
| 3987 Dalton Ave Unit 1-4 Los Angeles, CA | 4.0 | 4.5 | 1650 | $4,650 | $2.82 | 45d | 1 | 1.14mi |
| 3978 S Hobart Blvd Los Angeles, CA | 4.0 | 2.0 | 1100 | $3,700 | $3.36 | 45d | 1 | 1.16mi |
| 4062 S Budlong Ave Unit MAIN Los Angeles, CA | 3.0 | 1.0 | 2000 | $2,950 | $1.48 | 45d | 1 | 1.16mi |
| 4508 7th Ave Los Angeles, CA | 2.0 | 1.0 | 1948 | $2,995 | $1.54 | 4d | 1 | 1.17mi |
| 855 1/2 W 43rd Pl Los Angeles, CA | 2.0 | 1.0 | 1150 | $2,399 | $2.09 | 6d | 1 | 1.18mi |
| 855 W 43rd Pl Los Angeles, CA | 2.0 | 1.0 | 1150 | $2,349 | $2.04 | 9d | 1 | 1.18mi |
| 3962 1/4 S Hobart Blvd Los Angeles, CA | 3.0 | 1.0 | 1250 | $3,150 | $2.52 | 45d | 1 | 1.19mi |
| 1309 1/2 W Martin Luther King Junior Blvd Los Angeles, CA | 2.0 | 1.0 | 1134 | $2,195 | $1.94 | 45d | 1 | 1.19mi |
| 1307 W Martin Luther King Junior Blvd Unit 1309 Los Angeles, CA | 2.0 | 1.0 | 1134 | $2,195 | $1.94 | 45d | 1 | 1.20mi |
| 620 W 52nd St Los Angeles, CA | 4.0 | 2.0 | 1777 | $3,450 | $1.94 | 26d | 1 | 1.21mi |
| 5900 S Hoover St Apt 1 Los Angeles, CA | 2.0 | 2.0 | 1096 | $2,700 | $2.46 | 45d | 1 | 1.22mi |
| 1261 Browning Blvd Los Angeles, CA | 3.0 | 3.0 | 1232 | $3,208 | $2.60 | 26d | 1 | 1.24mi |
| 3961 Halldale Ave Unit 1 Los Angeles, CA | 3.0 | 2.0 | 1300 | $3,100 | $2.38 | 45d | 1 | 1.25mi |
| 5465 9th Ave Los Angeles, CA | 4.0 | 2.0 | 1824 | $9,500 | $5.21 | 45d | 1 | 1.25mi |
| 831 W 43rd St Los Angeles, CA | 3.0 | 1.0 | 1350 | $2,495 | $1.85 | 6d | 1 | 1.25mi |
| 1265 Browning Blvd Unit 1/2 Los Angeles, CA | 4.0 | 4.0 | 1816 | $3,666 | $2.02 | 26d | 1 | 1.26mi |
| 1263 Browning Blvd Los Angeles, CA | 3.0 | 3.0 | 1232 | $3,208 | $2.60 | 26d | 1 | 1.26mi |
| 601 W 49th St Unit 601 Los Angeles, CA | 4.0 | 2.0 | 1150 | $2,995 | $2.60 | 45d | 1 | 1.28mi |
| 4914 10th Ave Los Angeles, CA | 2.0 | 1.0 | 1150 | $2,850 | $2.48 | 45d | 1 | 1.28mi |
| 811 W 43rd St Los Angeles, CA | 3.0 | 1.0 | 1100 | $2,850 | $2.59 | 12d | 1 | 1.28mi |
| 618 1/4 W 46th St Los Angeles, CA | 4.0 | 3.0 | 1178 | $3,500 | $2.97 | 26d | 1 | 1.28mi |
Listing history 13 events
-
2026-06-21days on market $1,050,000 Active 20 DOM
-
2026-06-18days on market $1,050,000 Active 17 DOM
-
2026-06-17days on market $1,050,000 Active 16 DOM
-
2026-06-16days on market $1,050,000 Active 15 DOM
-
2026-06-15days on market $1,050,000 Active 14 DOM
-
2026-06-13days on market $1,050,000 Active 12 DOM
-
2026-06-09days on market $1,050,000 Active 8 DOM
-
2026-06-08days on market $1,050,000 Active 7 DOM
-
2026-06-07days on market $1,050,000 Active 6 DOM
-
2026-06-04days on market $1,050,000 Active 3 DOM
-
2026-06-03days on market $1,050,000 Active 2 DOM
-
2026-06-02remarks 534-char remark
-
2026-06-02$1,050,000 Active 1 DOM
ⓘ Source: listings_history table (triggers on properties + properties_extension) + one-shot
backfill from property_details.listing_events for pre-trigger history.
Tax reassessment forecast CA · Resets to sale price
- Current annual tax
- $4,258 · $355/mo
- Projected year-2 tax
- $7,980 · $665/mo
- Expected delta
- +$3,722/yr (+$310/mo · 87.4%)
ⓘ Screening estimate from a state-policy table — verify with the county assessor before closing.
Climate risk First Street
- Flood 1/10 Low FEMA zone X (unshaded) · 0% chance over 30 yrs
- Wildfire 1/10 Low
- Heat 6/10 Major 7 d/yr ≥88°F today · 21 d/yr by 30 yrs out
- Wind 1/10 Low
- Air quality 5/10 Major 7 unhealthy d/yr today · 7 by 30 yrs out
Nearby sold comps map
Loading sold comps map…
Walkable amenities ~0.75 mi
Loading nearby amenities…
Taxation est. · year 1
- Rental income
- $150,204
- − Mortgage interest
- −$58,816
- − Property taxes
- −$4,258
- − Insurance
- −$5,250
- − Repairs & maintenance
- −$12,016
- − Management
- −$12,016
- − Depreciation
- −$30,545
- Taxable income
- $27,302
- Est. tax owed @ 24.0%
- −$6,552
- After-tax cash flow
- $36,525/yr
For passive investors: Depreciation is non-cash, so a rental often shows a tax loss while cash-flowing — sheltering income. Rental losses are passive: they offset passive income freely, and up to $25,000/yr can offset ordinary (W-2) income if you actively participate and your MAGI is under $100k (phasing out to $0 by $150k); unused losses carry forward. On sale, claimed depreciation is recaptured at up to 25%, and gains may owe capital-gains tax (a 1031 exchange can defer both). Figures are a year-1 estimate at your 24.0% rate — not tax advice; consult a CPA.
Schools (NCES district)
- District
- Los Angeles Unified
- NCES district ID
- 0622710
- Math proficiency
- 29% ▼ -4.00%
- Reading proficiency
- 54% ▲ 10.00%
- Median HH income
- $50,403
- Composite
- 35.67/100
- National rank
- #4875
- State rank
- #223 of 517 in CA
Livability — Los Angeles
- Score
- 68/100
- State rank
- #273
- US rank
- #9237
Category grades
Schools grade is shown separately in the Schools card above.
Census & demographics
- Census place
- Los Angeles, CA
- County
- Los Angeles County · 9,444,647 people
- City population
- 3,838,149
- Metro
- Los Angeles-Long Beach-Anaheim, CA
- Population (ZIP)
- 32,715
- Household income
- $67,701
- Rent vs Own
- Severe rent burden
- 1890.0
Population outlook (Los Angeles County) Hauer SSP2
- Today (2025)
- 10,940,515 people
- By 2030
- 11,256,481 · +2.9%
- By 2040
- 11,729,929 · +7.2%
- By 2050
- 11,948,407 · +9.2%
- By 2075
- 11,818,114 · +8.0%
- By 2100
- 10,842,928 · -0.9%
Race, ethnicity, and origin ACS 2023
- Neighborhood character
- Majority Hispanic (63%)
- Race & ethnicity
- Hispanic / Latino 63% Black 26% Two or more races 15% White 3% Asian 2% Native American 2%
- Hispanic origin (detail)
- Mexican 29%
- Common ancestry
- British 3%
- Foreign-born
- 38% · Canada, South Korea, Guatemala
- Languages at home
- 36% English-only · Spanish 61% Korean 1% French/Haitian/Cajun 1%
Political lean MEDSL · Los Angeles
- 2024 margin
- Solid D (+32.9) · D 64.8% · R 31.9% · Other 3.3%
- 2008→2024 swing
- -7.4pp toward R · 2008: 40.4pp · 2024: 32.9pp
- All cycles
- 2024: D+32.9 2020: D+44.2 2016: D+48.0 2012: D+40.0 2008: D+40.4
Not yet ingested
- Civics
- —
Market trends
- HPI YoY
- ▼ -670.48%
- Current HPI
- 500.9289
- Rent YoY
- ▲ 14.48%
- Metro
- Los Angeles-Long Beach-Anaheim, CA
- State GDP YoY
- ▲ 3.21%
- F500 in state
- 116
Industry mix (Fortune 500 HQ in CA)
| Industry | F500 HQs | Revenue |
|---|---|---|
| Technology | 27 | $1,492B |
|
||
| Financial Services | 3 | $174B |
|
||
| Retail | 3 | $44B |
|
||
| Insurance | 3 | $26B |
|
||
| Media / Entertainment | 2 | $115B |
|
||
| Pharmaceuticals / Biotech | 2 | $62B |
|
||
Price history
+644.7% since first listed7 events — show timeline
- 2026-06-01 Listed $1,050,000 CRMLS
- 2001-07-02 Sold (Public Records) $219,000 Public Records
- 2001-06-20 Delisted — TheMLS
- 2001-02-20 Listed — TheMLS
- 2000-12-18 Delisted — TheMLS
- 2000-07-18 Listed — TheMLS
- 1985-11-18 Sold (Public Records) $141,000 Public Records
Property tax history
+0.1%/yrLatest (2025): $4,258 · +1.7% YoY. Source: county tax records.
Cash-flow waterfall
monthlySold comps — $/sqft
last 12 mo · ≤1 miLoading sold comps…