6616 Apollo St · Houston, TX
Flood risk 1/10 · Minimal
- FEMA flood zone
- X (unshaded)
- Chance of flooding over 30 yrs
- 0.0%
- Est. flood insurance / yr
- $507 – $1,088
Fire risk 1/10 · Minimal
- Est. fire insurance / yr
- $1,222 – $2,270
Heat risk 9/10 · Severe
- Hot days now (above 109°F)
- 7 days/yr
- Hot days in 30 yrs
- 24 days/yr
Wind risk 9/10 · Severe
- Chance of severe wind over 30 yrs
- 99.0%
Air-quality risk 3/10 · Minor
- Unhealthy air days now
- 3 days/yr
- Unhealthy air days in 30 yrs
- 4 days/yr
Risk factors via First Street. Map © Google.
Why this score? — see what drove the C- grade
The composite is a weighted blend of 9 inputs, each scored 0–100. Each bar is that input's sub-score; the figure is the points it added to the 100-point composite (weight × sub-score).
- ARV discount +15.0/15.0
- Cash flow +14.3/30.0
- DSCR +4.4/10.0
- 1% rule +4.0/10.0
- Condition / age +4.0/5.0
- Livability +3.7/5.0
- Rent growth +3.0/5.0
- Schools +2.7/10.0
- Appreciation +0.0/10.0
$197,620
🖨 Deal sheet 📄 Offer letter ✓ Due diligence
Listing remarks MLS
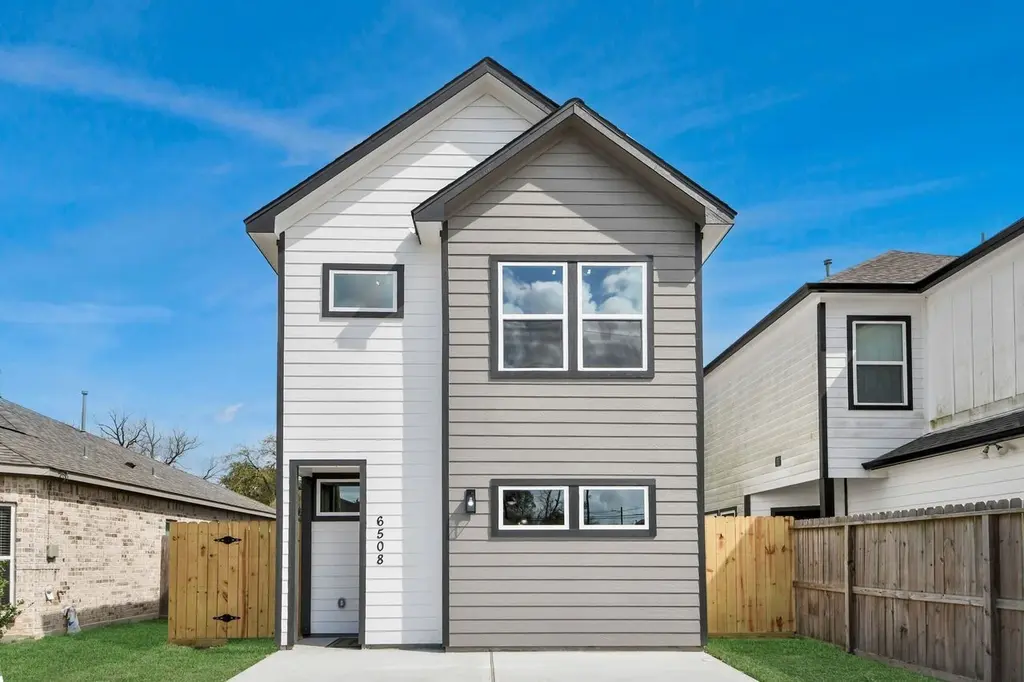
Looking for an affordable home with an affordable monthly payment? This beautiful property has it all! Featuring 3 bedrooms and 3 full bathrooms, 9-foot ceilings, and lots of natural light, this home offers comfort and style. One bedroom with a full bath is conveniently located on the first floor (not the primary bedroom), perfect for guests or multi-generational living. Ideally located near freeways, shopping, downtown, and more, this home has everything you’re looking for. Don’t miss out! Colors of floors are subject to change pictures its just an example property is virtually stage
Key facts
- 3,001 sq ft lot
- Built 2025
- Listed 266 days
Neighborhood map
What this means for you Summary
Snapshot
- This is a 3-bed/3.0-bath single-family listed at $198k. Condition is rated good.
Deal economics
- At list price, monthly cash flow is $37 ($445/yr) — positive.
- The deal already cash-flows at list — no discount required.
- To meet the 1% rule (rent ≥ 1% of price), the offer needs to be $178k (10.1% below list).
- Recommended offer: $174k (12.0% below list) — sets the bar for market timing.
- Cap rate 6.5% vs local median 3.2% in Houston — top-decile yield for the area; either an underpriced asset or a hidden risk that comps aren't pricing in. Stress-test before assuming the spread holds.
Location & tenants
- Location reads 74/100 on livability (#184 in TX, #4,771 nationally) — a middle-class / working-renter tenant base. Strengths: amenities A+, cost of living A+, housing A+; Watch: schools D, crime F.
- Houston ISD (urban): math 27% / reading 35% proficiency, ranked #593 of 826 in TX (top 72%) — families likely to look elsewhere, expect single-tenant / working-renter base with shorter leases; 71% free/reduced lunch — lower-income household profile, screen leases tightly.
- Market conditions: Rents rising (+2.1%/yr); 675 active listings in the ZIP; 32 comparable units currently listed for rent nearby; rentals lingering (median 44d on market — plan ~5-8 weeks vacancy on turnover, expect pricing pressure); 59% of comp listings sitting > 30 days — soft ceiling on asking rent; lower-income renter base — watch delinquency; 29,883 units permitted in Harris County in 2024 (8,621 in 5+ unit buildings).
- At $1,776/mo this rent would consume 60% of the median local household income ($35k/yr) (locally 3210% of renters already pay >50% of income on rent) — very limited rent-growth headroom before tenants either downsize or default.
Forward outlook
- Local home prices are declining (-3.0%/yr); year-one equity from $1k of loan paydown is wiped out by about $6k of value loss. Plan a longer hold.
- Harris County population projected at +47% by 2050 — long-run rental-demand tailwind backs the buy-and-hold thesis.
Negotiation context
- It's been on market 267 days — a 12% lower offer ($174k) is reasonable based on typical stale-listing flexibility.
Risks & watch-outs
- Climate carrying-cost: severe wind risk, 99% chance of damaging wind over 30y; extreme-heat days projected 7→24/yr by 2055 (HVAC capex compounding) — expect insurance premiums to compound above CPI over the hold.
Questions for the listing agent
- It's been on market 267 days. Have you received any prior offers? Is the seller open to a 12% concession, seller financing, or rate buy-down credit?
- Why hasn't it sold? Are there any deal-killer items the seller is aware of (foundation, flood, title, zoning, code violations)?
- Is there a deadline driving the sale (1031 exchange, divorce, estate, relocation)? That informs how much negotiation room exists.
- Schools are D-rated, which usually means shorter tenancies and higher turnover. Who's the typical renter profile here, and what's been the actual vacancy rate?
- Crime grade is F in this area — have there been break-ins, vandalism, or insurance claims at this property in the last 3 years? What carrier currently insures it and at what premium?
- What's the average days-on-market for RENTAL listings here right now (not sales)? A rising rental-DOM trend means longer vacancies and softer asking-rent achievability than the comps imply.
- What's the recent tenant-quality profile in this submarket — average credit score on applications, eviction rate, late-payment / NSF rate, and stable-employment percentage? A property-management company in the area should have these aggregated.
- How much new for-sale + rental construction is in the pipeline within 1–3 miles? Heavy new supply typically softens prices + rents 12–24 months out; constrained supply supports both.
Investment metrics
- 1% rule
- 0.90% ✗
- Cap rate
- 6.52%
- Cash-on-cash
- 0.80%
- DSCR
- 1.04
- GRM
- 9.3
CMA / ARV
- ARV (median comp)
- $270,235
- List price
- $197,620
- Delta
- -26.87%
- Verdict
- UNDERPRICED
- Comps
- 20 within 1.0 mi
Show comp detail 12 sales within ~0.75 mi
| Address | Dist | Beds/Ba | Sqft | Sold | Price | $/sf | Match |
|---|---|---|---|---|---|---|---|
| 6827 Tuskegee | 0.22mi | 3/2.0 | 1,188 (-3%) | 8mo | $225,000 | $189 | 74 |
| 1315 Wilburforce St | 0.29mi | 2/1.0 (-1) | 1,232 (+0%) | 10mo | $396,000 | $321 | 64 |
| 6828 Knox St | 0.38mi | 3/1.5 | 1,177 (-4%) | 8mo | $240,000 | $204 | 63 |
| 6525 Sealey St | 0.53mi | 3/1.0 | 1,236 (+1%) | 4mo | $110,000 | $89 | 62 |
| 6706 Tippett St | 0.39mi | 4/2.0 (+1) | 1,194 (-3%) | 9mo | $133,000 | $111 | 60 |
| 862 Rachel St | 0.59mi | 3/2.0 | 1,298 (+6%) | 4mo | $275,900 | $213 | 56 |
| 931 Lucky St | 0.70mi | 3/1.5 | 1,248 (+2%) | 6mo | $120,000 | $96 | 53 |
| 6814 Covington Dr | 0.75mi | 2/3.0 (-1) | 1,180 (-4%) | 3mo | $145,000 | $123 | 51 |
| 6721 Cathcart Dr | 0.71mi | 2/1.0 (-1) | 1,233 (+0%) | 3mo | $146,000 | $118 | 51 |
| 1055 Wheatley Oak Ln | 0.54mi | 3/2.5 | 1,384 (+13%) | 4mo | $299,990 | $217 | 48 |
| 955 Lucky St | 0.68mi | 3/2.0 | 1,064 (-13%) | 1mo | $110,000 | $103 | 42 |
| 885 W Little York Rd | 0.59mi | 3/1.5 | 1,344 (+10%) | 12mo | $155,000 | $115 | 40 |
Match score weights: distance 35% · size 25% · config 20% · recency 20%. Top-matched comps best support the ARV.
Projected returns pro-forma
-3.0% appreciation · 2.1% rent growth · sell at horizon
- IRR
- -16.0%
- Equity multiple
- 0.44×
- Total profit
- $-31,228
- Equity at exit
- $29,466
- IRR
- -9.3%
- Equity multiple
- 0.45×
- Total profit
- $-30,464
- Equity at exit
- $17,087
Cash invested: $55,334 (down + closing). Projections, not guarantees.
Landlord ↔ Tenant lean methodology
- Overall (STATE)
- 87 Strongly Landlord-Friendly
- State Texas
- 87 Strongly Landlord-Friendly · R+5
- County
- — inherits STATE
- City
- — inherits STATE
ZIP-level market 77091
- Home prices YoY
- -24.9%
- Rents YoY
- 2.1%
- Active inventory
- 675
- Price-to-rent
- 9.3×
Monthly cashflow live
- Estimated rent
- $1,776 high interval (Pro) →
- Mortgage (P&I)
- −$1,036
- Tax est. 1.5%
- −$247 /mo · $2,964/yr
- Insurance
- −$82
- HOA
- −$0
- Vacancy / Maint / Mgmt
- −$373
- Net cashflow
- $37
Break-even live
UW: 25.0% down · 7.5% · 30yr · 1.5% tax · 5.0% vac · 8.0% maint · 8.0% mgmt
Financing live
Cash to close
- Down payment
- $49,405
- Closing costs
- $5,929
- Reserves months
- —
- Total cash needed
- —
Loan-product check · same deal, 3 products live
Conventional
25% down · 7.5% · 30yr
- Down + closing
- —
- Monthly P&I
- —
- Monthly cashflow
- —
- DSCR
- —
- Eligible?
- —
Personal DTI + credit; lowest rate.
DSCR
20% down · 8.5% · 30yr
- Down + closing
- —
- Monthly P&I
- —
- Monthly cashflow
- —
- DSCR
- —
- Eligible?
- —
No personal income docs; deal must DSCR.
Hard money
10% down · 12.0% · 12mo
- Down + closing
- —
- Monthly P&I
- —
- Monthly cashflow
- —
- DSCR
- —
- Eligible?
- —
Short-term bridge; refi at stabilization.
Rent comps 32 comps
| Address | Beds | Baths | Sqft | Rent | $/sqft | DOM | Units | Dist |
|---|---|---|---|---|---|---|---|---|
| 1825 W Little York Rd Houston, TX | 2.0 | 1.0 | 787 | $880 | $1.12 | 43d | 1 | 0.69mi |
| 833 Paul Quinn St Unit A Houston, TX | 3.0 | 2.5 | 1226 | $1,800 | $1.47 | 43d | 1 | 0.87mi |
| 831 Paul Quinn St Unit B Houston, TX | 3.0 | 2.5 | 1226 | $1,800 | $1.47 | 24d | 1 | 0.87mi |
| 1200 W Tidwell Rd Houston, TX | 2.0–3.0 | 1.0–2.0 | 938 | $1,295 | $1.38 | 2d | 12 | 0.88mi |
| 5722 # E Unit Beall St unit Houston, TX | 3.0 | 2.5 | 1474 | $2,011 | $1.36 | 43d | 1 | 0.94mi |
| 5720 Beall St Unit C Houston, TX | 3.0 | 2.5 | 1474 | $2,006 | $1.36 | 43d | 1 | 0.95mi |
| 1010 Junell St Unit A Houston, TX | 3.0 | 2.0 | 1040 | $1,550 | $1.49 | 24d | 1 | 0.97mi |
| 7486 N Shepherd Dr Houston, TX | 3.0 | 2.0 | 1177 | $1,290 | $1.10 | 43d | 1 | 1.13mi |
| 783 Fortune St Unit A Houston, TX | 3.0 | 2.5 | 1328 | $1,795 | $1.35 | 16d | 1 | 1.15mi |
| 929 Marjorie St Unit 1060806P Houston, TX | 3.0 | 2.0 | 1076 | $3,091 | $2.87 | 7d | 1 | 1.17mi |
| 8108 De Priest St Unit B Houston, TX | 3.0 | 2.5 | 1500 | $1,900 | $1.27 | 43d | 1 | 1.17mi |
| 8110 De Priest St Unit A Houston, TX | 3.0 | 2.5 | 1500 | $1,900 | $1.27 | 43d | 1 | 1.17mi |
| 8112 De Priest St Unit B Houston, TX | 3.0 | 2.5 | 1500 | $1,900 | $1.27 | 43d | 1 | 1.18mi |
| 8120 De Priest St Unit B Houston, TX | 3.0 | 2.5 | 1500 | $1,900 | $1.27 | 43d | 1 | 1.21mi |
| 8120 De Priest St Unit A Houston, TX | 3.0 | 2.5 | 1500 | $1,750 | $1.17 | 43d | 1 | 1.21mi |
| 8122 De Priest St Unit A Houston, TX | 3.0 | 3.5 | 1500 | $1,900 | $1.27 | 43d | 1 | 1.21mi |
| 8118 De Priest St Unit B Houston, TX | 3.0 | 2.5 | 1500 | $1,900 | $1.27 | 43d | 1 | 1.21mi |
| 8306 De Priest St Unit A Houston, TX | 3.0 | 2.5 | 1500 | $1,900 | $1.27 | 20d | 1 | 1.24mi |
| 714 W Tidwell Rd Houston, TX | 2.0 | 1.0 | 1296 | $1,094 | $0.84 | 43d | 1 | 1.24mi |
| 8310 De Priest St Unit B Houston, TX | 3.0 | 2.5 | 1500 | $1,900 | $1.27 | 20d | 1 | 1.24mi |
| 8312 De Priest St Unit A Houston, TX | 3.0 | 2.5 | 1500 | $1,900 | $1.27 | 20d | 1 | 1.25mi |
| 8312 De Priest St Unit B Houston, TX | 3.0 | 3.5 | 1500 | $1,900 | $1.27 | 20d | 1 | 1.25mi |
| 1464 Ferguson Way Houston, TX | 2.0 | 3.0 | 850 | $1,850 | $2.18 | 43d | 1 | 1.33mi |
| 1007 Pinemont Dr Houston, TX | 2.0 | 2.0 | 985 | $1,774 | $1.80 | 43d | 1 | 1.33mi |
| 2602 Dalview St Unit B Houston, TX | 2.0 | 1.0 | 800 | $1,400 | $1.75 | 43d | 1 | 1.36mi |
| 1001 Pinemont Dr Unit 422 Houston, TX | 2.0 | 2.0 | 1155 | $1,389 | $1.20 | 7d | 1 | 1.40mi |
| 1001 Pinemont Dr Unit 2165 Houston, TX | 2.0 | 2.0 | 1155 | $1,381 | $1.20 | 2d | 1 | 1.40mi |
| 1001 Pinemont Dr Unit 1058 Houston, TX | 2.0 | 2.0 | 1155 | $1,414 | $1.22 | 43d | 1 | 1.40mi |
| 1001 Pinemont Dr Unit 1038 Houston, TX | 2.0 | 2.0 | 1155 | $1,413 | $1.22 | 10d | 1 | 1.40mi |
| 1001 Pinemont Dr Unit 96 Houston, TX | 2.0 | 2.0 | 1155 | $1,599 | $1.38 | 43d | 1 | 1.40mi |
| 7903 Moon Beam St Houston, TX | 3.0 | 2.5 | 1217 | $1,700 | $1.40 | 16d | 1 | 1.44mi |
| 312 W Sunnyside St Houston, TX | 2.0 | 1.0 | 894 | $1,001 | $1.12 | 43d | 1 | 1.46mi |
Listing history 12 events
-
2026-06-18days on market $197,620 Active 267 DOM
-
2026-06-17days on market $197,620 Active 266 DOM
-
2026-06-16days on market $197,620 Active 265 DOM
-
2026-06-15days on market $197,620 Active 264 DOM
-
2026-06-13days on market $197,620 Active 262 DOM
-
2026-06-10days on market $197,620 Active 258 DOM
-
2026-06-08days on market $197,620 Active 257 DOM
-
2026-06-07days on market $197,620 Active 256 DOM
-
2026-06-04days on market $197,620 Active 253 DOM
-
2026-06-01days on market $197,620 Active 250 DOM
-
2026-05-31days on market $197,620 Active 249 DOM
-
2025-09-24$197,620 Active 603-char remark
Show marketing remark (603 chars)
Looking for an affordable home with an affordable monthly payment? This beautiful property has it all! Featuring 3 bedrooms and 3 full bathrooms, 9-foot ceilings, and lots of natural light, this home offers comfort and style. One bedroom with a full bath is conveniently located on the first floor (not the primary bedroom), perfect for guests or multi-generational living. Ideally located near freeways, shopping, downtown, and more, this home has everything you’re looking for. Don’t miss out! Colors of floors are subject to change pictures its just an example property is virtually stage
ⓘ Source: listings_history table (triggers on properties + properties_extension) + one-shot
backfill from property_details.listing_events for pre-trigger history.
Climate risk First Street
- Flood 1/10 Low FEMA zone X (unshaded) · 0% chance over 30 yrs
- Wildfire 1/10 Low
- Heat 9/10 Extreme 7 d/yr ≥109°F today · 24 d/yr by 30 yrs out
- Wind 9/10 Extreme 99% chance of damaging wind over 30 yrs
- Air quality 3/10 Moderate 3 unhealthy d/yr today · 4 by 30 yrs out
Nearby sold comps map
Loading sold comps map…
Walkable amenities ~0.75 mi
Loading nearby amenities…
Taxation est. · year 1
- Rental income
- $21,308
- − Mortgage interest
- −$11,070
- − Property taxes
- −$2,964
- − Insurance
- −$988
- − Repairs & maintenance
- −$1,705
- − Management
- −$1,705
- − Depreciation
- −$5,749
- Taxable loss
- −$2,872
- Est. tax savings @ 24.0%
- +$689
- After-tax cash flow
- $1,134/yr
For passive investors: Depreciation is non-cash, so a rental often shows a tax loss while cash-flowing — sheltering income. Rental losses are passive: they offset passive income freely, and up to $25,000/yr can offset ordinary (W-2) income if you actively participate and your MAGI is under $100k (phasing out to $0 by $150k); unused losses carry forward. On sale, claimed depreciation is recaptured at up to 25%, and gains may owe capital-gains tax (a 1031 exchange can defer both). Figures are a year-1 estimate at your 24.0% rate — not tax advice; consult a CPA.
Condition & rehab AI · 6 photos
This single-family home is in excellent condition with a good condition score of 80. It offers a modern kitchen, bathrooms, and exterior, making it an attractive property for both resale and rental. Minor updates such as painting and flooring upgrades can further enhance its value.
Value-add opportunities
- Both Painting the exterior and interior walls — Fresh paint can enhance curb appeal and interior aesthetics.
- Both Updating the flooring in the bathrooms — Modern flooring can improve both resale and rental value.
- Both Adding smart home features — Smart home features can increase both resale and rental appeal by offering convenience and modernity.
- Both Upgrading the kitchen appliances — Upgrading to more modern or energy-efficient appliances can increase both resale and rental value.
- Both Landscaping improvements — Enhancing the landscaping can improve curb appeal and attract more potential buyers or renters.
Renovation cost estimate screening
Value-add ROI direction
- Both Painting the exterior and interior walls — Fresh paint can enhance curb appeal and interior aesthetics. ↑
- Both Updating the flooring in the bathrooms — Modern flooring can improve both resale and rental value. ↑
- Both Adding smart home features — Smart home features can increase both resale and rental appeal by offering convenience and modernity. ↑
- Both Upgrading the kitchen appliances — Upgrading to more modern or energy-efficient appliances can increase both resale and rental value. ↑
- Both Landscaping improvements — Enhancing the landscaping can improve curb appeal and attract more potential buyers or renters. ↑
ⓘ Cost ranges are severity-bucket heuristics (US national rule-of-thumb). Get contractor quotes + a written scope before underwriting a rehab budget.
Schools (NCES district)
- District
- Houston ISD
- NCES district ID
- 4823640
- Math proficiency
- 27% ▼ -18.00%
- Reading proficiency
- 35% ▼ -6.00%
- Median HH income
- $46,054
- Composite
- 26.63/100
- National rank
- #7173
- State rank
- #593 of 826 in TX
Livability — Houston
- Score
- 74/100
- State rank
- #184
- US rank
- #4771
Category grades
Schools grade is shown separately in the Schools card above.
Census & demographics
- Census place
- Houston, TX
- County
- Harris County · 4,702,590 people
- City population
- 3,226,434
- Metro
- Houston-The Woodlands-Sugar Land, TX
- Population (ZIP)
- 28,728
- Household income
- $35,432
- Rent vs Own
- Severe rent burden
- 3210.0
Population outlook (Harris County) Hauer SSP2
- Today (2025)
- 5,571,493 people
- By 2030
- 6,089,821 · +9.3%
- By 2040
- 7,142,806 · +28.2%
- By 2050
- 8,185,864 · +46.9%
- By 2075
- 10,574,329 · +89.8%
- By 2100
- 12,109,958 · +117.4%
Race, ethnicity, and origin ACS 2023
- Neighborhood character
- Diverse neighborhood (Simpson 0.58)
- Race & ethnicity
- Hispanic / Latino 46% Black 45% Two or more races 15% White 7%
- Hispanic origin (detail)
- Mexican 29%
- Common ancestry
- Italian 1%
- Foreign-born
- 24% · Canada, Jamaica
- Languages at home
- 55% English-only · Spanish 41% French/Haitian/Cajun 2%
Political lean MEDSL · Harris
- 2024 margin
- Lean D (+5.5) · D 52.0% · R 46.4% · Other 1.6%
- 2008→2024 swing
- +3.9pp toward D · 2008: 1.6pp · 2024: 5.5pp
- All cycles
- 2024: D+5.5 2020: D+13.3 2016: D+12.4 2012: D+0.1 2008: D+1.6
Not yet ingested
- Civics
- —
Market trends
- HPI YoY
- ▼ -94.19%
- Current HPI
- 283.7523
- Rent YoY
- ▲ 2.10%
- Metro
- Houston-The Woodlands-Sugar Land, TX
- State GDP YoY
- ▲ 3.95%
- F500 in state
- 110
Industry mix (Fortune 500 HQ in TX)
| Industry | F500 HQs | Revenue |
|---|---|---|
| Energy | 16 | $1,198B |
|
||
| Technology | 5 | $198B |
|
||
| Engineering / Construction | 4 | $72B |
|
||
| Energy Services | 3 | $60B |
|
||
| Utilities | 3 | $41B |
|
||
| Healthcare | 2 | $330B |
|
||
Price history
1 event — show timeline
- 2025-09-24 Listed $197,620 HARMLS
Cash-flow waterfall
monthlySold comps — $/sqft
last 12 mo · ≤1 miLoading sold comps…