140 Inner Cir · Davis, CA
Flood risk 3/10 · Minor
- FEMA flood zone
- X (unshaded)
- Chance of flooding over 30 yrs
- 0.07%
- Est. flood insurance / yr
- $507 – $1,088
Fire risk 3/10 · Minor
- Est. fire insurance / yr
- $659 – $1,223
Heat risk 6/10 · Moderate
- Hot days now (above 103°F)
- 6 days/yr
- Hot days in 30 yrs
- 13 days/yr
Wind risk 1/10 · Minimal
- Chance of severe wind over 30 yrs
- —
Air-quality risk 10/10 · Severe
- Unhealthy air days now
- 27 days/yr
- Unhealthy air days in 30 yrs
- 29 days/yr
Risk factors via First Street. Map © Google.
Why this score? — see what drove the A- grade
The composite is a weighted blend of 9 inputs, each scored 0–100. Each bar is that input's sub-score; the figure is the points it added to the 100-point composite (weight × sub-score).
- Cash flow +30.0/30.0
- ARV discount +15.0/15.0
- DSCR +10.0/10.0
- 1% rule +9.1/10.0
- Schools +7.1/10.0
- Livability +3.9/5.0
- Condition / age +3.8/5.0
- Rent growth +2.3/5.0
- Appreciation +0.0/10.0
$199,000
🖨 Deal sheet 📄 Offer letter ✓ Due diligence
Listing remarks
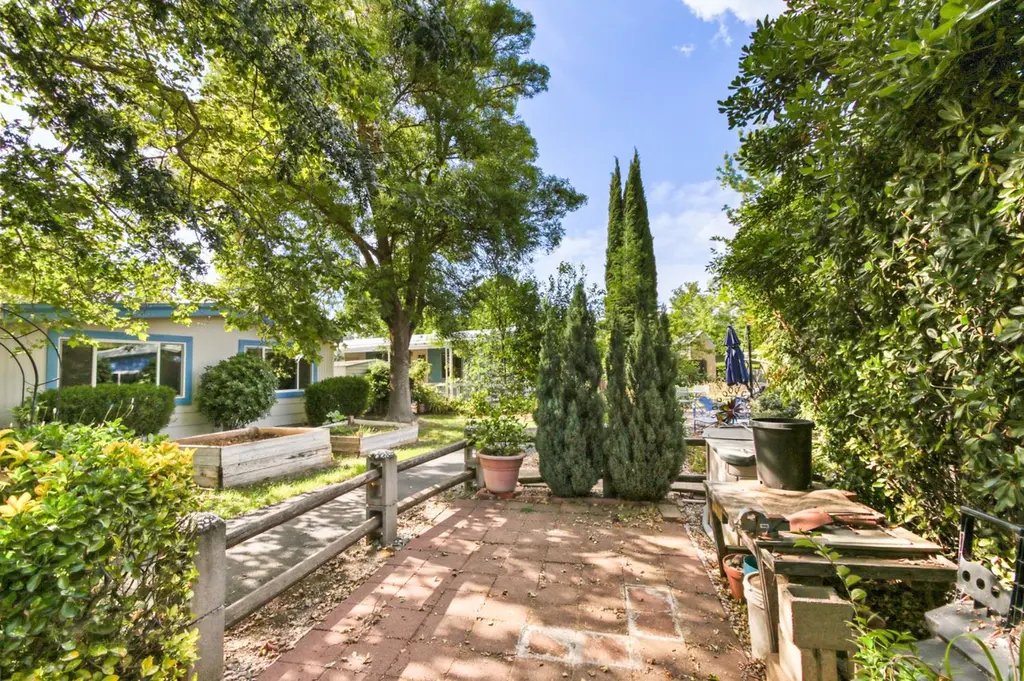
Welcome to Rancho Yolo - an enchanting 55+ community set among mature trees, vibrant gardens, and serene walking paths. Residents enjoy two swimming pools (an adults-only pool with hot tub and a family pool), a welcoming clubhouse, game room, and library. The social calendar is rich and varied exercise classes, dance classes, clubs, interest groups, potlucks, and lively dance parties featuring local live bands. Whether you're seeking quiet contemplation along the garden paths or spirited connection at a community event, Rancho Yolo offers both in equal measure. This light-filled 2 bedroom, 2 bathroom residence offers genuinely generous living space with a separate living room, formal dini
Key facts
- Serene walking paths
- Two swimming pools
- Hot tub
Tags
Property features AI
Finance
- Other: Property address: 140 Inner Cir, Davis, CA 95618
- HOA & community: Not part of an association; Located in a senior community; Land lease present ($885)
Exterior
- Parking: Attached covered parking
- Utilities: Cable available; Internet available; Individual electric meter; Individual gas meter; 220V outlet in kitchen; Public sewer; Public water
- Home design: Manufactured home located in a park; Double wide unit; Updated/remodeled condition; Manufactured by Fleetwood; Vinyl skirting; Built in 1974
- Construction: Composition roof
- Exterior features: Carport awning; Exterior storage area / shed; Regular-shaped lot, close to clubhouse
Interior
- Kitchen: Free-standing gas range; Range hood; Dishwasher; Garbage disposal; Microwave; Breakfast area and breakfast nook; Pantry cabinet; Laminate countertops; Dining and living combo / space in kitchen for dining
- Bedrooms: 2 bedrooms (including master bedroom)
- Flooring: Carpet; Linoleum
- Bathrooms: 2 full bathrooms; Bathrooms feature double sinks and shower stalls
- Heating & cooling: Central heating; Central air conditioning; Ceiling fans
- Interior features: Cathedral/vaulted living room ceiling; Dual-pane full windows; Covered and uncovered patios with porch steps; Storage shed on property; Updated/remodeled interior
- Laundry & utility: Laundry area (other-type hookup)
Neighborhood map
What this means for you Summary
Snapshot
- This is a 2-bed/2.0-bath manufactured listed at $199k. Condition is rated good.
Deal economics
- At list price, monthly cash flow is $844 ($10k/yr) — positive.
- The deal already cash-flows at list — no discount required.
- Meets the 1% rule at list price ($3k rent vs $199k).
- Recommended offer: $193k (3.0% below list) — sets the bar for market timing.
- Cap rate 11.4% vs local median 2.0% in Davis — top-decile yield for the area; either an underpriced asset or a hidden risk that comps aren't pricing in. Stress-test before assuming the spread holds.
Location & tenants
- Location reads 78/100 on livability (#71 in CA, #2,713 nationally) — a middle-class / working-renter tenant base. Strengths: schools A+, amenities A+, commute A+; Watch: cost of living F.
- Davis Joint Unified (suburban): math 76% / reading 89% proficiency, ranked #28 of 517 in CA (top 5%) — strong family-tenant draw, lease renewals of 3-5y typical; only 18% free/reduced lunch — higher-income household profile.
- Market conditions: Rents soft (-0.9%/yr); 96 active listings in the ZIP; 33 comparable units currently listed for rent nearby; rentals at typical pace (median 15d on market — plan ~3-4 weeks tenant-placement turnaround); high-income renter base; 721 units permitted in Yolo County in 2024 (260 in 5+ unit buildings).
Forward outlook
- Local home prices are declining (-3.0%/yr); year-one equity from $1k of loan paydown is wiped out by about $6k of value loss. Plan a longer hold.
- Yolo County population projected at +31% by 2050 — long-run rental-demand tailwind backs the buy-and-hold thesis.
- At projected returns (-3.0% appreciation + 0.0% rent growth), your $56k cash investment doubles in ~9 years — after that, you're playing with house money.
Negotiation context
- It's been on market 50 days — a 3% lower offer ($193k) is reasonable based on typical stale-listing flexibility.
Risks & watch-outs
- Climate carrying-cost: extreme-heat days projected 6→13/yr by 2055 (HVAC capex compounding) — expect insurance premiums to compound above CPI over the hold.
Questions for the listing agent
- It's been on market 50 days. Have you received any prior offers? Is the seller open to a 3% concession, seller financing, or rate buy-down credit?
- Built in 1974 — when were the roof, HVAC, electrical panel, plumbing, and water heater last replaced?
- Is there a deadline driving the sale (1031 exchange, divorce, estate, relocation)? That informs how much negotiation room exists.
- Schools are A-rated — typically a magnet for longer-tenancy family renters. What's the average tenant stay here, and is there a school-zone premium baked into asking?
- What's the average days-on-market for RENTAL listings here right now (not sales)? A rising rental-DOM trend means longer vacancies and softer asking-rent achievability than the comps imply.
- What's the recent tenant-quality profile in this submarket — average credit score on applications, eviction rate, late-payment / NSF rate, and stable-employment percentage? A property-management company in the area should have these aggregated.
- How much new for-sale + rental construction is in the pipeline within 1–3 miles? Heavy new supply typically softens prices + rents 12–24 months out; constrained supply supports both.
Investment metrics
- 1% rule
- 1.41% ✓
- Cap rate
- 11.38%
- Cash-on-cash
- 18.18%
- DSCR
- 1.81
- GRM
- 5.9
CMA / ARV
- ARV (median comp)
- $249,232
- List price
- $199,000
- Delta
- -20.15%
- Verdict
- UNDERPRICED
- Comps
- 20 within 1.0 mi
Show comp detail 12 sales within ~0.75 mi
| Address | Dist | Beds/Ba | Sqft | Sold | Price | $/sf | Match |
|---|---|---|---|---|---|---|---|
| 131 Full Cir | 0.02mi | 2/2.0 | 1,440 (0%) | 4mo | $220,000 | $153 | 96 |
| 130 Full Cir | 0.02mi | 2/2.0 | 1,440 (0%) | 6mo | $190,000 | $132 | 94 |
| 69 Broken Cir | 0.07mi | 2/2.0 | 1,440 (0%) | 12mo | $165,000 | $115 | 87 |
| 17 Outer Cir | 0.13mi | 2/2.0 | 1,440 (0%) | 12mo | $217,500 | $151 | 84 |
| 24 Outer Cir | 0.10mi | 2/2.0 | 1,488 (+3%) | 9mo | $195,000 | $131 | 82 |
| 141 Inner Cir | 0.01mi | 2/2.0 | 1,344 (-7%) | 10mo | $175,000 | $130 | 80 |
| 194 Full Cir | 0.11mi | 3/2.0 (+1) | 1,456 (+1%) | 12mo | $315,000 | $216 | 78 |
| 96 Full Cir | 0.05mi | 3/2.0 (+1) | 1,344 (-7%) | 5mo | $293,000 | $218 | 78 |
| 186 Full Cir | 0.06mi | 2/2.0 | 1,440 (0%) | 24mo | $251,000 | $174 | 77 |
| 230 Full Cir | 0.09mi | 3/2.0 (+1) | 1,568 (+9%) | 6mo | $312,000 | $199 | 71 |
| 259 Quarter Cir | 0.17mi | 3/2.0 (+1) | 1,440 (0%) | 23mo | $266,500 | $185 | 68 |
| 252 Quarter Cir | 0.15mi | 3/2.0 (+1) | 1,344 (-7%) | 17mo | $274,000 | $204 | 63 |
Match score weights: distance 35% · size 25% · config 20% · recency 20%. Top-matched comps best support the ARV.
Projected returns pro-forma
-3.0% appreciation · 0.0% rent growth · sell at horizon
- IRR
- 6.4%
- Equity multiple
- 1.24×
- Total profit
- $13,334
- Equity at exit
- $29,672
- IRR
- 12.9%
- Equity multiple
- 1.88×
- Total profit
- $49,204
- Equity at exit
- $17,206
Cash invested: $55,720 (down + closing). Projections, not guarantees.
Landlord ↔ Tenant lean methodology
- Overall (STATE)
- 18 Strongly Tenant-Friendly
- State California
- 18 Strongly Tenant-Friendly · D+13
- County
- — inherits STATE
- City
- — inherits STATE
ZIP-level market 95618
- Rents YoY
- -0.9%
- Active inventory
- 96
- Price-to-rent
- 5.9×
Monthly cashflow live
- Estimated rent
- $2,810 high interval (Pro) →
- Mortgage (P&I)
- −$1,044
- Tax est. 1.5%
- −$249 /mo · $2,985/yr
- Insurance
- −$83
- HOA
- −$0
- Vacancy / Maint / Mgmt
- −$590
- Net cashflow
- $844
Break-even live
UW: 25.0% down · 7.5% · 30yr · 1.5% tax · 5.0% vac · 8.0% maint · 8.0% mgmt
Financing live
Cash to close
- Down payment
- $49,750
- Closing costs
- $5,970
- Reserves months
- —
- Total cash needed
- —
Loan-product check · same deal, 3 products live
Conventional
25% down · 7.5% · 30yr
- Down + closing
- —
- Monthly P&I
- —
- Monthly cashflow
- —
- DSCR
- —
- Eligible?
- —
Personal DTI + credit; lowest rate.
DSCR
20% down · 8.5% · 30yr
- Down + closing
- —
- Monthly P&I
- —
- Monthly cashflow
- —
- DSCR
- —
- Eligible?
- —
No personal income docs; deal must DSCR.
Hard money
10% down · 12.0% · 12mo
- Down + closing
- —
- Monthly P&I
- —
- Monthly cashflow
- —
- DSCR
- —
- Eligible?
- —
Short-term bridge; refi at stabilization.
Rent comps 33 comps
| Address | Beds | Baths | Sqft | Rent | $/sqft | DOM | Units | Dist |
|---|---|---|---|---|---|---|---|---|
| 709 Adeline Pl Davis, CA | 3.0 | 2.0 | 1250 | $2,890 | $2.31 | 4d | 1 | 0.24mi |
| 709 Adeline Pl Davis, CA | 3.0 | 2.0 | 1250 | $3,400 | $2.72 | 14d | 1 | 0.24mi |
| 2505 5th St Davis, CA | 3.0 | 2.5 | 1459 | $3,153 | $2.16 | 43d | 1 | 0.24mi |
| 1615 E 8th St Davis, CA | 2.0–3.0 | 1.0–1.5 | 865 | $1,645 | $1.90 | 3d | 6 | 0.38mi |
| 2200 Whittier Dr Davis, CA | 3.0 | 1.0 | 1000 | $3,100 | $3.10 | 43d | 1 | 0.51mi |
| 516 K St Unit A Davis, CA | 3.0 | 1.0 | 940 | $2,300 | $2.45 | 7d | 1 | 0.61mi |
| 1143 Greene Ter Davis, CA | 2.0 | 2.0 | 946 | $2,850 | $3.01 | 21d | 1 | 0.61mi |
| 717 I St Davis, CA | 3.0 | 2.0 | 1172 | $3,650 | $3.11 | 17d | 1 | 0.75mi |
| 2701 Lillard Dr Davis, CA | 3.0 | 2.0 | 1425 | $3,200 | $2.25 | 43d | 1 | 0.76mi |
| 1540 Valdora St Davis, CA | 2.0–4.0 | 1.5–2.0 | 1225 | $2,199 | $1.80 | 12d | 38 | 0.87mi |
| 1880 Cowell Blvd Davis, CA | 3.0 | 2.0 | 1300 | $3,399 | $2.61 | 17d | 1 | 0.89mi |
| 1880 Cowell Blvd Davis, CA | 2.0 | 2.0 | 1080 | $2,499 | $2.31 | 43d | 1 | 0.89mi |
| 1100 Olive Dr Unit 236 Davis, CA | 2.0 | 2.0 | 1033 | $3,085 | $2.99 | 43d | 1 | 0.89mi |
| 801 2nd St Unit 301 Davis, CA | 1.0 | 1.5 | 1259 | $3,000 | $2.38 | 43d | 1 | 0.93mi |
| 811 F St Davis, CA | 1.0–2.0 | 1.0 | 825 | $2,595 | $3.15 | 14d | 1 | 0.96mi |
| 1617 Valdora St Davis, CA | 3.0 | 3.0 | 1450 | $3,395 | $2.34 | 7d | 1 | 0.97mi |
| 1660 Drew Cir Davis, CA | 2.0–4.0 | 1.0–2.5 | 1262 | $1,894 | $1.50 | 11d | 32 | 0.99mi |
| 3028 Bryant Pl Davis, CA | 1.0 | 1.0 | 1380 | $850 | $0.62 | 7d | 1 | 0.99mi |
| 1659 Drew Cir Davis, CA | 3.0–4.0 | 2.0 | 1293 | $1,100 | $0.85 | 1d | 23 | 1.01mi |
| 1703 Donner Ave #3 Davis, CA | 2.0 | 1.0 | 903 | $2,100 | $2.33 | 43d | 1 | 1.03mi |
| 1736 Valdora St Davis, CA | 3.0 | 2.0 | 987 | $3,400 | $3.44 | 3d | 1 | 1.06mi |
| 2810 Pole Line Rd #3 Davis, CA | 2.0 | 1.0 | 903 | $2,350 | $2.60 | 14d | 1 | 1.11mi |
| 3526 Verona Ter Davis, CA | 3.0 | 2.5 | 1751 | $3,600 | $2.06 | 7d | 1 | 1.12mi |
| 2842 Bidwell St Davis, CA | 2.0 | 1.0 | 1012 | $1,995 | $1.97 | 7d | 1 | 1.15mi |
| 3820 Chiles Rd Davis, CA | 3.0 | 1.0–2.0 | 995 | $3,140 | $3.16 | 43d | 1 | 1.17mi |
| 2390 Roualt St Davis, CA | 3.0 | 2.0 | 1235 | $3,400 | $2.75 | 17d | 1 | 1.18mi |
| 4005 Cowell Blvd Davis, CA | 1.0–2.0 | 1.0–2.0 | 838 | $2,400 | $2.86 | 1d | 7 | 1.22mi |
| 1661 Spring St Davis, CA | 2.0 | 2.0–2.5 | 1245 | $3,098 | $2.49 | 19d | 1 | 1.26mi |
| 207 3rd St Unit 240 Davis, CA | 3.0 | 2.0 | 1050 | $4,495 | $4.28 | 43d | 1 | 1.30mi |
| 1818 Moore Blvd Davis, CA | 2.0 | 2.0 | 1022 | $2,600 | $2.54 | 14d | 1 | 1.33mi |
| 1818 Moore Blvd Davis, CA | 2.0 | 2.0 | 1022 | $2,600 | $2.54 | 17d | 1 | 1.33mi |
| 4141 Cowell Blvd Davis, CA | 1.0–2.0 | 1.0–2.0 | 838 | $2,395 | $2.86 | 4d | 6 | 1.34mi |
| 334 Cambridge Ter Unit A Davis, CA | 3.0 | 1.5 | 1224 | $2,645 | $2.16 | 43d | 1 | 1.47mi |
Listing history 14 events
-
2026-06-18days on market $199,000 Active 50 DOM
-
2026-06-17days on market $199,000 Active 49 DOM
-
2026-06-16days on market $199,000 Active 48 DOM
-
2026-06-15days on market $199,000 Active 47 DOM
-
2026-06-13days on market $199,000 Active 45 DOM
-
2026-06-13days on market $199,000 Active 44 DOM
-
2026-06-09days on market $199,000 Active 41 DOM
-
2026-06-08days on market $199,000 Active 40 DOM
-
2026-06-07days on market $199,000 Active 39 DOM
-
2026-06-05days on market $199,000 Active 36 DOM
-
2026-06-03days on market $199,000 Active 35 DOM
-
2026-06-02days on market $199,000 Active 34 DOM
-
2026-06-01days on market $199,000 Active 33 DOM
-
2026-05-31days on market $199,000 Active 32 DOM
ⓘ Source: listings_history table (triggers on properties + properties_extension) + one-shot
backfill from property_details.listing_events for pre-trigger history.
Climate risk First Street
- Flood 3/10 Moderate FEMA zone X (unshaded) · 7% chance over 30 yrs
- Wildfire 3/10 Moderate
- Heat 6/10 Major 6 d/yr ≥103°F today · 13 d/yr by 30 yrs out
- Wind 1/10 Low
- Air quality 10/10 Extreme 27 unhealthy d/yr today · 29 by 30 yrs out
Nearby sold comps map
Loading sold comps map…
Walkable amenities ~0.75 mi
Loading nearby amenities…
Taxation est. · year 1
- Rental income
- $33,714
- − Mortgage interest
- −$11,147
- − Property taxes
- −$2,985
- − Insurance
- −$995
- − Repairs & maintenance
- −$2,697
- − Management
- −$2,697
- − Depreciation
- −$5,789
- Taxable income
- $7,404
- Est. tax owed @ 24.0%
- −$1,777
- After-tax cash flow
- $8,354/yr
For passive investors: Depreciation is non-cash, so a rental often shows a tax loss while cash-flowing — sheltering income. Rental losses are passive: they offset passive income freely, and up to $25,000/yr can offset ordinary (W-2) income if you actively participate and your MAGI is under $100k (phasing out to $0 by $150k); unused losses carry forward. On sale, claimed depreciation is recaptured at up to 25%, and gains may owe capital-gains tax (a 1031 exchange can defer both). Figures are a year-1 estimate at your 24.0% rate — not tax advice; consult a CPA.
Condition & rehab AI · 12 photos
This 2-bedroom, 2-bathroom home in Rancho Yolo is in good condition with some minor repairs needed. The property offers a great location with a swimming pool and community amenities, making it a good investment for both resale and rental.
Repairs flagged
- Minor Kitchen cabinets — Light wear and tear.
- Minor Bathroom tiles — Some wear and tear.
- Minor Exterior siding — Some discoloration visible.
- Minor Living room carpet — Some wear and tear visible.
Value-add opportunities
- Both Paint touch-ups — Fresh paint enhances curb appeal and interior aesthetics.
- Both Replace worn-out kitchen cabinets — New cabinets improve functionality and aesthetics.
- Both Replace worn-out bathroom tiles — New tiles enhance functionality and aesthetics.
- Both Landscaping improvements — Enhances curb appeal and creates a more inviting atmosphere.
Renovation cost estimate screening
| Repair item | Severity | Est. cost |
|---|---|---|
| Kitchen cabinets · Light wear and tear. | Minor | $500–3,000 |
| Bathroom tiles · Some wear and tear. | Minor | $500–3,000 |
| Exterior siding · Some discoloration visible. | Minor | $500–3,000 |
| Living room carpet · Some wear and tear visible. | Minor | $500–3,000 |
| Total estimated repair cost · 4 items | $2,000–12,000 |
Value-add ROI direction
- Both Paint touch-ups — Fresh paint enhances curb appeal and interior aesthetics. ↑
- Both Replace worn-out kitchen cabinets — New cabinets improve functionality and aesthetics. ↑
- Both Replace worn-out bathroom tiles — New tiles enhance functionality and aesthetics. ↑
- Both Landscaping improvements — Enhances curb appeal and creates a more inviting atmosphere. ↑
ⓘ Cost ranges are severity-bucket heuristics (US national rule-of-thumb). Get contractor quotes + a written scope before underwriting a rehab budget.
Schools (NCES district)
- District
- Davis Joint Unified
- NCES district ID
- 0610620
- Math proficiency
- 76% ▲ 11.00%
- Reading proficiency
- 89% ▲ 17.00%
- Median HH income
- $58,551
- Composite
- 70.5/100
- National rank
- #261
- State rank
- #28 of 517 in CA
Livability — Davis
- Score
- 78/100
- State rank
- #71
- US rank
- #2713
Category grades
Schools grade is shown separately in the Schools card above.
Census & demographics
- Census place
- Davis, CA
- County
- Yolo County · 212,115 people
- City population
- 79,897
- Metro
- Sacramento-Roseville-Folsom, CA
- Population (ZIP)
- 26,267
- Household income
- $115,591
- Rent vs Own
- Severe rent burden
- 1441.0
Population outlook (Yolo County) Hauer SSP2
- Today (2025)
- 242,183 people
- By 2030
- 257,662 · +6.4%
- By 2040
- 288,050 · +18.9%
- By 2050
- 318,202 · +31.4%
- By 2075
- 392,736 · +62.2%
- By 2100
- 438,150 · +80.9%
Race, ethnicity, and origin ACS 2023
- Neighborhood character
- Diverse neighborhood (Simpson 0.66)
- Race & ethnicity
- White 50% Asian 24% Hispanic / Latino 18% Two or more races 11% Black 3% Native American 1%
- Hispanic origin (detail)
- Mexican 12%
- Common ancestry
- Italian 7% Portuguese 2% Slovak 2%
- Foreign-born
- 24% · China, Canada, South Korea
- Languages at home
- 68% English-only · Spanish 11% Chinese 10% Other Indo-European 4%
Political lean MEDSL · Yolo
- 2024 margin
- Solid D (+36.2) · D 66.3% · R 30.1% · Other 3.6%
- 2008→2024 swing
- 0.0pp no change · 2008: 36.2pp · 2024: 36.2pp
- All cycles
- 2024: D+36.2 2020: D+41.4 2016: D+42.0 2012: D+33.2 2008: D+36.2
Not yet ingested
- Civics
- —
Market trends
- HPI YoY
- ▼ -545.15%
- Current HPI
- 291.2054
- Rent YoY
- ▼ -0.92%
- Metro
- Sacramento-Roseville-Folsom, CA
- State GDP YoY
- ▲ 3.21%
- F500 in state
- 116
Industry mix (Fortune 500 HQ in CA)
| Industry | F500 HQs | Revenue |
|---|---|---|
| Technology | 27 | $1,492B |
|
||
| Financial Services | 3 | $174B |
|
||
| Retail | 3 | $44B |
|
||
| Insurance | 3 | $26B |
|
||
| Media / Entertainment | 2 | $115B |
|
||
| Pharmaceuticals / Biotech | 2 | $62B |
|
||
Cash-flow waterfall
monthlySold comps — $/sqft
last 12 mo · ≤1 miLoading sold comps…