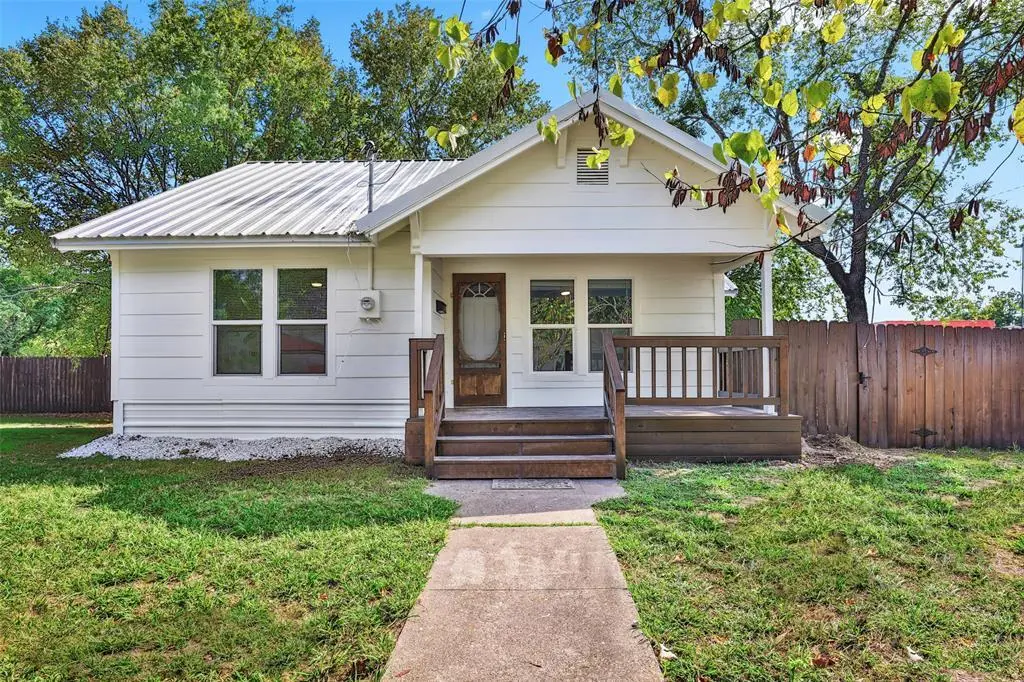
1005 N Neal St · Commerce, TX
Flood risk 1/10 · Minimal
- FEMA flood zone
- X (unshaded)
- Chance of flooding over 30 yrs
- 0.0%
- Est. flood insurance / yr
- $507 – $1,088
Fire risk 7/10 · Major
- Est. fire insurance / yr
- $1,222 – $2,270
Heat risk 7/10 · Major
- Hot days now (above 110°F)
- 7 days/yr
- Hot days in 30 yrs
- 23 days/yr
Wind risk 6/10 · Moderate
- Chance of severe wind over 30 yrs
- 27.0%
Air-quality risk 2/10 · Minimal
- Unhealthy air days now
- 1 days/yr
- Unhealthy air days in 30 yrs
- 1 days/yr
Risk factors via First Street. Map © Google.
Why this score? — see what drove the D grade
The composite is a weighted blend of 9 inputs, each scored 0–100. Each bar is that input's sub-score; the figure is the points it added to the 100-point composite (weight × sub-score).
- Cash flow +13.4/30.0
- ARV discount +12.7/15.0
- DSCR +4.0/10.0
- 1% rule +3.4/10.0
- Livability +3.2/5.0
- Rent growth +2.5/5.0
- Condition / age +2.5/5.0
- Schools +2.3/10.0
- Appreciation +0.0/10.0
$149,999
🖨 Deal sheet (PDF) 📄 Offer letter ✓ Due diligence
Listing remarks MLS
Completely renovated inside and out. This immaculate 3 bedroom, 2 full bath home features 1412 sqft on an over-sized corner lot! Recent updates include, foundation, plumbing, roof, HVAC, Siding, flooring, updated baths, interior & exterior paint, windows, fans and fixtures. No detail overlooked. Metal roof in great condition! Oversized lot that is fully fenced. Appliances including washer and dryer to convey. Right down the street from East Texas A&M University. Bring your most discerning buyers! Schedule your showing today! Priced to sell!
Key facts
- Recent updates
- Metal roof
- Fully fenced
Tags
Neighborhood map
What this means for you Summary
Snapshot
- This is a 3-bed/2.0-bath single-family listed at $150k.
Deal economics
- At list price, monthly cash flow is $3 ($38/yr) — positive.
- The deal already cash-flows at list — no discount required.
- To meet the 1% rule (rent ≥ 1% of price), the offer needs to be $126k (16.1% below list).
- Recommended offer: $126k (16.1% below list) — sets the bar for 1% rule.
- Cap rate 6.3% vs local median 2.1% in Commerce — top-decile yield for the area; either an underpriced asset or a hidden risk that comps aren't pricing in. Stress-test before assuming the spread holds.
Location & tenants
- Location reads 64/100 on livability (#737 in TX) — a middle-class / working-renter tenant base. Strengths: cost of living A+, housing A+, health & safety A-; Watch: crime C-, amenities F, commute F.
- Commerce ISD (rural): math 23% / reading 33% proficiency, ranked #687 of 826 in TX (top 83%) — low school quality limits family demand, transient renter base, plan for 1-2y turnover; 62% free/reduced lunch — lower-income household profile, screen leases tightly.
- Zoned schools: Commerce El (400 students, 78% FRL); Commerce Middle (math 21% / reading 31%, grade F, #1,222 of 1,662 statewide, top 74%, 331 students, 78% FRL); Commerce H S (math 17% / reading 52%, grade F, #963 of 1,632 statewide, top 61%, 465 students, 68% FRL).
- Market conditions: 212 active listings in the ZIP; 18 comparable units currently listed for rent nearby; rentals at typical pace (median 25d on market — plan ~3-4 weeks tenant-placement turnaround); 1,289 units permitted in Hunt County in 2024 (527 in 5+ unit buildings).
Forward outlook
- Local home prices are declining (-3.0%/yr); year-one equity from $1k of loan paydown is wiped out by about $4k of value loss. Plan a longer hold.
- Hunt County population projected at +15% by 2050 — modest demand growth; plan on rents tracking national, not racing it.
Negotiation context
- It's been on market 116 days — a 9% lower offer ($136k) is reasonable based on typical stale-listing flexibility.
- 4 sale attempts since 13y ago; this cycle's ask has dropped $24k (14%) from the opening price — seller is motivated, your offer sets the floor, not the list.
Risks & watch-outs
- Watch-outs: built in 1945 — expect roof / HVAC / electrical / plumbing capex.
- Climate carrying-cost: major wind risk, 27% chance of damaging wind over 30y; major wildfire risk; extreme-heat days projected 7→23/yr by 2055 (HVAC capex compounding) — expect insurance premiums to compound above CPI over the hold.
Questions for the listing agent
- It's been on market 116 days. Have you received any prior offers? Is the seller open to a 16% concession, seller financing, or rate buy-down credit?
- Built in 1945 — when were the roof, HVAC, electrical panel, plumbing, and water heater last replaced?
- Why hasn't it sold? Are there any deal-killer items the seller is aware of (foundation, flood, title, zoning, code violations)?
- Is there a deadline driving the sale (1031 exchange, divorce, estate, relocation)? That informs how much negotiation room exists.
- Schools are F-rated, which usually means shorter tenancies and higher turnover. Who's the typical renter profile here, and what's been the actual vacancy rate?
- The area grade is low — what's the realistic commute time and amenity access for the typical tenant pool here? Any planned neighborhood developments (good or bad) we should know about?
- What's the average days-on-market for RENTAL listings here right now (not sales)? A rising rental-DOM trend means longer vacancies and softer asking-rent achievability than the comps imply.
- What's the recent tenant-quality profile in this submarket — average credit score on applications, eviction rate, late-payment / NSF rate, and stable-employment percentage? A property-management company in the area should have these aggregated.
- How much new for-sale + rental construction is in the pipeline within 1–3 miles? Heavy new supply typically softens prices + rents 12–24 months out; constrained supply supports both.
Investment metrics
- 1% rule
- 0.84% ✗
- Cap rate
- 6.32%
- Cash-on-cash
- 0.09%
- DSCR
- 1.00
- GRM
- 9.9
CMA / ARV
- ARV (median comp)
- $169,536
- List price
- $149,999
- Delta
- -11.52%
- Verdict
- UNDERPRICED
- Comps
- 20 within 1.0 mi
Show comp detail 3 sales within ~0.75 mi
| Address | Dist | Beds/Ba | Sqft | Sold | Price | $/sf | Match |
|---|---|---|---|---|---|---|---|
| 1000 Harrison St | 0.05mi | 2/1.0 (-1) | 1,008 (-0%) | 3mo | $145,000 | $144 | 86 |
| 1212 Earl St | 0.65mi | 3/1.0 | 1,026 (+1%) | 20mo | $70,000 | $68 | 46 |
| 501 Chestnut | 0.72mi | 2/1.0 (-1) | 956 (-6%) | 23mo | $119,900 | $125 | 29 |
Match score weights: distance 35% · size 25% · config 20% · recency 20%. Top-matched comps best support the ARV.
Projected returns pro-forma
-3.0% appreciation · 3.0% rent growth · sell at horizon
- IRR
- -16.2%
- Equity multiple
- 0.43×
- Total profit
- $-24,113
- Equity at exit
- $22,365
- IRR
- -7.9%
- Equity multiple
- 0.51×
- Total profit
- $-20,774
- Equity at exit
- $12,969
Cash invested: $42,000 (down + closing). Projections, not guarantees.
Landlord ↔ Tenant lean methodology
- Overall (STATE)
- 87 Strongly Landlord-Friendly
- State Texas
- 87 Strongly Landlord-Friendly · R+5
- County
- — inherits STATE
- City
- — inherits STATE
ZIP-level market 75428
- Home prices YoY
- -6.5%
- Active inventory
- 212
- Price-to-rent
- 9.9×
Monthly cashflow live
- Estimated rent
- $1,258 high interval (Pro) →
- Mortgage (P&I)
- −$787
- Tax from tax record
- −$142 /mo · $1,702/yr
- Insurance
- −$62
- HOA
- −$0
- Lot rent
- −$0
- Vacancy / Maint / Mgmt
- −$264
- Net cashflow
- $3
Break-even live
Sensitivity live
| Price | -10% $88 | -5% $46 | +0% $3 | +5% $-39 | +10% $-82 |
|---|---|---|---|---|---|
| Rent | -10% $-96 | -5% $-47 | +0% $3 | +5% $53 | +10% $103 |
| Rate | -1.0pp $79 | -0.5pp $41 | base $3 | +0.5pp $-36 | +1.0pp $-75 |
UW: 25.0% down · 7.5% · 30yr · 1.5% tax · 5.0% vac · 8.0% maint · 8.0% mgmt
Financing live
Cash to close
- Down payment
- $37,500
- Closing costs
- $4,500
- Reserves months
- —
- Total cash needed
- —
Loan-product check · same deal, 3 products live
Conventional
25% down · 7.5% · 30yr
- Down + closing
- —
- Monthly P&I
- —
- Monthly cashflow
- —
- DSCR
- —
- Eligible?
- —
Personal DTI + credit; lowest rate.
DSCR
20% down · 8.5% · 30yr
- Down + closing
- —
- Monthly P&I
- —
- Monthly cashflow
- —
- DSCR
- —
- Eligible?
- —
No personal income docs; deal must DSCR.
Hard money
10% down · 12.0% · 12mo
- Down + closing
- —
- Monthly P&I
- —
- Monthly cashflow
- —
- DSCR
- —
- Eligible?
- —
Short-term bridge; refi at stabilization.
Rent comps 18 comps
| Address | Beds | Baths | Sqft | Rent | $/sqft | DOM | Units | Dist |
|---|---|---|---|---|---|---|---|---|
| 904 N Neal St Commerce, TX | 2.0 | 1.0 | 1033 | $1,250 | $1.21 | 17d | 1 | 0.12mi |
| 904 N Neal St Commerce, TX | 2.0 | 1.0 | 1033 | $1,250 | $1.21 | 14d | 1 | 0.12mi |
| 1004 Park St Commerce, TX | 3.0 | 1.0 | 1082 | $925 | $0.85 | 19d | 1 | 0.19mi |
| 811 Bishop St Commerce, TX | 2.0 | 1.0 | 810 | $850 | $1.05 | 46d | 1 | 0.22mi |
| 1315 Oneal St Unit B Commerce, TX | 3.0 | 2.0 | 1007 | $1,275 | $1.27 | 4d | 1 | 0.27mi |
| 1315 Oneal St Commerce, TX | 3.0 | 2.0 | 1007 | $1,600 | $1.59 | 0d | 1 | 0.27mi |
| 800 Sycamore St Commerce, TX | 2.0 | 2.0 | 1045 | $1,200 | $1.15 | 46d | 1 | 0.44mi |
| 1313 Hunt St Commerce, TX | 3.0 | 2.0 | 1100 | $2,400 | $2.18 | 46d | 1 | 0.69mi |
| 1618 Bois D'Arc St Unit 102 Commerce, TX | 2.0 | 2.0 | 1000 | $895 | $0.90 | 24d | 1 | 0.76mi |
| 2004 Pecan St Commerce, TX | 2.0 | 3.0 | 1014 | $1,200 | $1.18 | 46d | 1 | 0.82mi |
| 1814 Hunt St Unit 1805 6 Commerce, TX | 2.0 | 1.5 | 872 | $995 | $1.14 | 27d | 1 | 0.82mi |
| 1814 Hunt St Unit 1809 Commerce, TX | 2.0 | 1.5 | 872 | $995 | $1.14 | 46d | 1 | 0.82mi |
| 1814 Hunt St Unit 1303 Commerce, TX | 2.0 | 1.0 | 700 | $925 | $1.32 | 46d | 1 | 0.82mi |
| 600 Maple St Commerce, TX | 4.0 | 4.0 | 1400 | $800 | $0.57 | 27d | 1 | 0.90mi |
| 409 Maple St Unit 409A Commerce, TX | 3.0 | 2.0 | 1098 | $625 | $0.57 | 1d | 1 | 1.10mi |
| 801 Culver St Unit C209 Commerce, TX | 3.0 | 1.0 | 1053 | $1,175 | $1.12 | 21d | 1 | 1.40mi |
| 801 Culver St Unit A05 Commerce, TX | 2.0 | 1.5 | 870 | $1,025 | $1.18 | 0d | 1 | 1.40mi |
| 801 Culver St Unit D209 Commerce, TX | 2.0 | 2.0 | 770 | $1,250 | $1.62 | 3d | 1 | 1.44mi |
Listing history 31 events
-
2026-06-22days on market $149,999 Active 116 DOM
-
2026-06-21days on market $149,999 Active 115 DOM
-
2026-06-18days on market $149,999 Active 112 DOM
-
2026-06-17days on market $149,999 Active 111 DOM
-
2026-06-16days on market $149,999 Active 110 DOM
-
2026-06-15days on market $149,999 Active 109 DOM
-
2026-06-13days on market $149,999 Active 107 DOM
-
2026-06-13days on market $149,999 Active 106 DOM
-
2026-06-09days on market $149,999 Active 103 DOM
-
2026-06-08days on market $149,999 Active 102 DOM
-
2026-06-07days on market $149,999 Active 101 DOM
-
2026-06-04pricedays on market $149,999 Active 98 DOM
-
2026-06-03days on market $168,999 Active 97 DOM
-
2026-06-02days on market $168,999 Active 96 DOM
-
2026-06-01days on market $168,999 Active 95 DOM
-
2026-05-31days on market $168,999 Active 94 DOM
-
2026-04-12price $168,999 556-char remark
Show marketing remark (556 chars)
Completely renovated inside and out. This immaculate 3 bedroom, 2 full bath home features 1412 sqft on an over-sized corner lot! Recent updates include, foundation, plumbing, roof, HVAC, Siding, flooring, updated baths, interior & exterior paint, windows, fans and fixtures. No detail overlooked. Metal roof in great condition! Oversized lot that is fully fenced. Appliances including washer and dryer to convey. Right down the street from East Texas A&M University. Bring your most discerning buyers! Schedule your showing today! Priced to sell!
-
2026-03-20price $169,000 556-char remark
Show marketing remark (556 chars)
Completely renovated inside and out. This immaculate 3 bedroom, 2 full bath home features 1412 sqft on an over-sized corner lot! Recent updates include, foundation, plumbing, roof, HVAC, Siding, flooring, updated baths, interior & exterior paint, windows, fans and fixtures. No detail overlooked. Metal roof in great condition! Oversized lot that is fully fenced. Appliances including washer and dryer to convey. Right down the street from East Texas A&M University. Bring your most discerning buyers! Schedule your showing today! Priced to sell!
-
2026-02-26$174,000 Active 556-char remark
Show marketing remark (556 chars)
Completely renovated inside and out. This immaculate 3 bedroom, 2 full bath home features 1412 sqft on an over-sized corner lot! Recent updates include, foundation, plumbing, roof, HVAC, Siding, flooring, updated baths, interior & exterior paint, windows, fans and fixtures. No detail overlooked. Metal roof in great condition! Oversized lot that is fully fenced. Appliances including washer and dryer to convey. Right down the street from East Texas A&M University. Bring your most discerning buyers! Schedule your showing today! Priced to sell!
-
2026-01-17historical
-
2025-12-11price $174,999
-
2025-10-30price $179,999
-
2025-10-07price $185,000
-
2025-09-18$199,999 Active
-
2019-06-19soldstatus
-
2018-12-21historical
-
2018-12-20$55,000 Active
-
2018-05-11soldstatus
-
2014-06-01historical
-
2013-12-17$25,000 Active
-
1993-07-14soldstatus
ⓘ Source: listings_history table (triggers on properties + properties_extension) + one-shot
backfill from property_details.listing_events for pre-trigger history.
Tax reassessment forecast TX · Resets to sale price
- Current annual tax
- $1,702 · $142/mo
- Projected year-2 tax
- $2,745 · $229/mo
- Expected delta
- +$1,043/yr (+$87/mo · 61.3%)
ⓘ Screening estimate from a state-policy table — verify with the county assessor before closing.
Climate risk First Street
- Flood 1/10 Low FEMA zone X (unshaded) · 0% chance over 30 yrs
- Wildfire 7/10 Severe
- Heat 7/10 Severe 7 d/yr ≥110°F today · 23 d/yr by 30 yrs out
- Wind 6/10 Major 27% chance of damaging wind over 30 yrs
- Air quality 2/10 Low 1 unhealthy d/yr today · 1 by 30 yrs out
Nearby sold comps map
Loading sold comps map…
Walkable amenities ~0.75 mi
Loading nearby amenities…
Taxation est. · year 1
- Rental income
- $15,100
- − Mortgage interest
- −$8,402
- − Property taxes
- −$1,702
- − Insurance
- −$750
- − Repairs & maintenance
- −$1,208
- − Management
- −$1,208
- − Depreciation
- −$4,364
- Taxable loss
- −$2,533
- Est. tax savings @ 24.0%
- +$608
- After-tax cash flow
- $646/yr
For passive investors: Depreciation is non-cash, so a rental often shows a tax loss while cash-flowing — sheltering income. Rental losses are passive: they offset passive income freely, and up to $25,000/yr can offset ordinary (W-2) income if you actively participate and your MAGI is under $100k (phasing out to $0 by $150k); unused losses carry forward. On sale, claimed depreciation is recaptured at up to 25%, and gains may owe capital-gains tax (a 1031 exchange can defer both). Figures are a year-1 estimate at your 24.0% rate — not tax advice; consult a CPA.
Schools (NCES district)
- District
- Commerce ISD
- NCES district ID
- 4814820
- Math proficiency
- 23% ▼ -10.00%
- Reading proficiency
- 33% ▬ 0.00%
- Median HH income
- $34,295
- Composite
- 23.01/100
- National rank
- #7977
- State rank
- #687 of 826 in TX
Livability — Commerce
- Score
- 64/100
- State rank
- #737
- US rank
- #13696
Category grades
Schools grade is shown separately in the Schools card above.
Census & demographics
- Census place
- Commerce, TX
- County
- Hunt County · 71,969 people
- City population
- 11,531
- Metro
- Dallas-Fort Worth-Arlington, TX
- Population (ZIP)
- 11,531
- Household income
- $51,424
- Rent vs Own
- Severe rent burden
- 546.0
Population outlook (Hunt County) Hauer SSP2
- Today (2025)
- 97,090 people
- By 2030
- 100,452 · +3.5%
- By 2040
- 106,544 · +9.7%
- By 2050
- 111,218 · +14.6%
- By 2075
- 121,695 · +25.3%
- By 2100
- 123,683 · +27.4%
Race, ethnicity, and origin ACS 2023
- Neighborhood character
- Diverse neighborhood (Simpson 0.63)
- Race & ethnicity
- White 55% Hispanic / Latino 23% Black 14% Two or more races 9% Asian 2% Native American 1%
- Hispanic origin (detail)
- Mexican 19%
- Common ancestry
- Slovak 2% Romanian 2% Lithuanian 2%
- Foreign-born
- 9% · Canada, China
- Languages at home
- 79% English-only · Spanish 16% Other Indo-European 1% German/W. Germanic 1%
Political lean MEDSL · Hunt
- 2024 margin
- Solid R (+55.5) · D 21.9% · R 77.4%
- 2008→2024 swing
- -14.9pp toward R · 2008: -40.6pp · 2024: -55.5pp
- All cycles
- 2024: R+55.5 2020: R+52.5 2016: R+56.3 2012: R+51.2 2008: R+40.6
Not yet ingested
- Civics
- —
Market trends
- HPI YoY
- ▼ -20.08%
- Current HPI
- 289.0436
- Rent YoY
- —
- Metro
- Dallas-Fort Worth-Arlington, TX
- State GDP YoY
- ▲ 3.95%
- F500 in state
- 110
Industry mix (Fortune 500 HQ in TX)
| Industry | F500 HQs | Revenue |
|---|---|---|
| Energy | 16 | $1,198B |
|
||
| Technology | 5 | $198B |
|
||
| Engineering / Construction | 4 | $72B |
|
||
| Energy Services | 3 | $60B |
|
||
| Utilities | 3 | $41B |
|
||
| Healthcare | 2 | $330B |
|
||
Price history
+576.0% since first listed15 events — show timeline
- 2026-04-12 Price Changed $168,999 NTREIS
- 2026-03-20 Price Changed $169,000 NTREIS
- 2026-02-26 Listed $174,000 NTREIS
- 2026-01-17 Listing Removed — NTREIS
- 2025-12-11 Price Changed $174,999 NTREIS
- 2025-10-30 Price Changed $179,999 NTREIS
- 2025-10-07 Price Changed $185,000 NTREIS
- 2025-09-18 Listed $199,999 NTREIS
- 2019-06-19 Sold (Public Records) — Public Records
- 2018-12-21 Listing Removed — NTREIS
- 2018-12-20 Listed $55,000 NTREIS
- 2018-05-11 Sold (Public Records) — Public Records
- 2014-06-01 Listing Removed — NTREIS
- 2013-12-17 Listed $25,000 NTREIS
- 1993-07-14 Sold (Public Records) — Public Records
Property tax history
+5.9%/yrLatest (2025): $1,702 · +6.1% YoY. Source: county tax records.
Cash-flow waterfall
monthlySold comps — $/sqft
last 12 mo · ≤1 miLoading sold comps…