 Multi-family
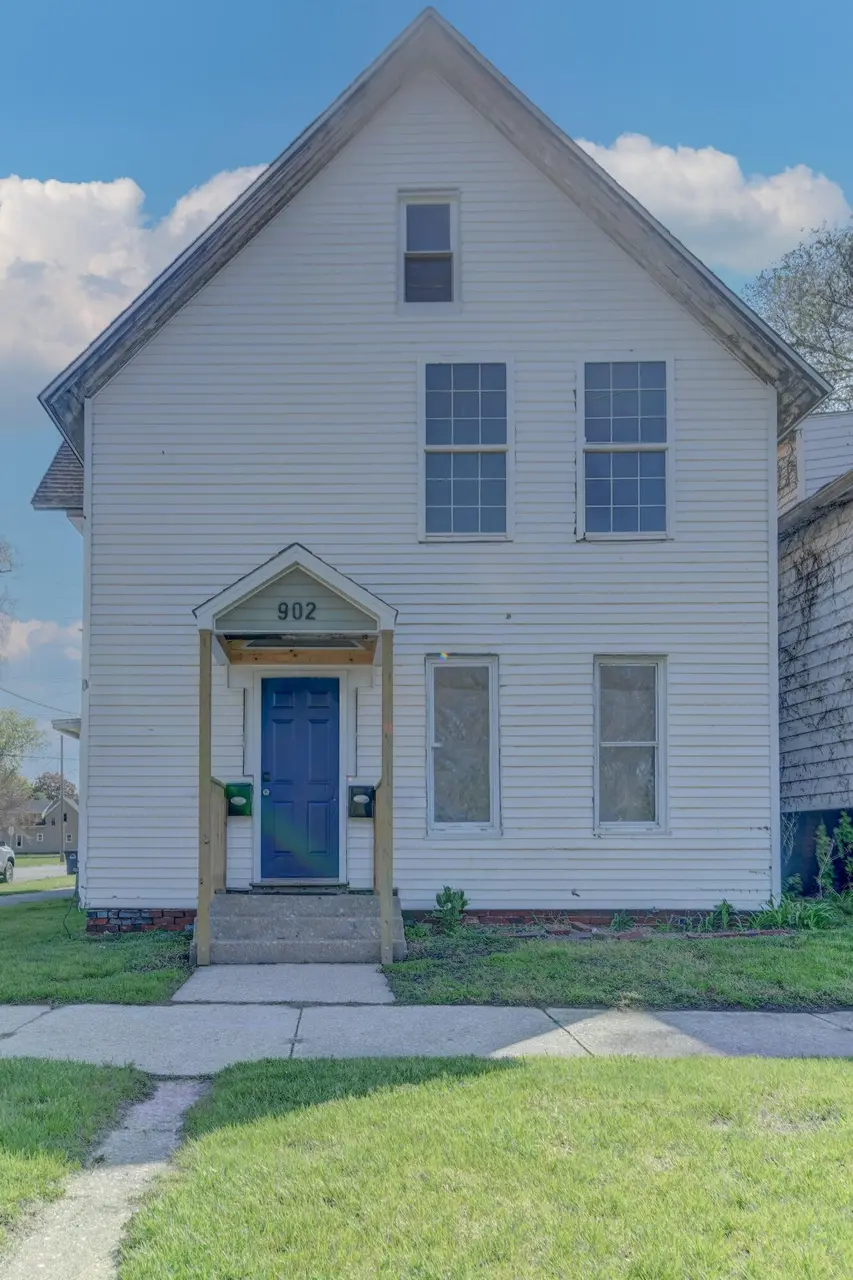
902 Kentucky St · Michigan City, IN
Flood risk 1/10 · Minimal
- FEMA flood zone
- X (unshaded)
- Chance of flooding over 30 yrs
- 0.0%
- Est. flood insurance / yr
- $473 – $860
Fire risk 3/10 · Minor
- Est. fire insurance / yr
- $717 – $1,331
Heat risk 3/10 · Minor
- Hot days now (above 99°F)
- 7 days/yr
- Hot days in 30 yrs
- 14 days/yr
Wind risk 2/10 · Minimal
- Chance of severe wind over 30 yrs
- —
Air-quality risk 3/10 · Minor
- Unhealthy air days now
- 2 days/yr
- Unhealthy air days in 30 yrs
- 3 days/yr
Risk factors via First Street. Map © Google.
Why this score? — see what drove the B- grade
The composite is a weighted blend of 9 inputs, each scored 0–100. Each bar is that input's sub-score; the figure is the points it added to the 100-point composite (weight × sub-score).
- Cash flow +29.0/30.0
- DSCR +10.0/10.0
- 1% rule +7.8/10.0
- ARV discount +7.5/15.0
- Rent growth +4.9/5.0
- Livability +4.0/5.0
- Condition / age +2.5/5.0
- Schools +2.2/10.0
- Appreciation +0.0/10.0
$220,000
🖨 Deal sheet (PDF) 📄 Offer letter ✓ Due diligence
Multi-family units
County records classify this as Multi-Family (2-4 Unit). Listing-text estimate: 1 unit. estimate disagrees with records
Listing remarks MLS
This property is zoned multi family residential but is currently used as a single family residence. Both floors have kitchens and baths. The main floor converted a bedroom into a laundry room. There is only 1 electrical service and 1 water heater but two furnaces. Home has two separate entrances. Sits on a nice size corner lot near outlet mall and short drive to the beach.
Key facts
- Centrally located
- Near restaurants
- Near outlet mall
Tags
Property features AI
Finance
- Other: Multi-unit building with 2 total units; currently vacant; 12 total rooms; Above-grade finished area reported by assessor
Exterior
- Parking: On-street parking
- Security: Carbon monoxide detector(s); Smoke detector(s)
- Utilities: Public water; Public sewer; Sewer connected; Water connected
- Home design: Two-story building; Built in 1900
- Construction: Asphalt shingle roof; Unfinished walk-out basement
- Exterior features: Private yard; Shed(s); City and neighborhood views
Interior
- Kitchen: Gas range; Refrigerator
- Bedrooms: Two-bedroom unit (one of the building's units); Three-bedroom unit (one of the building's units)
- Flooring: Carpet; Tile; Laminate
- Bathrooms: 2 full bathrooms (total in the building)
- Heating & cooling: Forced air heating; Ceiling fan(s) for cooling
- Interior features: Ceiling fans; Carbon monoxide detector(s); Smoke detector(s)
- Laundry & utility: Main level laundry; Gas water heater
Neighborhood map
What this means for you Summary
Snapshot
- This is a 4-bed/2.0-bath multifamily listed at $220k.
Deal economics
- At list price, monthly cash flow is $756 ($9k/yr) — positive.
- The deal already cash-flows at list — no discount required.
- Meets the 1% rule at list price ($3k rent vs $220k).
- Recommended offer: $213k (3.0% below list) — sets the bar for market timing.
- Cap rate 10.4% vs local median 2.7% in Michigan City — top-decile yield for the area; either an underpriced asset or a hidden risk that comps aren't pricing in. Stress-test before assuming the spread holds.
Location & tenants
- Location reads 81/100 on livability (#15 in IN, #1,317 nationally) — a professional / high-income tenant draw. Strengths: commute A+, cost of living A+, housing A+; Watch: employment D, schools D-, amenities D-.
- Michigan City Area Schools (urban): math 23% / reading 28% proficiency, ranked #262 of 301 in IN (top 87%) — low school quality limits family demand, transient renter base, plan for 1-2y turnover; 68% free/reduced lunch — lower-income household profile, screen leases tightly.
- Market conditions: Rents rising fast (+9.7%/yr); 371 active listings in the ZIP; 216 units permitted in LaPorte County in 2024 (75 in 5+ unit buildings).
- At $2,824/mo this rent would consume 57% of the median local household income ($59k/yr) (locally 1152% of renters already pay >50% of income on rent) — very limited rent-growth headroom before tenants either downsize or default.
Forward outlook
- Local home prices are declining (-3.0%/yr); year-one equity from $2k of loan paydown is wiped out by about $7k of value loss. Plan a longer hold.
- LaPorte County population projected to shrink 7% by 2050 — rents likely to lag national; underwrite the cash flow, not the appreciation.
- At projected returns (-3.0% appreciation + 8.0% rent growth), your $62k cash investment doubles in ~6 years — after that, you're playing with house money.
Negotiation context
- It's been on market 49 days — a 3% lower offer ($213k) is reasonable based on typical stale-listing flexibility.
- 3 sale attempts with the ask held roughly flat each time — persistent listings suggest the price (not the market) is what's stuck; bring a comps-based counter.
- Current owner paid $110k; list at $220k implies a 100% gain — meaningful room to come down on a strong offer.
Risks & watch-outs
- Watch-outs: built in 1900 — expect roof / HVAC / electrical / plumbing capex.
Questions for the listing agent
- It's been on market 49 days. Have you received any prior offers? Is the seller open to a 3% concession, seller financing, or rate buy-down credit?
- Built in 1900 — when were the roof, HVAC, electrical panel, plumbing, and water heater last replaced?
- Is there a deadline driving the sale (1031 exchange, divorce, estate, relocation)? That informs how much negotiation room exists.
- Schools are D-rated, which usually means shorter tenancies and higher turnover. Who's the typical renter profile here, and what's been the actual vacancy rate?
- What's the average days-on-market for RENTAL listings here right now (not sales)? A rising rental-DOM trend means longer vacancies and softer asking-rent achievability than the comps imply.
- What's the recent tenant-quality profile in this submarket — average credit score on applications, eviction rate, late-payment / NSF rate, and stable-employment percentage? A property-management company in the area should have these aggregated.
- How much new apartment / multifamily construction is in the pipeline within 1–3 miles? Heavy new supply (>2% of stock underway) typically softens rents 12–24 months out; light construction supports rent growth.
Investment metrics
- 1% rule
- 1.28% ✓
- Cap rate
- 10.42%
- Cash-on-cash
- 14.73%
- DSCR
- 1.66
- GRM
- 6.5
CMA / ARV
- ARV (median comp)
- $120,011
- List price
- $220,000
- Delta
- 83.32%
- Verdict
- OVERPRICED
- Comps
- 20 within 1.0 mi
Projected returns pro-forma
-3.0% appreciation · 8.0% rent growth · sell at horizon
- IRR
- 10.7%
- Equity multiple
- 1.45×
- Total profit
- $27,445
- Equity at exit
- $32,803
- IRR
- 23.4%
- Equity multiple
- 3.50×
- Total profit
- $153,893
- Equity at exit
- $19,022
Cash invested: $61,600 (down + closing). Projections, not guarantees.
Landlord ↔ Tenant lean methodology
- Overall (STATE)
- 90 Strongly Landlord-Friendly
- State Indiana
- 90 Strongly Landlord-Friendly · R+11
- County
- — inherits STATE
- City
- — inherits STATE
ZIP-level market 46360
- Rents YoY
- 9.7%
- Active inventory
- 371
- Price-to-rent
- 12.1×
Monthly cashflow live
- Estimated rent
- $2,824 high interval (Pro) →
- Mortgage (P&I)
- −$1,154
- Tax from tax record
- −$230 /mo · $2,754/yr
- Insurance
- −$92
- HOA
- −$0
- Vacancy / Maint / Mgmt
- −$593
- Net cashflow
- $756
Break-even live
Sensitivity live
| Price | -10% $881 | -5% $818 | +0% $756 | +5% $694 | +10% $632 |
|---|---|---|---|---|---|
| Rent | -10% $533 | -5% $645 | +0% $756 | +5% $868 | +10% $979 |
| Rate | -1.0pp $867 | -0.5pp $812 | base $756 | +0.5pp $699 | +1.0pp $641 |
2-unit breakdown (identical units grouped — click to expand)
| Units | Beds | Baths | Est. rent |
|---|---|---|---|
| 1× unit | 3 | 1 | $1,516 |
| 1× unit | 2 | 1 | $1,308 |
| Total (2 units) | $2,824 | ||
UW: 25.0% down · 7.5% · 30yr · 1.5% tax · 5.0% vac · 8.0% maint · 8.0% mgmt
Financing live
Cash to close
- Down payment
- $55,000
- Closing costs
- $6,600
- Reserves months
- —
- Total cash needed
- —
Loan-product check · same deal, 3 products live
Conventional
25% down · 7.5% · 30yr
- Down + closing
- —
- Monthly P&I
- —
- Monthly cashflow
- —
- DSCR
- —
- Eligible?
- —
Personal DTI + credit; lowest rate.
DSCR
20% down · 8.5% · 30yr
- Down + closing
- —
- Monthly P&I
- —
- Monthly cashflow
- —
- DSCR
- —
- Eligible?
- —
No personal income docs; deal must DSCR.
Hard money
10% down · 12.0% · 12mo
- Down + closing
- —
- Monthly P&I
- —
- Monthly cashflow
- —
- DSCR
- —
- Eligible?
- —
Short-term bridge; refi at stabilization.
Listing history 24 events
-
2026-06-19days on market $220,000 Active 49 DOM
-
2026-06-18days on market $220,000 Active 48 DOM
-
2026-06-17days on market $220,000 Active 47 DOM
-
2026-06-16days on market $220,000 Active 46 DOM
-
2026-06-15days on market $220,000 Active 45 DOM
-
2026-06-14days on market $220,000 Active 43 DOM
-
2026-06-13days on market $220,000 Active 42 DOM
-
2026-06-10days on market $220,000 Active 40 DOM
-
2026-06-09days on market $220,000 Active 39 DOM
-
2026-06-08days on market $220,000 Active 38 DOM
-
2026-06-07days on market $220,000 Active 37 DOM
-
2026-06-03days on market $220,000 Active 33 DOM
-
2026-06-02days on market $220,000 Active 32 DOM
-
2026-06-01days on market $220,000 Active 31 DOM
-
2026-05-31days on market $220,000 Active 30 DOM
-
2026-05-30days on market $220,000 Active 29 DOM
-
2026-05-01$220,000 Active 530-char remark
-
2025-12-29status Pending 376-char remark
Show marketing remark (376 chars)
This property is zoned multi family residential but is currently used as a single family residence. Both floors have kitchens and baths. The main floor converted a bedroom into a laundry room. There is only 1 electrical service and 1 water heater but two furnaces. Home has two separate entrances. Sits on a nice size corner lot near outlet mall and short drive to the beach.
-
2025-12-29soldstatus $110,000 Closed 376-char remark
Show marketing remark (376 chars)
This property is zoned multi family residential but is currently used as a single family residence. Both floors have kitchens and baths. The main floor converted a bedroom into a laundry room. There is only 1 electrical service and 1 water heater but two furnaces. Home has two separate entrances. Sits on a nice size corner lot near outlet mall and short drive to the beach.
-
2025-12-29soldstatus $110,000 Closed
Show marketing remark (376 chars)
This property is zoned multi family residential but is currently used as a single family residence. Both floors have kitchens and baths. The main floor converted a bedroom into a laundry room. There is only 1 electrical service and 1 water heater but two furnaces. Home has two separate entrances. Sits on a nice size corner lot near outlet mall and short drive to the beach.
-
2025-11-15historical Active Under Contract 376-char remark
Show marketing remark (376 chars)
This property is zoned multi family residential but is currently used as a single family residence. Both floors have kitchens and baths. The main floor converted a bedroom into a laundry room. There is only 1 electrical service and 1 water heater but two furnaces. Home has two separate entrances. Sits on a nice size corner lot near outlet mall and short drive to the beach.
-
2025-11-15historical Active Under Contract
Show marketing remark (376 chars)
This property is zoned multi family residential but is currently used as a single family residence. Both floors have kitchens and baths. The main floor converted a bedroom into a laundry room. There is only 1 electrical service and 1 water heater but two furnaces. Home has two separate entrances. Sits on a nice size corner lot near outlet mall and short drive to the beach.
-
2025-10-28$110,000 Active 376-char remark
Show marketing remark (376 chars)
This property is zoned multi family residential but is currently used as a single family residence. Both floors have kitchens and baths. The main floor converted a bedroom into a laundry room. There is only 1 electrical service and 1 water heater but two furnaces. Home has two separate entrances. Sits on a nice size corner lot near outlet mall and short drive to the beach.
-
2025-10-28$110,000 Active
Show marketing remark (376 chars)
This property is zoned multi family residential but is currently used as a single family residence. Both floors have kitchens and baths. The main floor converted a bedroom into a laundry room. There is only 1 electrical service and 1 water heater but two furnaces. Home has two separate entrances. Sits on a nice size corner lot near outlet mall and short drive to the beach.
ⓘ Source: listings_history table (triggers on properties + properties_extension) + one-shot
backfill from property_details.listing_events for pre-trigger history.
Tax reassessment forecast IN · Partial reset (capped growth)
- Current annual tax
- $2,754 · $230/mo
- Projected year-2 tax
- $2,754 · $230/mo
- Expected delta
- $0/yr ($0/mo · 0.0%)
ⓘ Screening estimate from a state-policy table — verify with the county assessor before closing.
Climate risk First Street
- Flood 1/10 Low FEMA zone X (unshaded) · 0% chance over 30 yrs
- Wildfire 3/10 Moderate
- Heat 3/10 Moderate 7 d/yr ≥99°F today · 14 d/yr by 30 yrs out
- Wind 2/10 Low
- Air quality 3/10 Moderate 2 unhealthy d/yr today · 3 by 30 yrs out
Nearby sold comps map
Loading sold comps map…
Walkable amenities ~0.75 mi
Loading nearby amenities…
Taxation est. · year 1
- Rental income
- $33,888
- − Mortgage interest
- −$12,323
- − Property taxes
- −$2,754
- − Insurance
- −$1,100
- − Repairs & maintenance
- −$2,711
- − Management
- −$2,711
- − Depreciation
- −$6,400
- Taxable income
- $5,888
- Est. tax owed @ 24.0%
- −$1,413
- After-tax cash flow
- $7,660/yr
For passive investors: Depreciation is non-cash, so a rental often shows a tax loss while cash-flowing — sheltering income. Rental losses are passive: they offset passive income freely, and up to $25,000/yr can offset ordinary (W-2) income if you actively participate and your MAGI is under $100k (phasing out to $0 by $150k); unused losses carry forward. On sale, claimed depreciation is recaptured at up to 25%, and gains may owe capital-gains tax (a 1031 exchange can defer both). Figures are a year-1 estimate at your 24.0% rate — not tax advice; consult a CPA.
Schools (NCES district)
- District
- Michigan City Area Schools
- NCES district ID
- 1806570
- Math proficiency
- 23% ▼ -16.00%
- Reading proficiency
- 28% ▼ -10.00%
- Median HH income
- $42,629
- Composite
- 21.76/100
- National rank
- #8257
- State rank
- #262 of 301 in IN
Livability — Michigan City
- Score
- 81/100
- State rank
- #15
- US rank
- #1317
Category grades
Schools grade is shown separately in the Schools card above.
Census & demographics
- Census place
- Michigan City, IN
- County
- La Porte County · 88,580 people
- City population
- 43,817
- Metro
- Michigan City-La Porte, IN
- Population (ZIP)
- 43,817
- Household income
- $59,266
- Rent vs Own
- Severe rent burden
- 1152.0
Population outlook (LaPorte County) Hauer SSP2
- Today (2025)
- 109,757 people
- By 2030
- 108,288 · -1.3%
- By 2040
- 105,070 · -4.3%
- By 2050
- 102,330 · -6.8%
- By 2075
- 97,009 · -11.6%
- By 2100
- 86,459 · -21.2%
Race, ethnicity, and origin ACS 2023
- Neighborhood character
- Predominantly White (67%)
- Race & ethnicity
- White 67% Black 20% Hispanic / Latino 8% Two or more races 7%
- Hispanic origin (detail)
- Mexican 5%
- Common ancestry
- Romanian 11% Lithuanian 2% Iranian 1%
- Foreign-born
- 3% · Canada
- Languages at home
- 95% English-only · Spanish 3%
Political lean MEDSL · LaPorte
- 2024 margin
- R (+14.1) · D 42.1% · R 56.2% · Other 1.7%
- 2008→2024 swing
- -19.1pp toward R · 2008: 5.0pp · 2024: -14.1pp
- All cycles
- 2024: R+14.1 2020: R+7.2 2016: R+6.4 2012: D+12.6 2008: D+5.0
Not yet ingested
- Civics
- —
Market trends
- HPI YoY
- ▼ -210.27%
- Current HPI
- 206.0882
- Rent YoY
- ▲ 9.72%
- Metro
- Michigan City-La Porte, IN
- State GDP YoY
- ▲ 2.90%
- F500 in state
- 18
Industry mix (Fortune 500 HQ in IN)
| Industry | F500 HQs | Revenue |
|---|---|---|
| Industrial Machinery | 2 | $37B |
|
||
| Healthcare | 1 | $177B |
|
||
| Pharmaceuticals | 1 | $45B |
|
||
| Metals / Steel | 1 | $18B |
|
||
| Agriculture | 1 | $17B |
|
||
| Packaging | 1 | $12B |
|
||
Price history
+100.0% since first listed8 events — show timeline
- 2026-05-01 Listed $220,000 NIRA MLS as Distributed by MLS Grid
- 2025-12-29 Pending — NIRA MLS as Distributed by MLS Grid
- 2025-12-29 Sold (MLS) $110,000 NIRA MLS as Distributed by MLS Grid
- 2025-12-29 Sold (MLS) $110,000 NIRA MLS as Distributed by MLS Grid
- 2025-11-15 Contingent — NIRA MLS as Distributed by MLS Grid
- 2025-11-15 Contingent — NIRA MLS as Distributed by MLS Grid
- 2025-10-28 Listed $110,000 NIRA MLS as Distributed by MLS Grid
- 2025-10-28 Listed $110,000 NIRA MLS as Distributed by MLS Grid
Property tax history
+14.4%/yrLatest (2024): $2,754 · +6.7% YoY. Source: county tax records.
Cash-flow waterfall
monthlySold comps — $/sqft
last 12 mo · ≤1 miLoading sold comps…