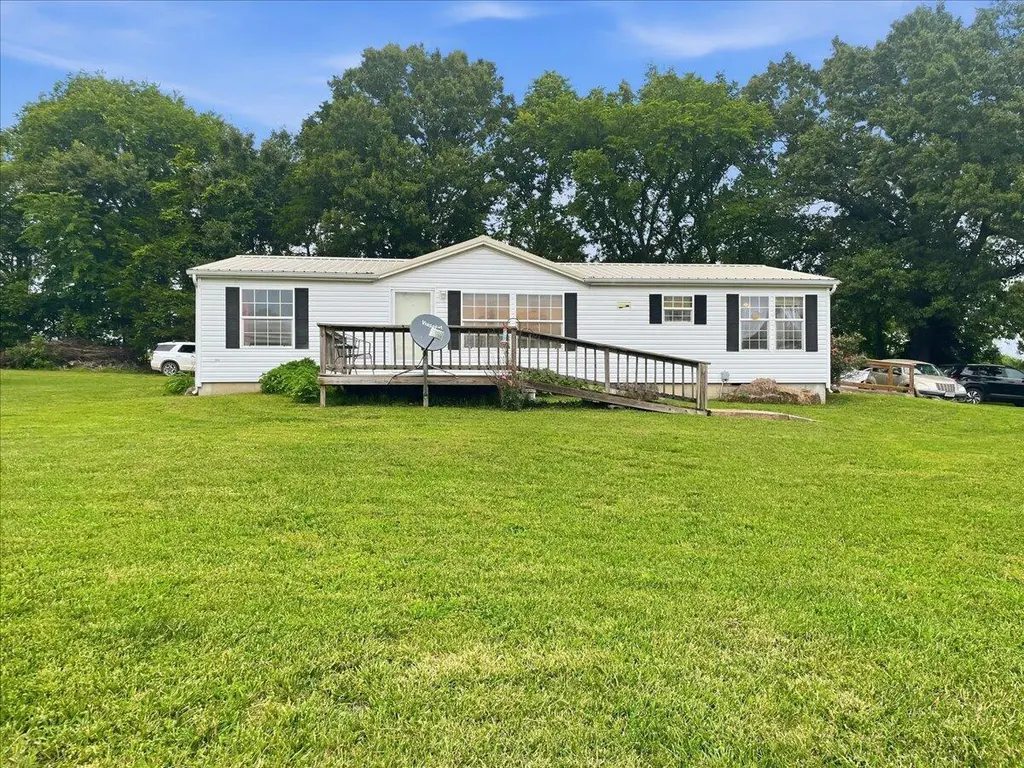
18233 County Road 361 · Preston, MO
Flood risk 1/10 · Minimal
- FEMA flood zone
- —
- Chance of flooding over 30 yrs
- 0.0%
- Est. flood insurance / yr
- —
Fire risk 4/10 · Minor
- Est. fire insurance / yr
- $1,054 – $1,958
Heat risk 4/10 · Minor
- Hot days now (above 107°F)
- 7 days/yr
- Hot days in 30 yrs
- 19 days/yr
Wind risk 2/10 · Minimal
- Chance of severe wind over 30 yrs
- 0.0%
Air-quality risk 2/10 · Minimal
- Unhealthy air days now
- 1 days/yr
- Unhealthy air days in 30 yrs
- 2 days/yr
Risk factors via First Street. Map © Google.
Why this score? — see what drove the D- grade
The composite is a weighted blend of 9 inputs, each scored 0–100. Each bar is that input's sub-score; the figure is the points it added to the 100-point composite (weight × sub-score).
- Cash flow +7.8/30.0
- ARV discount +7.5/15.0
- Appreciation +7.2/10.0
- Schools +5.4/10.0
- Rent growth +2.5/5.0
- Livability +2.5/5.0
- Condition / age +2.5/5.0
- DSCR +1.9/10.0
- 1% rule +1.1/10.0
$189,900
🖨 Deal sheet 📄 Offer letter ✓ Due diligence
Listing remarks
Enjoy peaceful country living in this 3-bedroom, 2-bath home situated on almost 5 acres just outside of Preston. This private property offers plenty of space to relax and enjoy nature, featuring a scenic pond and a secluded setting away from the hustle and bustle. The home provides comfortable living with ample outdoor space for recreation, gardening, or simply enjoying the quiet surroundings. A carport and small storage building are included with the property, adding convenience and extra storage options. Whether you're looking for a full-time residence, a weekend retreat, or a place to enjoy country living, this property offers privacy, space, and the beauty of rural Missouri.
Key facts
- Ample outdoor space
- Scenic pond
- Carport
Tags
Property features AI
Exterior
- Parking: Gravel parking; 1-car garage
- Security: Accessible approach (ramp) improves entry safety and access
- Utilities: Private water source; Septic tank
- Home design: Manufactured house on permanent foundation; Manufactured on land; Double wide; One level
- Construction: Metal roof; Permanent foundation; Built as a manufactured house
- Exterior features: Deck; Level, cleared lot; Gravel road access; County road/easement frontage
Interior
- Kitchen: Electric oven; Free-standing electric oven; Dishwasher; Refrigerator
- Bedrooms: Double wide manufactured home (bedroom count not provided)
- Flooring: Carpet; Linoleum
- Bathrooms: 2 full bathrooms
- Heating & cooling: Central electric heating; Ceiling fan(s) for cooling
- Interior features: Accessible entrance with ramp; Shed(s) on the property
- Laundry & utility: Laundry located on the main level
Neighborhood map
What this means for you Summary
Snapshot
- This is a 3-bed/2.0-bath other listed at $190k.
Deal economics
- At list price, monthly cash flow is $-214 ($-3k/yr) — negative.
- To cash-flow at today's rent, offer at most $152k (19.9% below list).
- To meet the 1% rule (rent ≥ 1% of price), the offer needs to be $116k (39.1% below list).
- Recommended offer: $116k (39.1% below list) — sets the bar for 1% rule.
Location & tenants
- Location reads 50/100 on livability (#901 in MO) — a working-class tenant base; expect higher turnover. Strengths: cost of living A+; Watch: crime F, amenities F, commute F.
- Hickory County R-I (rural): math 65% / reading 66% proficiency, ranked #8 of 324 in MO (top 2%) — acceptable for families but not a draw, mixed tenant base, ~2y average lease.
- Zoned schools: Skyline Elem. (math 82% / reading 82%, grade A+, #4 of 1,115 statewide, top 0%, 306 students, 45% FRL); Skyline Middle (math 57% / reading 59%, grade B, #26 of 391 statewide, top 7%, 206 students, 40% FRL); Skyline High (math 64% / reading 74%, grade B, #10 of 521 statewide, top 2%, 215 students, 38% FRL) — zoned schools at 41% FRL track the district average.
- Market conditions: 9 active listings in the ZIP.
Forward outlook
- In year one you build about $10k of equity ($1k loan paydown + $8k appreciation (4.3% local appreciation)).
- Hickory County population projected at -26% by 2050 — secular population decline; favor cash flow + early exit over multi-decade hold.
- By year 4, paydown + projected appreciation supports a ~$32k cash-out refi (75% LTV) — recoverable capital for the next deal without selling this one.
Negotiation context
- It's been on market 17 days — a 2% lower offer ($187k) is reasonable based on typical stale-listing flexibility.
Questions for the listing agent
- What do current leases actually rent for vs. the listed asking? Can we see a recent rent roll and the last 12 months of T-12 income?
- Is there a deadline driving the sale (1031 exchange, divorce, estate, relocation)? That informs how much negotiation room exists.
- Schools are F-rated, which usually means shorter tenancies and higher turnover. Who's the typical renter profile here, and what's been the actual vacancy rate?
- Crime grade is F in this area — have there been break-ins, vandalism, or insurance claims at this property in the last 3 years? What carrier currently insures it and at what premium?
- The area grade is low — what's the realistic commute time and amenity access for the typical tenant pool here? Any planned neighborhood developments (good or bad) we should know about?
- What's the average days-on-market for RENTAL listings here right now (not sales)? A rising rental-DOM trend means longer vacancies and softer asking-rent achievability than the comps imply.
- What's the recent tenant-quality profile in this submarket — average credit score on applications, eviction rate, late-payment / NSF rate, and stable-employment percentage? A property-management company in the area should have these aggregated.
- How much new for-sale + rental construction is in the pipeline within 1–3 miles? Heavy new supply typically softens prices + rents 12–24 months out; constrained supply supports both.
Investment metrics
- 1% rule
- 0.61% ✗
- Cap rate
- 4.94%
- Cash-on-cash
- -4.82%
- DSCR
- 0.79
- GRM
- 13.7
CMA / ARV
No comps found within radius.
Projected returns pro-forma
4.31% appreciation · 3.0% rent growth · sell at horizon
- IRR
- 6.9%
- Equity multiple
- 1.43×
- Total profit
- $22,725
- Equity at exit
- $99,798
- IRR
- 9.1%
- Equity multiple
- 2.58×
- Total profit
- $84,069
- Equity at exit
- $166,098
Cash invested: $53,172 (down + closing). Projections, not guarantees.
Landlord ↔ Tenant lean methodology
- Overall (STATE)
- 81 Strongly Landlord-Friendly
- State Missouri
- 81 Strongly Landlord-Friendly · R+10
- County
- — inherits STATE
- City
- — inherits STATE
ZIP-level market 65732
- Home prices YoY
- 4.0%
- Active inventory
- 9
- Price-to-rent
- 13.7×
Monthly cashflow live
- Estimated rent
- $1,156 medium interval (Pro) →
- Mortgage (P&I)
- −$996
- Tax from tax record
- −$52 /mo · $626/yr
- Insurance
- −$79
- HOA
- −$0
- Vacancy / Maint / Mgmt
- −$243
- Net cashflow
- $-214
Break-even live
UW: 25.0% down · 7.5% · 30yr · 1.5% tax · 5.0% vac · 8.0% maint · 8.0% mgmt
Financing live
Cash to close
- Down payment
- $47,475
- Closing costs
- $5,697
- Reserves months
- —
- Total cash needed
- —
Loan-product check · same deal, 3 products live
Conventional
25% down · 7.5% · 30yr
- Down + closing
- —
- Monthly P&I
- —
- Monthly cashflow
- —
- DSCR
- —
- Eligible?
- —
Personal DTI + credit; lowest rate.
DSCR
20% down · 8.5% · 30yr
- Down + closing
- —
- Monthly P&I
- —
- Monthly cashflow
- —
- DSCR
- —
- Eligible?
- —
No personal income docs; deal must DSCR.
Hard money
10% down · 12.0% · 12mo
- Down + closing
- —
- Monthly P&I
- —
- Monthly cashflow
- —
- DSCR
- —
- Eligible?
- —
Short-term bridge; refi at stabilization.
Listing history 14 events
-
2026-06-19status $189,900 Pending 17 DOM
-
2026-06-18days on market $189,900 Active 17 DOM
-
2026-06-17days on market $189,900 Active 16 DOM
-
2026-06-16days on market $189,900 Active 15 DOM
-
2026-06-15days on market $189,900 Active 14 DOM
-
2026-06-14days on market $189,900 Active 12 DOM
-
2026-06-12days on market $189,900 Active 11 DOM
-
2026-06-09days on market $189,900 Active 8 DOM
-
2026-06-08days on market $189,900 Active 7 DOM
-
2026-06-07days on market $189,900 Active 6 DOM
-
2026-06-05days on market $189,900 Active 3 DOM
-
2026-06-03days on market $189,900 Active 2 DOM
-
2026-06-01remarks 687-char remark
-
2026-06-01$189,900 Active 1 DOM
ⓘ Source: listings_history table (triggers on properties + properties_extension) + one-shot
backfill from property_details.listing_events for pre-trigger history.
Tax reassessment forecast MO · Resets to sale price
- Current annual tax
- $626 · $52/mo
- Projected year-2 tax
- $1,842 · $154/mo
- Expected delta
- +$1,216/yr (+$101/mo · 194.1%)
ⓘ Screening estimate from a state-policy table — verify with the county assessor before closing.
Climate risk First Street
- Flood 1/10 Low 0% chance over 30 yrs
- Wildfire 4/10 Moderate
- Heat 4/10 Moderate 7 d/yr ≥107°F today · 19 d/yr by 30 yrs out
- Wind 2/10 Low 0% chance of damaging wind over 30 yrs
- Air quality 2/10 Low 1 unhealthy d/yr today · 2 by 30 yrs out
Nearby sold comps map
Loading sold comps map…
Walkable amenities ~0.75 mi
Loading nearby amenities…
Taxation est. · year 1
- Rental income
- $13,878
- − Mortgage interest
- −$10,637
- − Property taxes
- −$626
- − Insurance
- −$950
- − Repairs & maintenance
- −$1,110
- − Management
- −$1,110
- − Depreciation
- −$5,524
- Taxable loss
- −$6,080
- Est. tax savings @ 24.0%
- +$1,459
- After-tax cash flow
- $-1,103/yr
For passive investors: Depreciation is non-cash, so a rental often shows a tax loss while cash-flowing — sheltering income. Rental losses are passive: they offset passive income freely, and up to $25,000/yr can offset ordinary (W-2) income if you actively participate and your MAGI is under $100k (phasing out to $0 by $150k); unused losses carry forward. On sale, claimed depreciation is recaptured at up to 25%, and gains may owe capital-gains tax (a 1031 exchange can defer both). Figures are a year-1 estimate at your 24.0% rate — not tax advice; consult a CPA.
Schools (NCES district)
- District
- Hickory County R-I
- NCES district ID
- 2914320
- Math proficiency
- 65% ▼ -4.00%
- Reading proficiency
- 66% ▲ 1.00%
- Median HH income
- $33,125
- Composite
- 54.03/100
- National rank
- #1393
- State rank
- #8 of 324 in MO
Livability — Preston
- Score
- 50/100
- State rank
- #901
- US rank
- #25559
Category grades
Schools grade is shown separately in the Schools card above.
Census & demographics
- Population (ZIP)
- 1,263
Population outlook (Hickory County) Hauer SSP2
- Today (2025)
- 8,206 people
- By 2030
- 7,690 · -6.3%
- By 2040
- 6,780 · -17.4%
- By 2050
- 6,076 · -26.0%
- By 2075
- 5,088 · -38.0%
- By 2100
- 4,489 · -45.3%
Race, ethnicity, and origin ACS 2023
- Neighborhood character
- Predominantly White (97%)
- Race & ethnicity
- White 97% Two or more races 2% Hispanic / Latino 2%
- Common ancestry
- Italian 12% Lithuanian 3% Serbian 2%
- Languages at home
- 99% English-only · German/W. Germanic 1%
Political lean MEDSL · Hickory
- 2024 margin
- Solid R (+61.1) · D 19.1% · R 80.2%
- 2008→2024 swing
- -47.9pp toward R · 2008: -13.3pp · 2024: -61.1pp
- All cycles
- 2024: R+61.1 2020: R+57.3 2016: R+53.5 2012: R+23.6 2008: R+13.3
Not yet ingested
- Civics
- —
Market trends
- HPI YoY
- ▲ 4.31%
- Current HPI
- 111.3835
- Rent YoY
- —
- Metro
- —
- State GDP YoY
- ▲ 1.84%
- F500 in state
- 20
Industry mix (Fortune 500 HQ in MO)
| Industry | F500 HQs | Revenue |
|---|---|---|
| Healthcare | 1 | $163B |
|
||
| Insurance | 1 | $21B |
|
||
| Industrial Technology | 1 | $17B |
|
||
| Retail | 1 | $16B |
|
||
| Industrial Distribution | 1 | $10B |
|
||
| Utilities | 1 | $9B |
|
||
Price history
2 events — show timeline
- 2026-06-01 Listed $189,900 SOMO
- 2017-10-11 Sold (Public Records) — Public Records
Property tax history
+2.0%/yrLatest (2025): $626 · +6.2% YoY. Source: county tax records.
Cash-flow waterfall
monthlySold comps — $/sqft
last 12 mo · ≤1 miLoading sold comps…