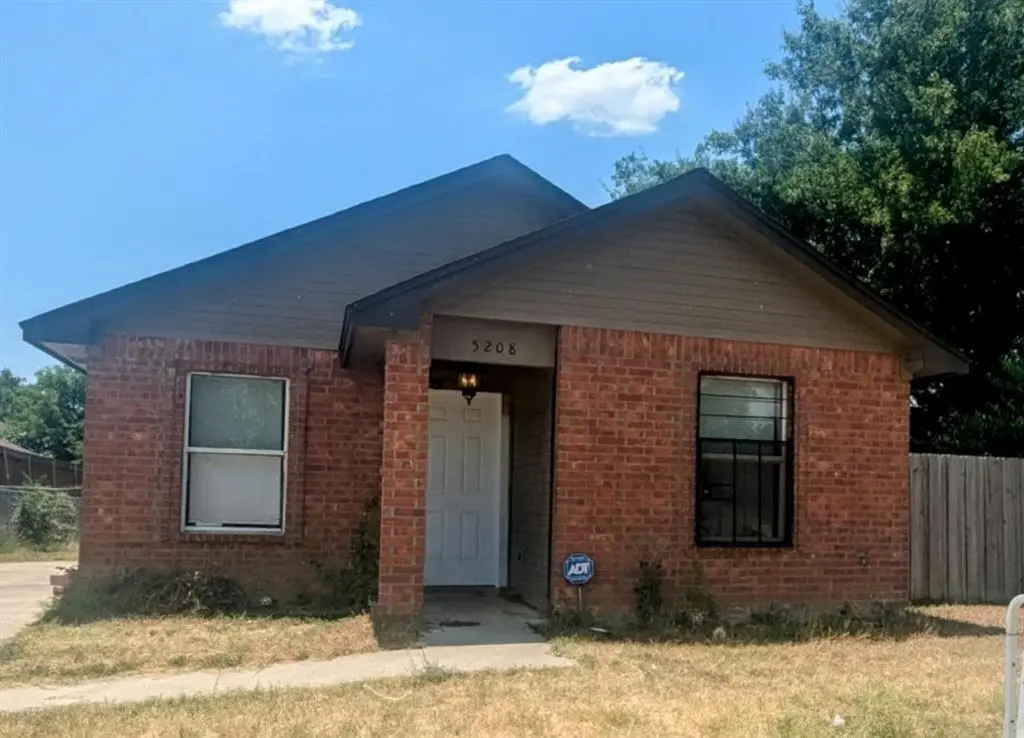
5208 Carol Ave · Fort Worth, TX
Flood risk 1/10 · Minimal
- FEMA flood zone
- X (unshaded)
- Chance of flooding over 30 yrs
- 0.0%
- Est. flood insurance / yr
- $507 – $1,088
Fire risk 1/10 · Minimal
- Est. fire insurance / yr
- $1,222 – $2,270
Heat risk 8/10 · Major
- Hot days now (above 110°F)
- 7 days/yr
- Hot days in 30 yrs
- 24 days/yr
Wind risk 5/10 · Moderate
- Chance of severe wind over 30 yrs
- 26.0%
Air-quality risk 3/10 · Minor
- Unhealthy air days now
- 2 days/yr
- Unhealthy air days in 30 yrs
- 4 days/yr
Risk factors via First Street. Map © Google.
Why this score? — see what drove the C grade
The composite is a weighted blend of 9 inputs, each scored 0–100. Each bar is that input's sub-score; the figure is the points it added to the 100-point composite (weight × sub-score).
- ARV discount +14.7/15.0
- Cash flow +13.8/30.0
- Appreciation +10.0/10.0
- 1% rule +4.5/10.0
- DSCR +4.2/10.0
- Livability +4.0/5.0
- Rent growth +2.5/5.0
- Condition / age +2.5/5.0
- Schools +2.0/10.0
$189,800
🖨 Deal sheet 📄 Offer letter ✓ Due diligence
Listing remarks MLS
Charming 4 Bedroom 2 Bath home located in the heart of Fort Worth. Offering both comfort and convenience. Kitchen offers a breakfast bar adjacent to dining making it great for family gatherings. Large back yard for dogs and kids to run and play. Property is located close to shopping, parks and schools. Don't miss an opportunity to show this one.
Key facts
- Close to parks
- Close to schools
- Large back yard
Tags
Neighborhood map
What this means for you Summary
Snapshot
- This is a 3-bed/1.0-bath single-family listed at $190k.
Deal economics
- At list price, monthly cash flow is $16 ($196/yr) — positive.
- The deal already cash-flows at list — no discount required.
- To meet the 1% rule (rent ≥ 1% of price), the offer needs to be $181k (4.7% below list).
- Recommended offer: $167k (12.0% below list) — sets the bar for market timing.
- Cap rate 6.4% vs local median 3.9% in Fort Worth — top-decile yield for the area; either an underpriced asset or a hidden risk that comps aren't pricing in. Stress-test before assuming the spread holds.
Location & tenants
- Location reads 80/100 on livability (#49 in TX, #1,954 nationally) — a professional / high-income tenant draw. Strengths: amenities A+, cost of living A+, housing A+; Watch: schools D+, crime F.
- Fort Worth ISD (urban): math 18% / reading 28% proficiency, ranked #742 of 826 in TX (top 90%) — low school quality limits family demand, transient renter base, plan for 1-2y turnover; 73% free/reduced lunch — lower-income household profile, screen leases tightly.
- Market conditions: 99 active listings in the ZIP; 28 comparable units currently listed for rent nearby; rentals at typical pace (median 18d on market — plan ~3-4 weeks tenant-placement turnaround); 18,938 units permitted in Tarrant County in 2024 (8,336 in 5+ unit buildings).
- At $1,808/mo this rent would consume 47% of the median local household income ($46k/yr) (locally 884% of renters already pay >50% of income on rent) — very limited rent-growth headroom before tenants either downsize or default.
Forward outlook
- In year one you build about $20k of equity ($1k loan paydown + $19k appreciation (10.0% local appreciation)).
- Tarrant County population projected at +41% by 2050 — long-run rental-demand tailwind backs the buy-and-hold thesis.
- At projected returns (10.0% appreciation + 3.0% rent growth), your $53k cash investment doubles in ~3 years — after that, you're playing with house money.
- By year 2, paydown + projected appreciation supports a ~$33k cash-out refi (75% LTV) — recoverable capital for the next deal without selling this one.
Negotiation context
- It's been on market 133 days — a 12% lower offer ($167k) is reasonable based on typical stale-listing flexibility.
- 5 sale attempts since 17y ago; this cycle's ask has dropped $10k (5%) from the opening price — seller is motivated, your offer sets the floor, not the list.
Risks & watch-outs
- Climate carrying-cost: moderate wind risk, 26% chance of damaging wind over 30y; extreme-heat days projected 7→24/yr by 2055 (HVAC capex compounding) — expect insurance premiums to compound above CPI over the hold.
Questions for the listing agent
- It's been on market 133 days. Have you received any prior offers? Is the seller open to a 12% concession, seller financing, or rate buy-down credit?
- Why hasn't it sold? Are there any deal-killer items the seller is aware of (foundation, flood, title, zoning, code violations)?
- Is there a deadline driving the sale (1031 exchange, divorce, estate, relocation)? That informs how much negotiation room exists.
- Schools are D-rated, which usually means shorter tenancies and higher turnover. Who's the typical renter profile here, and what's been the actual vacancy rate?
- Crime grade is F in this area — have there been break-ins, vandalism, or insurance claims at this property in the last 3 years? What carrier currently insures it and at what premium?
- What's the average days-on-market for RENTAL listings here right now (not sales)? A rising rental-DOM trend means longer vacancies and softer asking-rent achievability than the comps imply.
- What's the recent tenant-quality profile in this submarket — average credit score on applications, eviction rate, late-payment / NSF rate, and stable-employment percentage? A property-management company in the area should have these aggregated.
- How much new for-sale + rental construction is in the pipeline within 1–3 miles? Heavy new supply typically softens prices + rents 12–24 months out; constrained supply supports both.
Investment metrics
- 1% rule
- 0.95% ✗
- Cap rate
- 6.40%
- Cash-on-cash
- 0.37%
- DSCR
- 1.02
- GRM
- 8.7
CMA / ARV
- ARV (median comp)
- $225,683
- List price
- $189,800
- Delta
- -15.90%
- Verdict
- UNDERPRICED
- Comps
- 20 within 1.0 mi
Show comp detail 12 sales within ~0.75 mi
| Address | Dist | Beds/Ba | Sqft | Sold | Price | $/sf | Match |
|---|---|---|---|---|---|---|---|
| 2413 Lena St | 0.40mi | 3/2.0 | 1,211 (-2%) | 2mo | $249,000 | $206 | 73 |
| 2515 Birdell Ct | 0.13mi | 3/2.0 | 1,397 (+14%) | 1mo | $265,000 | $190 | 67 |
| 2513 Birdell Ct | 0.13mi | 3/2.0 | 1,397 (+14%) | 2mo | $268,500 | $192 | 66 |
| 2204 Rw Bivens Ln | 0.32mi | 3/1.0 | 1,100 (-11%) | 4mo | $75,000 | $68 | 65 |
| 2801 Mount Horum Way | 0.14mi | 3/2.5 | 1,393 (+13%) | 3mo | $275,000 | $197 | 63 |
| 3716 Clotell Dr | 0.68mi | 3/2.0 | 1,218 (-1%) | 1mo | $220,000 | $181 | 62 |
| 5608 Burton Ave | 0.59mi | 3/2.0 | 1,156 (-6%) | 2mo | $205,000 | $177 | 57 |
| 5017 Cottey St | 0.34mi | 3/2.0 | 1,397 (+14%) | 4mo | $268,500 | $192 | 55 |
| 5013 Cottey St | 0.34mi | 3/2.0 | 1,397 (+14%) | 4mo | $262,500 | $188 | 54 |
| 1716 Birdell St | 0.67mi | 3/2.0 | 1,157 (-6%) | 2mo | $231,000 | $200 | 53 |
| 5030 Pinson St | 0.37mi | 3/2.0 | 1,397 (+14%) | 4mo | $299,000 | $214 | 53 |
| 5000 Reed St | 0.69mi | 4/2.0 (+1) | 1,382 (+12%) | 2mo | $242,000 | $175 | 37 |
Match score weights: distance 35% · size 25% · config 20% · recency 20%. Top-matched comps best support the ARV.
Projected returns pro-forma
10.0% appreciation · 3.0% rent growth · sell at horizon
- IRR
- 24.6%
- Equity multiple
- 2.97×
- Total profit
- $104,501
- Equity at exit
- $170,987
- IRR
- 21.7%
- Equity multiple
- 6.78×
- Total profit
- $307,095
- Equity at exit
- $368,740
Cash invested: $53,144 (down + closing). Projections, not guarantees.
Landlord ↔ Tenant lean methodology
- Overall (STATE)
- 87 Strongly Landlord-Friendly
- State Texas
- 87 Strongly Landlord-Friendly · R+5
- County
- — inherits STATE
- City
- — inherits STATE
ZIP-level market 76105
- Home prices YoY
- 14.2%
- Active inventory
- 99
- Price-to-rent
- 8.7×
Monthly cashflow live
- Estimated rent
- $1,808 high interval (Pro) →
- Mortgage (P&I)
- −$995
- Tax from tax record
- −$337 /mo · $4,050/yr
- Insurance
- −$79
- HOA
- −$0
- Vacancy / Maint / Mgmt
- −$380
- Net cashflow
- $16
Break-even live
UW: 25.0% down · 7.5% · 30yr · 1.5% tax · 5.0% vac · 8.0% maint · 8.0% mgmt
Financing live
Cash to close
- Down payment
- $47,450
- Closing costs
- $5,694
- Reserves months
- —
- Total cash needed
- —
Loan-product check · same deal, 3 products live
Conventional
25% down · 7.5% · 30yr
- Down + closing
- —
- Monthly P&I
- —
- Monthly cashflow
- —
- DSCR
- —
- Eligible?
- —
Personal DTI + credit; lowest rate.
DSCR
20% down · 8.5% · 30yr
- Down + closing
- —
- Monthly P&I
- —
- Monthly cashflow
- —
- DSCR
- —
- Eligible?
- —
No personal income docs; deal must DSCR.
Hard money
10% down · 12.0% · 12mo
- Down + closing
- —
- Monthly P&I
- —
- Monthly cashflow
- —
- DSCR
- —
- Eligible?
- —
Short-term bridge; refi at stabilization.
Rent comps 28 comps
| Address | Beds | Baths | Sqft | Rent | $/sqft | DOM | Units | Dist |
|---|---|---|---|---|---|---|---|---|
| 5328 Carol Ave Fort Worth, TX | 4.0 | 2.0 | 1230 | $2,100 | $1.71 | 43d | 1 | 0.09mi |
| 5336 Cottey St Fort Worth, TX | 3.0 | 2.0 | 1045 | $1,699 | $1.63 | 43d | 1 | 0.17mi |
| 3201 Mount Horum Way Fort Worth, TX | 3.0 | 2.0 | 1045 | $1,699 | $1.63 | 6d | 1 | 0.26mi |
| 5011 Sunshine Dr Fort Worth, TX | 2.0 | 1.0 | 813 | $1,515 | $1.86 | 24d | 1 | 0.32mi |
| 2128 R. W. Bivens Ln Fort Worth, TX | 3.0 | 2.0 | 1045 | $1,615 | $1.55 | 14d | 1 | 0.37mi |
| 5636 Lester Granger Dr Fort Worth, TX | 3.0 | 2.0 | 1300 | $1,495 | $1.15 | 24d | 1 | 0.56mi |
| 1804 Andrew Ave Fort Worth, TX | 2.0 | 1.0 | 764 | $1,395 | $1.83 | 17d | 1 | 0.60mi |
| 1810 Wiseman Ave Fort Worth, TX | 3.0 | 2.0 | 1000 | $1,500 | $1.50 | 43d | 1 | 0.60mi |
| 4929 Willie St Fort Worth, TX | 3.0 | 2.0 | 1386 | $1,650 | $1.19 | 4d | 1 | 0.64mi |
| 3700 Radford Rd Fort Worth, TX | 3.0 | 2.0 | 1124 | $1,650 | $1.47 | 24d | 1 | 0.65mi |
| 3700 Radford Rd Fort Worth, TX | 3.0 | 2.0 | 1124 | $1,650 | $1.47 | 12d | 1 | 0.65mi |
| 5055 Virgil St Fort Worth, TX | 3.0 | 2.0 | 1089 | $1,650 | $1.52 | 24d | 1 | 0.72mi |
| 3848 Waldorf St Fort Worth, TX | 2.0 | 1.0 | 734 | $1,195 | $1.63 | 5d | 1 | 0.83mi |
| 3865 Stalcup Rd Fort Worth, TX | 3.0 | 2.0 | 1090 | $1,814 | $1.66 | 6d | 1 | 0.85mi |
| 2500 S Edgewood Ter Fort Worth, TX | 1.0–3.0 | 1.0–2.5 | 1123 | $1,895 | $1.69 | 2d | 34 | 0.86mi |
| 1736 Ransom Ter Fort Worth, TX | 3.0 | 2.0 | 1322 | $1,850 | $1.40 | 15d | 1 | 0.95mi |
| 4312 Lorin Ave Fort Worth, TX | 4.0 | 2.0 | 1230 | $2,000 | $1.63 | 43d | 1 | 1.00mi |
| 4508 Wiman Dr Fort Worth, TX | 3.0 | 2.0 | 1045 | $1,580 | $1.51 | 6d | 1 | 1.13mi |
| 5818 Grayson St Unit 5818 Fort Worth, TX | 3.0 | 2.5 | 1400 | $2,000 | $1.43 | 18d | 1 | 1.13mi |
| 5820 Grayson St Fort Worth, TX | 3.0 | 2.5 | 1417 | $1,895 | $1.34 | 43d | 1 | 1.14mi |
| 4220 Ramey Ave Fort Worth, TX | 2.0 | 1.0 | 832 | $1,680 | $2.02 | 5d | 1 | 1.16mi |
| 5913 Montague St Fort Worth, TX | 3.0 | 2.0 | 1090 | $1,549 | $1.42 | 14d | 1 | 1.21mi |
| 4217 Wilhelm St Fort Worth, TX | 3.0 | 2.0 | 1380 | $1,650 | $1.20 | 43d | 1 | 1.32mi |
| 5908 Oakdale Dr Fort Worth, TX | 3.0 | 2.0 | 1090 | $1,475 | $1.35 | 6d | 1 | 1.37mi |
| 4336 Jana Dr Fort Worth, TX | 3.0 | 1.0 | 1070 | $1,650 | $1.54 | 4d | 1 | 1.38mi |
| 5023 Vinson St Unit 5023 Fort Worth, TX | 2.0 | 1.0 | 742 | $1,175 | $1.58 | 43d | 1 | 1.39mi |
| 5910 Wilkes Dr Fort Worth, TX | 3.0 | 2.0 | 872 | $1,445 | $1.66 | 6d | 1 | 1.45mi |
| 5912 Wilkes Dr Fort Worth, TX | 3.0 | 2.0 | 872 | $1,499 | $1.72 | 43d | 1 | 1.48mi |
Listing history 27 events
-
2026-06-18days on market $189,800 Active 133 DOM
-
2026-06-17days on market $189,800 Active 132 DOM
-
2026-06-16days on market $189,800 Active 131 DOM
-
2026-06-15days on market $189,800 Active 130 DOM
-
2026-06-13days on market $189,800 Active 128 DOM
-
2026-06-09days on market $189,800 Active 124 DOM
-
2026-06-08days on market $189,800 Active 123 DOM
-
2026-06-07pricedays on market $189,800 Active 122 DOM
-
2026-06-04days on market $189,900 Active 119 DOM
-
2026-06-03days on market $189,900 Active 118 DOM
-
2026-06-02days on market $189,900 Active 117 DOM
-
2026-06-02days on market $189,900 Active 116 DOM
-
2026-05-31days on market $189,900 Active 115 DOM
-
2026-05-07historical Active Option Contract 347-char remark
Show marketing remark (347 chars)
Charming 4 Bedroom 2 Bath home located in the heart of Fort Worth. Offering both comfort and convenience. Kitchen offers a breakfast bar adjacent to dining making it great for family gatherings. Large back yard for dogs and kids to run and play. Property is located close to shopping, parks and schools. Don't miss an opportunity to show this one.
-
2026-03-28price $189,900 347-char remark
Show marketing remark (347 chars)
Charming 4 Bedroom 2 Bath home located in the heart of Fort Worth. Offering both comfort and convenience. Kitchen offers a breakfast bar adjacent to dining making it great for family gatherings. Large back yard for dogs and kids to run and play. Property is located close to shopping, parks and schools. Don't miss an opportunity to show this one.
-
2026-02-19price $194,900 347-char remark
Show marketing remark (347 chars)
Charming 4 Bedroom 2 Bath home located in the heart of Fort Worth. Offering both comfort and convenience. Kitchen offers a breakfast bar adjacent to dining making it great for family gatherings. Large back yard for dogs and kids to run and play. Property is located close to shopping, parks and schools. Don't miss an opportunity to show this one.
-
2026-02-04$199,900 Active 347-char remark
Show marketing remark (347 chars)
Charming 4 Bedroom 2 Bath home located in the heart of Fort Worth. Offering both comfort and convenience. Kitchen offers a breakfast bar adjacent to dining making it great for family gatherings. Large back yard for dogs and kids to run and play. Property is located close to shopping, parks and schools. Don't miss an opportunity to show this one.
-
2026-01-31historical
-
2025-11-09$199,900 Active
-
2024-10-01status Active
-
2024-09-30historical
-
2024-07-24price $199,900
-
2024-07-12$219,900 Active
-
2009-05-26soldstatus
-
2009-05-14historical
-
2009-03-18$35,900
-
2006-06-02soldstatus
ⓘ Source: listings_history table (triggers on properties + properties_extension) + one-shot
backfill from property_details.listing_events for pre-trigger history.
Tax reassessment forecast TX · Resets to sale price
- Current annual tax
- $4,050 · $337/mo
- Projected year-2 tax
- $4,050 · $337/mo
- Expected delta
- $0/yr ($0/mo · -0.0%)
ⓘ Screening estimate from a state-policy table — verify with the county assessor before closing.
Climate risk First Street
- Flood 1/10 Low FEMA zone X (unshaded) · 0% chance over 30 yrs
- Wildfire 1/10 Low
- Heat 8/10 Severe 7 d/yr ≥110°F today · 24 d/yr by 30 yrs out
- Wind 5/10 Major 26% chance of damaging wind over 30 yrs
- Air quality 3/10 Moderate 2 unhealthy d/yr today · 4 by 30 yrs out
Nearby sold comps map
Loading sold comps map…
Walkable amenities ~0.75 mi
Loading nearby amenities…
Taxation est. · year 1
- Rental income
- $21,695
- − Mortgage interest
- −$10,632
- − Property taxes
- −$4,050
- − Insurance
- −$949
- − Repairs & maintenance
- −$1,736
- − Management
- −$1,736
- − Depreciation
- −$5,521
- Taxable loss
- −$2,928
- Est. tax savings @ 24.0%
- +$703
- After-tax cash flow
- $899/yr
For passive investors: Depreciation is non-cash, so a rental often shows a tax loss while cash-flowing — sheltering income. Rental losses are passive: they offset passive income freely, and up to $25,000/yr can offset ordinary (W-2) income if you actively participate and your MAGI is under $100k (phasing out to $0 by $150k); unused losses carry forward. On sale, claimed depreciation is recaptured at up to 25%, and gains may owe capital-gains tax (a 1031 exchange can defer both). Figures are a year-1 estimate at your 24.0% rate — not tax advice; consult a CPA.
Schools (NCES district)
- District
- Fort Worth ISD
- NCES district ID
- 4819700
- Math proficiency
- 18% ▼ -16.00%
- Reading proficiency
- 28% ▼ -6.00%
- Median HH income
- $42,109
- Composite
- 19.61/100
- National rank
- #8753
- State rank
- #742 of 826 in TX
Livability — Fort Worth
- Score
- 80/100
- State rank
- #49
- US rank
- #1954
Category grades
Schools grade is shown separately in the Schools card above.
Census & demographics
- Census place
- Fort Worth, TX
- County
- Tarrant County · 2,033,669 people
- City population
- 911,619
- Metro
- Dallas-Fort Worth-Arlington, TX
- Population (ZIP)
- 22,228
- Household income
- $45,770
- Rent vs Own
- Severe rent burden
- 884.0
Population outlook (Tarrant County) Hauer SSP2
- Today (2025)
- 2,380,417 people
- By 2030
- 2,578,900 · +8.3%
- By 2040
- 2,974,995 · +25.0%
- By 2050
- 3,350,489 · +40.8%
- By 2075
- 4,216,909 · +77.2%
- By 2100
- 4,741,527 · +99.2%
Race, ethnicity, and origin ACS 2023
- Neighborhood character
- Majority Hispanic (63%)
- Race & ethnicity
- Hispanic / Latino 63% Black 29% Two or more races 24% White 6%
- Hispanic origin (detail)
- Mexican 57%
- Foreign-born
- 28% · Canada
- Languages at home
- 44% English-only · Spanish 55% Other Indo-European 1%
Political lean MEDSL · Tarrant
- 2024 margin
- Lean R (+5.1) · D 46.7% · R 51.9% · Other 1.4%
- 2008→2024 swing
- +6.6pp toward D · 2008: -11.7pp · 2024: -5.1pp
- All cycles
- 2024: R+5.1 2020: D+0.2 2016: R+8.7 2012: R+15.7 2008: R+11.7
Not yet ingested
- Civics
- —
Market trends
- HPI YoY
- ▲ 27.33%
- Current HPI
- 219.2657
- Rent YoY
- —
- Metro
- Dallas-Fort Worth-Arlington, TX
- State GDP YoY
- ▲ 3.95%
- F500 in state
- 110
Industry mix (Fortune 500 HQ in TX)
| Industry | F500 HQs | Revenue |
|---|---|---|
| Energy | 16 | $1,198B |
|
||
| Technology | 5 | $198B |
|
||
| Engineering / Construction | 4 | $72B |
|
||
| Energy Services | 3 | $60B |
|
||
| Utilities | 3 | $41B |
|
||
| Healthcare | 2 | $330B |
|
||
Price history
+429.0% since first listed14 events — show timeline
- 2026-05-07 Contingent — NTREIS
- 2026-03-28 Price Changed $189,900 NTREIS
- 2026-02-19 Price Changed $194,900 NTREIS
- 2026-02-04 Listed $199,900 NTREIS
- 2026-01-31 Listing Removed — NTREIS
- 2025-11-09 Listed $199,900 NTREIS
- 2024-10-01 Relisted — NTREIS
- 2024-09-30 Listing Removed — NTREIS
- 2024-07-24 Price Changed $199,900 NTREIS
- 2024-07-12 Listed $219,900 NTREIS
- 2009-05-26 Sold (MLS) — NTREIS
- 2009-05-14 Listing Removed — NTREIS
- 2009-03-18 Listed $35,900 NTREIS
- 2006-06-02 Sold (Public Records) — Public Records
Property tax history
+10.7%/yrLatest (2025): $4,050 · -16.1% YoY. Source: county tax records.
Cash-flow waterfall
monthlySold comps — $/sqft
last 12 mo · ≤1 miLoading sold comps…