148 N 7th St · DeFuniak Springs, FL
Flood risk 1/10 · Minimal
- FEMA flood zone
- X (unshaded)
- Chance of flooding over 30 yrs
- 0.0%
- Est. flood insurance / yr
- $507 – $1,088
Fire risk 4/10 · Minor
- Est. fire insurance / yr
- $947 – $1,759
Heat risk 9/10 · Severe
- Hot days now (above 107°F)
- 7 days/yr
- Hot days in 30 yrs
- 20 days/yr
Wind risk 9/10 · Severe
- Chance of severe wind over 30 yrs
- 99.0%
Air-quality risk 1/10 · Minimal
- Unhealthy air days now
- 0 days/yr
- Unhealthy air days in 30 yrs
- 0 days/yr
Risk factors via First Street. Map © Google.
Why this score? — see what drove the C grade
The composite is a weighted blend of 9 inputs, each scored 0–100. Each bar is that input's sub-score; the figure is the points it added to the 100-point composite (weight × sub-score).
- Cash flow +15.4/30.0
- Appreciation +10.0/10.0
- ARV discount +7.5/15.0
- Schools +5.2/10.0
- DSCR +4.7/10.0
- 1% rule +4.2/10.0
- Livability +3.2/5.0
- Rent growth +2.5/5.0
- Condition / age +2.5/5.0
$160,000
🖨 Deal sheet 📄 Offer letter ✓ Due diligence
Listing remarks
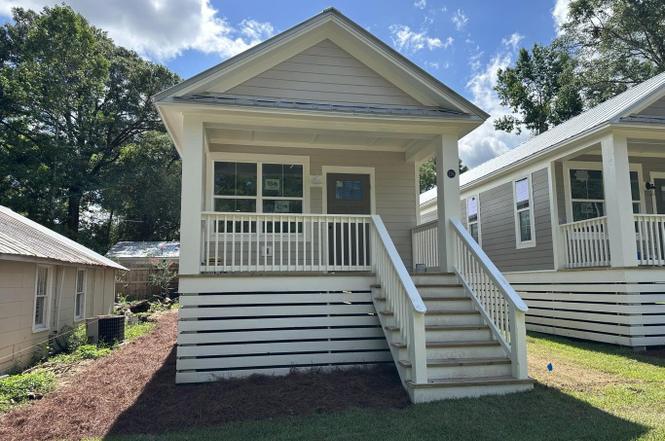
Affordable home within walking distance of growing Historic Defuniak Springs. Cozy 2-bedroom 1 bath home with plenty of parking in the rear of the home. Open floor plan with a quartz countertop kitchen and a living room spacious enough for a sectional. Kitchen comes equipped with Samsung Stainless Steel appliances. This home has an inviting front porch with a smaller front yard area. Survey available.
Key facts
- Inviting front porch
- 3,920 sq ft lot
- Built 2023
Tags
Property features AI
Finance
- HOA & community: Subdivision: FLOURNOYS S/D
Exterior
- Parking: Street access via paved city road
- Utilities: Public water; Public sewer; Electric service
- Home design: Florida Cottage style; Single-story; Built in 2023
- Construction: Metal roof; Cement fiberboard siding
- Exterior features: Front porch; Survey available; City street frontage; Paved road access
Interior
- Kitchen: Dishwasher
- Bedrooms: 2 bedrooms; Primary bedroom located on the first floor
- Flooring: Vinyl flooring
- Bathrooms: 1 full bathroom
- Heating & cooling: Central heating; Central air conditioning; Electric heating controls
- Interior features: Washer/dryer hookup; Tankless water heater
- Laundry & utility: Washer/dryer hookup
Neighborhood map
What this means for you Summary
Snapshot
- This is a 2-bed/1.0-bath single-family listed at $160k.
Deal economics
- At list price, monthly cash flow is $60 ($723/yr) — positive.
- The deal already cash-flows at list — no discount required.
- To meet the 1% rule (rent ≥ 1% of price), the offer needs to be $148k (7.8% below list).
- Recommended offer: $141k (12.0% below list) — sets the bar for market timing.
- Cap rate 6.7% vs local median 4.8% in DeFuniak Springs — top-decile yield for the area; either an underpriced asset or a hidden risk that comps aren't pricing in. Stress-test before assuming the spread holds.
Location & tenants
- Location reads 64/100 on livability (#694 in FL) — a middle-class / working-renter tenant base. Strengths: cost of living A+, housing A+; Watch: health & safety C-, crime D, amenities F.
- Walton (rural): math 62% / reading 61% proficiency, ranked #10 of 73 in FL (top 14%) — acceptable for families but not a draw, mixed tenant base, ~2y average lease.
- Zoned schools: West Defuniak Elementary School (math 67% / reading 57%, grade B, #608 of 2,144 statewide, top 29%, 669 students, 69% FRL); Walton High School (math 52% / reading 53%, grade C-, #154 of 667 statewide, top 24%, 856 students, 65% FRL) — zoned schools average 67% FRL vs 48% district-wide (19 pts higher); higher-poverty schools than district average — tighter screening recommended.
- Market conditions: 422 active listings in the ZIP; 7 comparable units currently listed for rent nearby; rentals leasing fast (median 14d on market — plan ~1-2 weeks tenant-placement turnaround); 2,883 units permitted in Walton County in 2024 (1,322 in 5+ unit buildings).
- This rent runs 34% of the median local income ($52k/yr) — at the standard rent-burdened threshold; future hikes will face affordability resistance.
Forward outlook
- In year one you build about $17k of equity ($1k loan paydown + $16k appreciation (10.0% local appreciation)).
- Walton County population projected at +46% by 2050 — long-run rental-demand tailwind backs the buy-and-hold thesis.
- At projected returns (10.0% appreciation + 3.0% rent growth), your $45k cash investment doubles in ~3 years — after that, you're playing with house money.
- By year 3, paydown + projected appreciation supports a ~$43k cash-out refi (75% LTV) — recoverable capital for the next deal without selling this one.
Negotiation context
- It's been on market 144 days — a 12% lower offer ($141k) is reasonable based on typical stale-listing flexibility.
- 4 sale attempts since 3y ago with the ask held roughly flat each time — persistent listings suggest the price (not the market) is what's stuck; bring a comps-based counter.
Risks & watch-outs
- Climate carrying-cost: severe wind risk, 99% chance of damaging wind over 30y; extreme-heat days projected 7→20/yr by 2055 (HVAC capex compounding) — expect insurance premiums to compound above CPI over the hold.
Questions for the listing agent
- It's been on market 144 days. Have you received any prior offers? Is the seller open to a 12% concession, seller financing, or rate buy-down credit?
- Why hasn't it sold? Are there any deal-killer items the seller is aware of (foundation, flood, title, zoning, code violations)?
- Is there a deadline driving the sale (1031 exchange, divorce, estate, relocation)? That informs how much negotiation room exists.
- Schools are D-rated, which usually means shorter tenancies and higher turnover. Who's the typical renter profile here, and what's been the actual vacancy rate?
- Crime grade is D in this area — have there been break-ins, vandalism, or insurance claims at this property in the last 3 years? What carrier currently insures it and at what premium?
- What's the average days-on-market for RENTAL listings here right now (not sales)? A rising rental-DOM trend means longer vacancies and softer asking-rent achievability than the comps imply.
- What's the recent tenant-quality profile in this submarket — average credit score on applications, eviction rate, late-payment / NSF rate, and stable-employment percentage? A property-management company in the area should have these aggregated.
- How much new for-sale + rental construction is in the pipeline within 1–3 miles? Heavy new supply typically softens prices + rents 12–24 months out; constrained supply supports both.
Investment metrics
- 1% rule
- 0.92% ✗
- Cap rate
- 6.74%
- Cash-on-cash
- 1.61%
- DSCR
- 1.07
- GRM
- 9.0
CMA / ARV
- ARV (on-the-fly)
- $99,990
- Comps found
- 6
Show comp detail 6 sales within ~0.75 mi
| Address | Dist | Beds/Ba | Sqft | Sold | Price | $/sf | Match |
|---|---|---|---|---|---|---|---|
| 126 N 11th St | 0.30mi | 2/1.0 | 975 (-2%) | 7mo | $210,000 | $215 | 78 |
| 170 E Burdick Ave | 0.11mi | 3/1.5 (+1) | 944 (-5%) | 14mo | $95,000 | $101 | 68 |
| 60 Quebec Ave | 0.31mi | 3/1.0 (+1) | 1,008 (+2%) | 15mo | $75,000 | $74 | 65 |
| 120 N 8Th St | 0.09mi | 2/1.0 | 911 (-8%) | 23mo | $87,500 | $96 | 63 |
| 397 E Burdick Ave | 0.28mi | 2/1.0 | 866 (-12%) | 11mo | $57,500 | $66 | 57 |
| 414 Quebec Ave | 0.65mi | 3/1.0 (+1) | 1,050 (+6%) | 10mo | $132,500 | $126 | 46 |
Match score weights: distance 35% · size 25% · config 20% · recency 20%. Top-matched comps best support the ARV.
Projected returns pro-forma
10.0% appreciation · 3.0% rent growth · sell at horizon
- IRR
- 25.4%
- Equity multiple
- 3.03×
- Total profit
- $91,001
- Equity at exit
- $144,141
- IRR
- 22.4%
- Equity multiple
- 6.92×
- Total profit
- $265,008
- Equity at exit
- $310,845
Cash invested: $44,800 (down + closing). Projections, not guarantees.
Landlord ↔ Tenant lean methodology
- Overall (STATE)
- 87 Strongly Landlord-Friendly
- State Florida
- 87 Strongly Landlord-Friendly · R+3
- County
- — inherits STATE
- City
- — inherits STATE
ZIP-level market 32433
- Home prices YoY
- 4.2%
- Active inventory
- 422
- Price-to-rent
- 9.0×
Monthly cashflow live
- Estimated rent
- $1,476 high interval (Pro) →
- Mortgage (P&I)
- −$839
- Tax est. 1.5%
- −$200 /mo · $2,400/yr
- Insurance
- −$67
- HOA
- −$0
- Vacancy / Maint / Mgmt
- −$310
- Net cashflow
- $60
Break-even live
UW: 25.0% down · 7.5% · 30yr · 1.5% tax · 5.0% vac · 8.0% maint · 8.0% mgmt
Financing live
Cash to close
- Down payment
- $40,000
- Closing costs
- $4,800
- Reserves months
- —
- Total cash needed
- —
Loan-product check · same deal, 3 products live
Conventional
25% down · 7.5% · 30yr
- Down + closing
- —
- Monthly P&I
- —
- Monthly cashflow
- —
- DSCR
- —
- Eligible?
- —
Personal DTI + credit; lowest rate.
DSCR
20% down · 8.5% · 30yr
- Down + closing
- —
- Monthly P&I
- —
- Monthly cashflow
- —
- DSCR
- —
- Eligible?
- —
No personal income docs; deal must DSCR.
Hard money
10% down · 12.0% · 12mo
- Down + closing
- —
- Monthly P&I
- —
- Monthly cashflow
- —
- DSCR
- —
- Eligible?
- —
Short-term bridge; refi at stabilization.
Rent comps 7 comps
| Address | Beds | Baths | Sqft | Rent | $/sqft | DOM | Units | Dist |
|---|---|---|---|---|---|---|---|---|
| 163 W Chaffin Ave Defuniak Springs, FL | 2.0 | 2.0 | 990 | $1,600 | $1.62 | 21d | 1 | 0.38mi |
| 215 Live Oak Ave E Unit A Defuniak Springs, FL | 1.0 | 1.0 | 810 | $1,585 | $1.96 | 13d | 1 | 0.42mi |
| 712 Bruce Ave Defuniak Springs, FL | 3.0 | 2.0 | 1040 | $1,600 | $1.54 | 13d | 1 | 0.82mi |
| 709 S 11th St Defuniak Springs, FL | 2.0 | 1.0 | 1076 | $1,499 | $1.39 | 21d | 1 | 0.93mi |
| 125 N Davis Ln Apt 133 Defuniak Springs, FL | 3.0 | 1.0 | 925 | $1,250 | $1.35 | 21d | 1 | 1.08mi |
| 125 N Davis Ln Unit 129 Defuniak Springs, FL | 2.0 | 1.0 | 750 | $1,095 | $1.46 | 13d | 1 | 1.08mi |
| 90 Andrews Ave Defuniak Springs, FL | 3.0 | 1.0 | 1118 | $1,550 | $1.39 | 13d | 1 | 1.20mi |
Listing history 25 events
-
2026-06-18days on market $160,000 Active 144 DOM
-
2026-06-17days on market $160,000 Active 143 DOM
-
2026-06-16days on market $160,000 Active 142 DOM
-
2026-06-15days on market $160,000 Active 141 DOM
-
2026-06-14days on market $160,000 Active 139 DOM
-
2026-06-13days on market $160,000 Active 138 DOM
-
2026-06-10days on market $160,000 Active 136 DOM
-
2026-06-09days on market $160,000 Active 135 DOM
-
2026-06-08days on market $160,000 Active 134 DOM
-
2026-06-07days on market $160,000 Active 133 DOM
-
2026-06-05days on market $160,000 Active 130 DOM
-
2026-06-03days on market $160,000 Active 129 DOM
-
2026-06-03days on market $160,000 Active 128 DOM
-
2026-06-01days on market $160,000 Active 127 DOM
-
2026-05-31days on market $160,000 Active 126 DOM
-
2026-05-30days on market $160,000 Active 125 DOM
-
2026-01-25$160,000 Active
-
2025-03-20price $165,000
-
2025-01-10$175,000 Active
-
2024-05-07historical $1,600
-
2023-12-20$1,600
-
2023-12-06price $185,000
-
2023-09-07price $189,000
-
2023-07-11price $199,000
-
2023-04-25$217,000 Active
ⓘ Source: listings_history table (triggers on properties + properties_extension) + one-shot
backfill from property_details.listing_events for pre-trigger history.
Climate risk First Street
- Flood 1/10 Low FEMA zone X (unshaded) · 0% chance over 30 yrs
- Wildfire 4/10 Moderate
- Heat 9/10 Extreme 7 d/yr ≥107°F today · 20 d/yr by 30 yrs out
- Wind 9/10 Extreme 99% chance of damaging wind over 30 yrs
- Air quality 1/10 Low 0 unhealthy d/yr today · 0 by 30 yrs out
Nearby sold comps map
Loading sold comps map…
Walkable amenities ~0.75 mi
Loading nearby amenities…
Taxation est. · year 1
- Rental income
- $17,711
- − Mortgage interest
- −$8,962
- − Property taxes
- −$2,400
- − Insurance
- −$800
- − Repairs & maintenance
- −$1,417
- − Management
- −$1,417
- − Depreciation
- −$4,655
- Taxable loss
- −$1,940
- Est. tax savings @ 24.0%
- +$466
- After-tax cash flow
- $1,189/yr
For passive investors: Depreciation is non-cash, so a rental often shows a tax loss while cash-flowing — sheltering income. Rental losses are passive: they offset passive income freely, and up to $25,000/yr can offset ordinary (W-2) income if you actively participate and your MAGI is under $100k (phasing out to $0 by $150k); unused losses carry forward. On sale, claimed depreciation is recaptured at up to 25%, and gains may owe capital-gains tax (a 1031 exchange can defer both). Figures are a year-1 estimate at your 24.0% rate — not tax advice; consult a CPA.
Schools (NCES district)
- District
- Walton
- NCES district ID
- 1201980
- Math proficiency
- 62% ▼ -4.00%
- Reading proficiency
- 61% ▼ -2.00%
- Median HH income
- $46,794
- Composite
- 52.03/100
- National rank
- #1634
- State rank
- #10 of 73 in FL
Livability — DeFuniak Springs
- Score
- 64/100
- State rank
- #694
- US rank
- #14475
Category grades
Schools grade is shown separately in the Schools card above.
Census & demographics
- Census place
- DeFuniak Springs, FL
- County
- Walton County · 70,839 people
- City population
- 19,746
- Metro
- Crestview-Fort Walton Beach-Destin, FL
- Population (ZIP)
- 19,746
- Household income
- $52,199
- Rent vs Own
- Severe rent burden
- 356.0
Population outlook (Walton County) Hauer SSP2
- Today (2025)
- 80,014 people
- By 2030
- 88,120 · +10.1%
- By 2040
- 103,537 · +29.4%
- By 2050
- 117,034 · +46.3%
- By 2075
- 143,901 · +79.8%
- By 2100
- 155,138 · +93.9%
Race, ethnicity, and origin ACS 2023
- Neighborhood character
- Predominantly White (75%)
- Race & ethnicity
- White 75% Black 10% Hispanic / Latino 8% Two or more races 7% Native American 1%
- Hispanic origin (detail)
- Mexican 5%
- Common ancestry
- Slovak 3% Italian 2% Lithuanian 2%
- Foreign-born
- 6% · Canada
- Languages at home
- 92% English-only · Spanish 4% Other Indo-European 1% French/Haitian/Cajun 1%
Political lean MEDSL · Walton
- 2024 margin
- Solid R (+57.8) · D 20.7% · R 78.6%
- 2008→2024 swing
- -12.0pp toward R · 2008: -45.8pp · 2024: -57.8pp
- All cycles
- 2024: R+57.8 2020: R+51.7 2016: R+56.1 2012: R+52.0 2008: R+45.8
Not yet ingested
- Civics
- —
Market trends
- HPI YoY
- ▲ 14.77%
- Current HPI
- 367.046
- Rent YoY
- —
- Metro
- Crestview-Fort Walton Beach-Destin, FL
- State GDP YoY
- ▲ 3.28%
- F500 in state
- 36
Industry mix (Fortune 500 HQ in FL)
| Industry | F500 HQs | Revenue |
|---|---|---|
| Industrial Technology | 2 | $29B |
|
||
| Insurance | 2 | $17B |
|
||
| Retail | 1 | $60B |
|
||
| Technology Distribution | 1 | $58B |
|
||
| Homebuilding | 1 | $35B |
|
||
| Technology Manufacturing | 1 | $35B |
|
||
Price history
-26.3% since first listed9 events — show timeline
- 2026-01-25 Listed $160,000 ECAR
- 2025-03-20 Price Changed $165,000 ECAR
- 2025-01-10 Listed $175,000 ECAR
- 2024-05-07 Rental Removed $1,600 ECAR
- 2023-12-20 Listed for Rent $1,600 ECAR
- 2023-12-06 Price Changed $185,000 ECAR
- 2023-09-07 Price Changed $189,000 ECAR
- 2023-07-11 Price Changed $199,000 ECAR
- 2023-04-25 Listed $217,000 ECAR
Cash-flow waterfall
monthlySold comps — $/sqft
last 12 mo · ≤1 miLoading sold comps…