 🏗️ New Construction
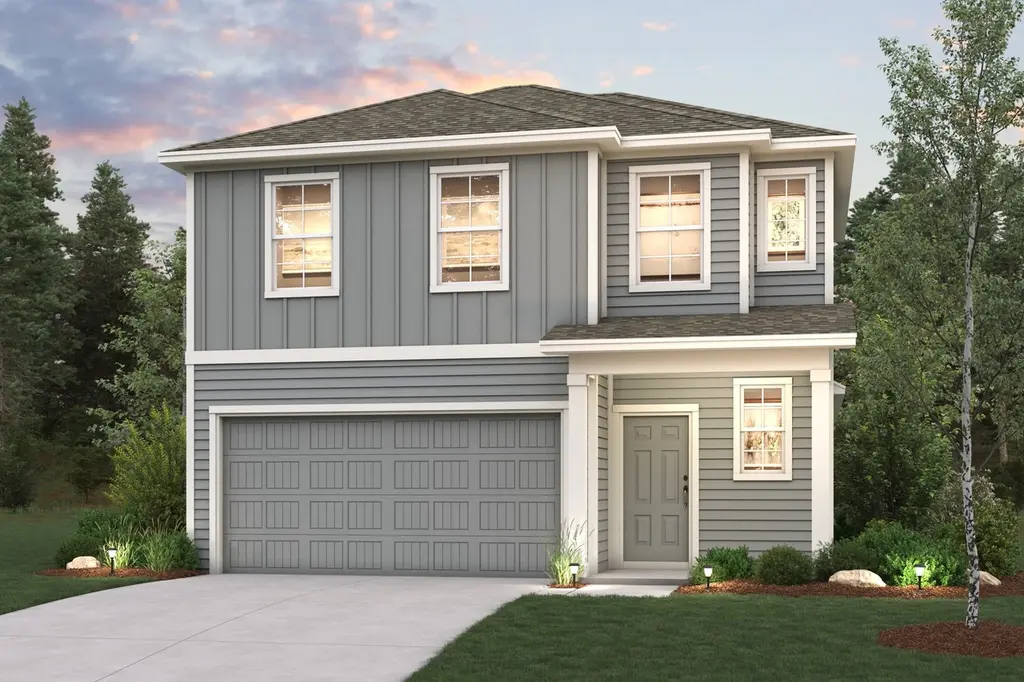
LEXINGTON Plan · Barrett, TX
Flood risk No data
- FEMA flood zone
- —
- Chance of flooding over 30 yrs
- —
- Est. flood insurance / yr
- —
Fire risk No data
- Est. fire insurance / yr
- —
Heat risk No data
- Hot days now (above threshold)
- —
- Hot days in 30 yrs
- —
Wind risk No data
- Chance of severe wind over 30 yrs
- —
Air-quality risk No data
- Unhealthy air days now
- —
- Unhealthy air days in 30 yrs
- —
Risk factors via First Street. Map © Google.
Why this score? — see what drove the D- grade
The composite is a weighted blend of 9 inputs, each scored 0–100. Each bar is that input's sub-score; the figure is the points it added to the 100-point composite (weight × sub-score).
- Cash flow +11.8/30.0
- ARV discount +7.5/15.0
- Condition / age +4.0/5.0
- DSCR +3.5/10.0
- Schools +3.5/10.0
- 1% rule +3.4/10.0
- Rent growth +2.9/5.0
- Livability +2.8/5.0
- Appreciation +0.0/10.0
$255,990
🖨 Deal sheet (PDF) 📄 Offer letter ✓ Due diligence
Listing remarks MLS
The open-concept design of the two-story Lexington floor plan shows the huge island kitchen connected to the great room and dining room. The open-feel of the home is popular with today's sophisticated buyer, who is looking for a design that fosters togetherness in the home and makes entertaining fun. The use of space in the Lexington is well thought out, with the primary suite privately situated on the first floor, while the secondary bedrooms are on the second floor.
Key facts
- 2 garage spots
- Listed 900 days
Neighborhood map
What this means for you Summary
Snapshot
- This is a 4-bed/2.5-bath single-family listed at $256k. Condition is rated good.
Deal economics
- At list price, monthly cash flow is $-71 ($-856/yr) — negative.
- To cash-flow at today's rent, offer at most $254k (0.6% below list).
- To meet the 1% rule (rent ≥ 1% of price), the offer needs to be $223k (13.1% below list).
- Recommended offer: $223k (13.1% below list) — sets the bar for 1% rule.
Location & tenants
- Location reads 56/100 on livability (#1,335 in TX) — a working-class tenant base; expect higher turnover. Strengths: cost of living A+, housing A-, crime B+; Watch: employment D, amenities F, commute F.
- Crosby ISD (rural): math 39% / reading 40% proficiency, ranked #369 of 826 in TX (top 45%) — families likely to look elsewhere, expect single-tenant / working-renter base with shorter leases.
- Zoned schools: Crosby Middle (math 36% / reading 37%, grade F, #786 of 1,662 statewide, top 48%, 1,549 students, 60% FRL).
- Market conditions: Rents rising (+1.5%/yr); 1189 active listings in the ZIP; solid renter incomes; 29,883 units permitted in Harris County in 2024 (8,621 in 5+ unit buildings).
Forward outlook
- Local home prices are declining (-3.0%/yr); year-one equity from $2k of loan paydown is wiped out by about $8k of value loss. Plan a longer hold.
- Harris County population projected at +47% by 2050 — long-run rental-demand tailwind backs the buy-and-hold thesis.
Negotiation context
- It's been on market 900 days — a 12% lower offer ($225k) is reasonable based on typical stale-listing flexibility.
Questions for the listing agent
- What do current leases actually rent for vs. the listed asking? Can we see a recent rent roll and the last 12 months of T-12 income?
- It's been on market 900 days. Have you received any prior offers? Is the seller open to a 13% concession, seller financing, or rate buy-down credit?
- Why hasn't it sold? Are there any deal-killer items the seller is aware of (foundation, flood, title, zoning, code violations)?
- Is there a deadline driving the sale (1031 exchange, divorce, estate, relocation)? That informs how much negotiation room exists.
- Schools are F-rated, which usually means shorter tenancies and higher turnover. Who's the typical renter profile here, and what's been the actual vacancy rate?
- The area grade is low — what's the realistic commute time and amenity access for the typical tenant pool here? Any planned neighborhood developments (good or bad) we should know about?
- What's the average days-on-market for RENTAL listings here right now (not sales)? A rising rental-DOM trend means longer vacancies and softer asking-rent achievability than the comps imply.
- What's the recent tenant-quality profile in this submarket — average credit score on applications, eviction rate, late-payment / NSF rate, and stable-employment percentage? A property-management company in the area should have these aggregated.
- How much new for-sale + rental construction is in the pipeline within 1–3 miles? Heavy new supply typically softens prices + rents 12–24 months out; constrained supply supports both.
Investment metrics
- 1% rule
- 0.84% ✗
- Cap rate
- 5.97%
- Cash-on-cash
- -1.15%
- DSCR
- 0.95
- GRM
- 9.9
CMA / ARV
- ARV (median comp)
- $264,713
- List price
- $255,990
- Delta
- -3.30%
- Verdict
- FAIR
- Comps
- 20 within 1.0 mi
Show comp detail 12 sales within ~0.75 mi
| Address | Dist | Beds/Ba | Sqft | Sold | Price | $/sf | Match |
|---|---|---|---|---|---|---|---|
| 410 Harrison Hope Dr | 0.05mi | 4/2.5 | 1,785 (0%) | 2mo | $267,900 | $150 | 96 |
| 418 Harrison Hope Dr | 0.06mi | 4/2.5 | 1,785 (0%) | 2mo | $268,900 | $151 | 95 |
| 11607 Heritage Wind Dr | 0.09mi | 4/2.5 | 1,785 (0%) | 1mo | $267,900 | $150 | 95 |
| 11638 Heritage Wind Dr | 0.14mi | 4/2.5 | 1,785 (0%) | 3mo | $274,900 | $154 | 91 |
| 406 Harrison Hope Dr | 0.05mi | 4/2.5 | 2,003 (+12%) | 1mo | $269,900 | $135 | 77 |
| 414 Harrison Hope Dr | 0.06mi | 4/2.0 | 1,582 (-11%) | 2mo | $244,900 | $155 | 74 |
| 11615 Heritage Wind Dr | 0.10mi | 4/2.5 | 2,003 (+12%) | 1mo | $269,900 | $135 | 74 |
| 11511 Gristmill Grange Dr | 0.08mi | 4/2.5 | 2,003 (+12%) | 5mo | $263,900 | $132 | 72 |
| 11626 Heritage Wind Dr | 0.13mi | 4/2.0 | 1,582 (-11%) | 2mo | $252,900 | $160 | 71 |
| 427 Century Farm Dr | 0.14mi | 4/2.5 | 2,003 (+12%) | 2mo | $269,900 | $135 | 71 |
| 438 Harrison Hope Dr | 0.10mi | 4/2.0 | 1,582 (-11%) | 4mo | $239,900 | $152 | 71 |
| 446 Harrison Hope Dr | 0.12mi | 4/2.0 | 1,582 (-11%) | 5mo | $244,900 | $155 | 70 |
Match score weights: distance 35% · size 25% · config 20% · recency 20%. Top-matched comps best support the ARV.
Projected returns pro-forma
-3.0% appreciation · 1.48% rent growth · sell at horizon
- IRR
- -19.9%
- Equity multiple
- 0.32×
- Total profit
- $-50,757
- Equity at exit
- $39,470
- IRR
- -16.4%
- Equity multiple
- 0.15×
- Total profit
- $-63,255
- Equity at exit
- $22,888
Cash invested: $74,120 (down + closing). Projections, not guarantees.
Landlord ↔ Tenant lean methodology
- Overall (STATE)
- 87 Strongly Landlord-Friendly
- State Texas
- 87 Strongly Landlord-Friendly · R+5
- County
- — inherits STATE
- City
- — inherits STATE
ZIP-level market 77532
- Home prices YoY
- -28.6%
- Rents YoY
- 1.5%
- Active inventory
- 1189
- Price-to-rent
- 9.6×
Monthly cashflow live
- Estimated rent
- $2,225 medium interval (Pro) →
- Mortgage (P&I)
- −$1,388
- Tax est. 1.5%
- −$331 /mo · $3,971/yr
- Insurance
- −$110
- HOA
- −$0
- Vacancy / Maint / Mgmt
- −$467
- Net cashflow
- $-71
Break-even live
Sensitivity live
| Price | -10% $112 | -5% $20 | +0% $-71 | +5% $-163 | +10% $-254 |
|---|---|---|---|---|---|
| Rent | -10% $-247 | -5% $-159 | +0% $-71 | +5% $17 | +10% $104 |
| Rate | -1.0pp $62 | -0.5pp $-4 | base $-71 | +0.5pp $-140 | +1.0pp $-210 |
UW: 25.0% down · 7.5% · 30yr · 1.5% tax · 5.0% vac · 8.0% maint · 8.0% mgmt
Financing live
Cash to close
- Down payment
- $66,178
- Closing costs
- $7,941
- Reserves months
- —
- Total cash needed
- —
Loan-product check · same deal, 3 products live
Conventional
25% down · 7.5% · 30yr
- Down + closing
- —
- Monthly P&I
- —
- Monthly cashflow
- —
- DSCR
- —
- Eligible?
- —
Personal DTI + credit; lowest rate.
DSCR
20% down · 8.5% · 30yr
- Down + closing
- —
- Monthly P&I
- —
- Monthly cashflow
- —
- DSCR
- —
- Eligible?
- —
No personal income docs; deal must DSCR.
Hard money
10% down · 12.0% · 12mo
- Down + closing
- —
- Monthly P&I
- —
- Monthly cashflow
- —
- DSCR
- —
- Eligible?
- —
Short-term bridge; refi at stabilization.
Listing history 16 events
-
2026-06-21days on market $255,990 Active 900 DOM
-
2026-06-18days on market $255,990 Active 897 DOM
-
2026-06-17days on market $255,990 Active 896 DOM
-
2026-06-16days on market $255,990 Active 895 DOM
-
2026-06-15days on market $255,990 Active 894 DOM
-
2026-06-13days on market $255,990 Active 892 DOM
-
2026-06-09days on market $255,990 Active 888 DOM
-
2026-06-08days on market $255,990 Active 887 DOM
-
2026-06-07days on market $255,990 Active 886 DOM
-
2026-06-04days on market $255,990 Active 883 DOM
-
2026-06-02days on market $255,990 Active 881 DOM
-
2026-06-01days on market $255,990 Active 880 DOM
-
2026-05-31days on market $255,990 Active 879 DOM
-
2025-06-12price $255,990 472-char remark
Show marketing remark (472 chars)
The open-concept design of the two-story Lexington floor plan shows the huge island kitchen connected to the great room and dining room. The open-feel of the home is popular with today's sophisticated buyer, who is looking for a design that fosters togetherness in the home and makes entertaining fun. The use of space in the Lexington is well thought out, with the primary suite privately situated on the first floor, while the secondary bedrooms are on the second floor.
-
2025-01-01price $261,990 472-char remark
Show marketing remark (472 chars)
The open-concept design of the two-story Lexington floor plan shows the huge island kitchen connected to the great room and dining room. The open-feel of the home is popular with today's sophisticated buyer, who is looking for a design that fosters togetherness in the home and makes entertaining fun. The use of space in the Lexington is well thought out, with the primary suite privately situated on the first floor, while the secondary bedrooms are on the second floor.
-
2024-01-03$260,990 Active 472-char remark
Show marketing remark (472 chars)
The open-concept design of the two-story Lexington floor plan shows the huge island kitchen connected to the great room and dining room. The open-feel of the home is popular with today's sophisticated buyer, who is looking for a design that fosters togetherness in the home and makes entertaining fun. The use of space in the Lexington is well thought out, with the primary suite privately situated on the first floor, while the secondary bedrooms are on the second floor.
ⓘ Source: listings_history table (triggers on properties + properties_extension) + one-shot
backfill from property_details.listing_events for pre-trigger history.
Nearby sold comps map
Loading sold comps map…
Walkable amenities ~0.75 mi
Loading nearby amenities…
Taxation est. · year 1
- Rental income
- $26,704
- − Mortgage interest
- −$14,828
- − Property taxes
- −$3,971
- − Insurance
- −$1,324
- − Repairs & maintenance
- −$2,136
- − Management
- −$2,136
- − Depreciation
- −$7,701
- Taxable loss
- −$5,391
- Est. tax savings @ 24.0%
- +$1,294
- After-tax cash flow
- $438/yr
For passive investors: Depreciation is non-cash, so a rental often shows a tax loss while cash-flowing — sheltering income. Rental losses are passive: they offset passive income freely, and up to $25,000/yr can offset ordinary (W-2) income if you actively participate and your MAGI is under $100k (phasing out to $0 by $150k); unused losses carry forward. On sale, claimed depreciation is recaptured at up to 25%, and gains may owe capital-gains tax (a 1031 exchange can defer both). Figures are a year-1 estimate at your 24.0% rate — not tax advice; consult a CPA.
Condition & rehab AI · 5 photos
The Lexington floor plan is move-in ready with an open-concept design and modern finishes. Minor updates to the exterior and interior can further enhance its curb appeal and value.
Value-add opportunities
- Both Painting exterior and interior walls — Fresh paint enhances curb appeal and interior aesthetics.
- Both Landscaping improvements — Enhances curb appeal and adds value to the property.
- Resale Kitchen appliances — Modern appliances improve the home's appeal to potential buyers.
- Resale Bathroom fixtures — Upgraded fixtures can attract more buyers and renters.
- Both Flooring replacement — Replacing worn-out flooring can improve the home's overall condition and appearance.
Renovation cost estimate screening
Value-add ROI direction
- Both Painting exterior and interior walls — Fresh paint enhances curb appeal and interior aesthetics. ↑
- Both Landscaping improvements — Enhances curb appeal and adds value to the property. ↑
- Resale Kitchen appliances — Modern appliances improve the home's appeal to potential buyers. ↑
- Resale Bathroom fixtures — Upgraded fixtures can attract more buyers and renters. ↑
- Both Flooring replacement — Replacing worn-out flooring can improve the home's overall condition and appearance. ↑
ⓘ Cost ranges are severity-bucket heuristics (US national rule-of-thumb). Get contractor quotes + a written scope before underwriting a rehab budget.
Schools (NCES district)
- District
- Crosby ISD
- NCES district ID
- 4815750
- Math proficiency
- 39% ▼ -13.00%
- Reading proficiency
- 40% ▼ -5.00%
- Median HH income
- $61,079
- Composite
- 35.14/100
- National rank
- #5012
- State rank
- #369 of 826 in TX
Livability — Barrett
- Score
- 56/100
- State rank
- #1335
- US rank
- #22991
Category grades
Schools grade is shown separately in the Schools card above.
Census & demographics
- Census place
- Barrett, TX
- County
- Harris County · 4,702,590 people
- City population
- 3,226,434
- Metro
- Houston-The Woodlands-Sugar Land, TX
- Population (ZIP)
- 33,780
- Household income
- $92,201
- Rent vs Own
- Severe rent burden
- 382.0
Population outlook (Harris County) Hauer SSP2
- Today (2025)
- 5,571,493 people
- By 2030
- 6,089,821 · +9.3%
- By 2040
- 7,142,806 · +28.2%
- By 2050
- 8,185,864 · +46.9%
- By 2075
- 10,574,329 · +89.8%
- By 2100
- 12,109,958 · +117.4%
Race, ethnicity, and origin ACS 2023
- Neighborhood character
- Diverse neighborhood (Simpson 0.60)
- Race & ethnicity
- White 54% Hispanic / Latino 31% Two or more races 16% Black 9%
- Hispanic origin (detail)
- Mexican 24%
- Common ancestry
- Lithuanian 4% Romanian 3% Italian 2%
- Foreign-born
- 10% · Canada
- Languages at home
- 78% English-only · Spanish 21%
Political lean MEDSL · Harris
- 2024 margin
- Lean D (+5.5) · D 52.0% · R 46.4% · Other 1.6%
- 2008→2024 swing
- +3.9pp toward D · 2008: 1.6pp · 2024: 5.5pp
- All cycles
- 2024: D+5.5 2020: D+13.3 2016: D+12.4 2012: D+0.1 2008: D+1.6
Not yet ingested
- Civics
- —
Market trends
- HPI YoY
- ▼ -105.63%
- Current HPI
- 264.0126
- Rent YoY
- ▲ 1.48%
- Metro
- Houston-The Woodlands-Sugar Land, TX
- State GDP YoY
- ▲ 3.95%
- F500 in state
- 110
Industry mix (Fortune 500 HQ in TX)
| Industry | F500 HQs | Revenue |
|---|---|---|
| Energy | 16 | $1,198B |
|
||
| Technology | 5 | $198B |
|
||
| Engineering / Construction | 4 | $72B |
|
||
| Energy Services | 3 | $60B |
|
||
| Utilities | 3 | $41B |
|
||
| Healthcare | 2 | $330B |
|
||
Price history
-1.9% since first listed3 events — show timeline
- 2025-06-12 Price Changed $255,990 Zillow
- 2025-01-01 Price Changed $261,990 Zillow
- 2024-01-03 Listed $260,990 Zillow
Cash-flow waterfall
monthlySold comps — $/sqft
last 12 mo · ≤1 miLoading sold comps…