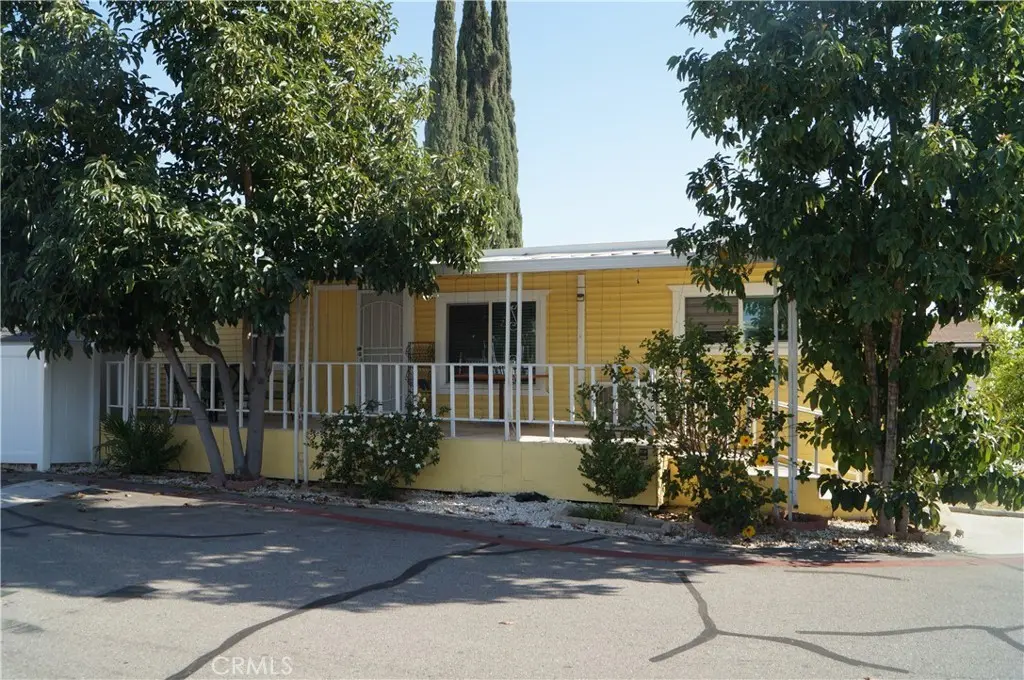
22111 Newport St #98 · Grand Terrace, CA
Flood risk 1/10 · Minimal
- FEMA flood zone
- X (unshaded)
- Chance of flooding over 30 yrs
- 0.0%
- Est. flood insurance / yr
- $507 – $1,088
Fire risk 6/10 · Moderate
- Est. fire insurance / yr
- $659 – $1,223
Heat risk 8/10 · Major
- Hot days now (above 102°F)
- 7 days/yr
- Hot days in 30 yrs
- 20 days/yr
Wind risk 1/10 · Minimal
- Chance of severe wind over 30 yrs
- —
Air-quality risk 9/10 · Severe
- Unhealthy air days now
- 22 days/yr
- Unhealthy air days in 30 yrs
- 27 days/yr
Risk factors via First Street. Map © Google.
Why this score? — see what drove the B+ grade
The composite is a weighted blend of 9 inputs, each scored 0–100. Each bar is that input's sub-score; the figure is the points it added to the 100-point composite (weight × sub-score).
- Cash flow +30.0/30.0
- ARV discount +15.0/15.0
- 1% rule +10.0/10.0
- DSCR +10.0/10.0
- Rent growth +3.1/5.0
- Livability +3.0/5.0
- Schools +2.4/10.0
- Condition / age +2.2/5.0
- Appreciation +0.0/10.0
$150,000
🖨 Deal sheet 📄 Offer letter ✓ Due diligence
Listing remarks MLS
This charming mobile home is located in the quiet and peaceful community of Grand Terrance, California. This cozy home features 3 bedrooms and 2 bathrooms, making it an ideal space for anyone. Upon entering the home, you are greeted with a spacious living room perfect for relaxing and entertaining guests. The kitchen is equipped with modern touches and convenient cabinet space, making meal preparation a breeze. Additionally, you'll find beautiful recessed lighting throughout the home, creating a warm and inviting ambiance that is perfect for relaxing and entertaining. The bedrooms in this home are well-sized and provide plenty of natural light. This mobile home also offers a covered carport and additional outdoor storage space for your convenience. The community is well-maintained and features a pool, which you can catch up with friends at the clubhouse, and includes a full-sized kitchen and ample space for parties and get-togethers.
Key facts
- Clubhouse
- Community pool
- Covered carport
Tags
Property features AI
Finance
- Other: Pets allowed with number limits and breed restrictions; Park name: Grand Royal Estates
- Financial info: Monthly land lease: $1,090 (seller provided)
- HOA & community: Land lease in park (Grand Royal Estates)
Exterior
- Parking: Covered parking; Attached carport (3 carport spaces); Driveway parking; Paved parking
- Utilities: Public/district water; Public sewer; Natural gas available; Electricity available; Cable available; Telephone available (in street); Underground utilities
- Home design: Single-story mobile home (model LA CORONA); Mobile home remains on site (20 ft by 54 ft); Turnkey and updated/remodeled condition; Faces north; One total story; Entry at front door
- Construction: Metal roof; Vinyl exterior fencing; Number of sheds: 2; Accessible design features (wide doors, no interior steps)
- Exterior features: Metal roof; Awning; Community pool; Shed (2 on property); Vinyl fencing in new condition; Corner lot; Level with street; Paved surfaces; Landscaped yard with front yard, back yard, lawn and garden; Street lighting
Interior
- Kitchen: Remodeled kitchen with quartz counters; Kitchen open to family room; Kitchen island; Self-closing drawers; Utility sink; Dishwasher; Gas cooktop; Gas range and gas oven; Range/stove hood; Microwave; Garbage disposal; Refrigerator; Gas water heater; Water heater unit
- Bedrooms: All bedrooms on main level
- Flooring: Laminated flooring
- Bathrooms: Two full bathrooms; Remodeled baths with quartz counters; Shower-in-tub and bathtub options; Exhaust fans; Closet in bathroom
- Heating & cooling: Heat pump (cooling available)
- Interior features: Unfurnished; Pantry; Living room deck attached; Recessed lighting; Open floor plan; Energy Star doors; Sliding glass doors; Double pane windows; No interior steps; Entry slope less than 1 foot; 32-inch-or-wider doors; Multiple access exits
- Laundry & utility: Washer included; Dryer included; Washer hookup; Gas dryer hookup; Laundry area inside (in kitchen area)
Neighborhood map
What this means for you Summary
Snapshot
- This is a 3-bed/2.0-bath manufactured listed at $150k. Condition is rated fair.
Deal economics
- At list price, monthly cash flow is $1k ($13k/yr) — positive.
- The deal already cash-flows at list — no discount required.
- Meets the 1% rule at list price ($3k rent vs $150k).
- Cap rate 14.8% vs local median 3.4% in Grand Terrace — top-decile yield for the area; either an underpriced asset or a hidden risk that comps aren't pricing in. Stress-test before assuming the spread holds.
Location & tenants
- Location reads 60/100 on livability (#592 in CA) — a middle-class / working-renter tenant base. Strengths: housing A+; Watch: amenities F, commute F, cost of living F.
- Colton Joint Unified (suburban): math 16% / reading 38% proficiency, ranked #373 of 517 in CA (top 72%) — low school quality limits family demand, transient renter base, plan for 1-2y turnover; 70% free/reduced lunch — lower-income household profile, screen leases tightly.
- Zoned schools: Grand Terrace Elementary (650 students, 82% FRL); Terrace Hills Middle (math 18% / reading 33%, grade F, #260 of 498 statewide, top 54%, 838 students, 74% FRL); Grand Terrace High Sch At The Ray Abril Jr. Edal Complex (math 20% / reading 58%, grade F, #558 of 1,170 statewide, top 48%, 1,726 students, 68% FRL) — zoned schools at 74% FRL track the district average.
- Market conditions: Rents rising (+2.4%/yr); 23 active listings in the ZIP; 12 comparable units currently listed for rent nearby; rentals at typical pace (median 19d on market — plan ~3-4 weeks tenant-placement turnaround); solid renter incomes; 5,458 units permitted in San Bernardino County in 2024 (1,500 in 5+ unit buildings).
- This rent runs 38% of the median local income ($84k/yr) — at the standard rent-burdened threshold; future hikes will face affordability resistance.
Forward outlook
- Local home prices are declining (-3.0%/yr); year-one equity from $1k of loan paydown is wiped out by about $4k of value loss. Plan a longer hold.
- San Bernardino County population projected at +15% by 2050 — modest demand growth; plan on rents tracking national, not racing it.
- At projected returns (-3.0% appreciation + 2.4% rent growth), your $42k cash investment doubles in ~5 years — after that, you're playing with house money.
Negotiation context
- Only 11 days on market — expect competitive offers; lowballing is unlikely to land.
- 4 sale attempts since 4y ago; this cycle's ask has dropped $70k (32%) from the opening price — seller is motivated, your offer sets the floor, not the list.
Risks & watch-outs
- Climate carrying-cost: major wildfire risk; extreme-heat days projected 7→20/yr by 2055 (HVAC capex compounding) — expect insurance premiums to compound above CPI over the hold.
Questions for the listing agent
- Have any recent inspections been done? Can we get a copy of the seller's disclosures and any deferred-maintenance estimates?
- Built in 1967 — when were the roof, HVAC, electrical panel, plumbing, and water heater last replaced?
- Is there a deadline driving the sale (1031 exchange, divorce, estate, relocation)? That informs how much negotiation room exists.
- Schools are D-rated, which usually means shorter tenancies and higher turnover. Who's the typical renter profile here, and what's been the actual vacancy rate?
- What's the average days-on-market for RENTAL listings here right now (not sales)? A rising rental-DOM trend means longer vacancies and softer asking-rent achievability than the comps imply.
- What's the recent tenant-quality profile in this submarket — average credit score on applications, eviction rate, late-payment / NSF rate, and stable-employment percentage? A property-management company in the area should have these aggregated.
- How much new for-sale + rental construction is in the pipeline within 1–3 miles? Heavy new supply typically softens prices + rents 12–24 months out; constrained supply supports both.
Investment metrics
- 1% rule
- 1.78% ✓
- Cap rate
- 14.83%
- Cash-on-cash
- 30.49%
- DSCR
- 2.36
- GRM
- 4.7
CMA / ARV
- ARV (on-the-fly)
- $187,920
- Comps found
- 5
Show comp detail 5 sales within ~0.75 mi
| Address | Dist | Beds/Ba | Sqft | Sold | Price | $/sf | Match |
|---|---|---|---|---|---|---|---|
| 22111 NEWPORT Ave #5 | 0.01mi | 3/2.0 | 1,128 (+4%) | 5mo | $175,000 | $155 | 88 |
| 22111 Newport Ave #68 | 0.02mi | 2/2.0 (-1) | 1,120 (+4%) | 1mo | $128,000 | $114 | 88 |
| 21845 Grand Terrace Rd #12 | 0.38mi | 3/2.0 | 1,008 (-7%) | 2mo | $175,960 | $175 | 70 |
| 21845 Grand Terrace Rd #22 | 0.35mi | 3/2.0 | 940 (-13%) | 6mo | $163,960 | $174 | 57 |
| 700 E Washington St #201 | 0.36mi | 3/2.0 | 1,224 (+13%) | 22mo | $425,000 | $347 | 42 |
Match score weights: distance 35% · size 25% · config 20% · recency 20%. Top-matched comps best support the ARV.
Projected returns pro-forma
-3.0% appreciation · 2.38% rent growth · sell at horizon
- IRR
- 24.5%
- Equity multiple
- 2.00×
- Total profit
- $42,047
- Equity at exit
- $22,365
- IRR
- 31.9%
- Equity multiple
- 3.80×
- Total profit
- $117,601
- Equity at exit
- $12,969
Cash invested: $42,000 (down + closing). Projections, not guarantees.
Landlord ↔ Tenant lean methodology
- Overall (STATE)
- 18 Strongly Tenant-Friendly
- State California
- 18 Strongly Tenant-Friendly · D+13
- County
- — inherits STATE
- City
- — inherits STATE
ZIP-level market 92313
- Rents YoY
- 2.4%
- Active inventory
- 23
- Price-to-rent
- 4.7×
Monthly cashflow live
- Estimated rent
- $2,663 high interval (Pro) →
- Mortgage (P&I)
- −$787
- Tax est. 1.5%
- −$188 /mo · $2,250/yr
- Insurance
- −$62
- HOA
- −$0
- Vacancy / Maint / Mgmt
- −$559
- Net cashflow
- $1,067
Break-even live
UW: 25.0% down · 7.5% · 30yr · 1.5% tax · 5.0% vac · 8.0% maint · 8.0% mgmt
Financing live
Cash to close
- Down payment
- $37,500
- Closing costs
- $4,500
- Reserves months
- —
- Total cash needed
- —
Loan-product check · same deal, 3 products live
Conventional
25% down · 7.5% · 30yr
- Down + closing
- —
- Monthly P&I
- —
- Monthly cashflow
- —
- DSCR
- —
- Eligible?
- —
Personal DTI + credit; lowest rate.
DSCR
20% down · 8.5% · 30yr
- Down + closing
- —
- Monthly P&I
- —
- Monthly cashflow
- —
- DSCR
- —
- Eligible?
- —
No personal income docs; deal must DSCR.
Hard money
10% down · 12.0% · 12mo
- Down + closing
- —
- Monthly P&I
- —
- Monthly cashflow
- —
- DSCR
- —
- Eligible?
- —
Short-term bridge; refi at stabilization.
Rent comps 12 comps
| Address | Beds | Baths | Sqft | Rent | $/sqft | DOM | Units | Dist |
|---|---|---|---|---|---|---|---|---|
| 12001 Vivienda Ave Grand Terrace, CA | 3.0 | 2.0 | 1048 | $3,100 | $2.96 | 44d | 1 | 0.24mi |
| 12005 Aspen Cir Grand Terrace, CA | 2.0 | 2.0 | 1100 | $2,395 | $2.18 | 44d | 1 | 0.40mi |
| 11750 Mount Vernon Ave Grand Terrace, CA | 1.0–2.0 | 1.0–2.0 | 776 | $2,348 | $3.03 | 2d | 13 | 0.40mi |
| 700 E Washington St Colton, CA | 3.0 | 2.0 | 1465 | $3,149 | $2.15 | 18d | 1 | 0.41mi |
| 700 E Washington St #130 Colton, CA | 3.0 | 2.0 | 1344 | $2,500 | $1.86 | 24d | 1 | 0.48mi |
| 800 E Washington St Colton, CA | 1.0–2.0 | 1.0–2.0 | 664 | $2,150 | $3.24 | 2d | 18 | 0.61mi |
| 12168 Mount Vernon Ave #31 Grand Terrace, CA | 3.0 | 3.0 | 1427 | $3,095 | $2.17 | 44d | 1 | 0.62mi |
| 22491 De Berry St Grand Terrace, CA | 1.0–2.0 | 1.0–2.0 | 875 | $1,900 | $2.17 | 2d | 18 | 0.82mi |
| 1043 Santo Antonio Dr Colton, CA | 1.0–2.0 | 1.0–2.0 | 933 | $2,320 | $2.49 | 2d | 5 | 1.05mi |
| 1251 S Meadow Ln #158 Colton, CA | 2.0 | 2.0 | 864 | $2,199 | $2.55 | 44d | 1 | 1.36mi |
| 1316 S Meadow Ln Colton, CA | 2.0–3.0 | 1.0–2.0 | 916 | $2,707 | $2.96 | 3d | 15 | 1.40mi |
| 1699 E Washington St Colton, CA | 1.0–2.0 | 1.0–2.0 | 845 | $2,318 | $2.74 | 2d | 9 | 1.44mi |
Listing history 9 events
-
2026-06-18days on market $150,000 Active 11 DOM
-
2026-06-17days on market $150,000 Active 10 DOM
-
2026-06-16days on market $150,000 Active 9 DOM
-
2026-06-15days on market $150,000 Active 8 DOM
-
2026-06-13days on market $150,000 Active 6 DOM
-
2026-06-13pricedays on market $150,000 Active 5 DOM
-
2026-06-09days on market $220,000 Active 2 DOM
-
2026-06-08remarks 699-char remark
-
2026-06-08$220,000 Active 1 DOM
ⓘ Source: listings_history table (triggers on properties + properties_extension) + one-shot
backfill from property_details.listing_events for pre-trigger history.
Climate risk First Street
- Flood 1/10 Low FEMA zone X (unshaded) · 0% chance over 30 yrs
- Wildfire 6/10 Major
- Heat 8/10 Severe 7 d/yr ≥102°F today · 20 d/yr by 30 yrs out
- Wind 1/10 Low
- Air quality 9/10 Extreme 22 unhealthy d/yr today · 27 by 30 yrs out
Nearby sold comps map
Loading sold comps map…
Walkable amenities ~0.75 mi
Loading nearby amenities…
Taxation est. · year 1
- Rental income
- $31,955
- − Mortgage interest
- −$8,402
- − Property taxes
- −$2,250
- − Insurance
- −$750
- − Repairs & maintenance
- −$2,556
- − Management
- −$2,556
- − Depreciation
- −$4,364
- Taxable income
- $11,076
- Est. tax owed @ 24.0%
- −$2,658
- After-tax cash flow
- $10,147/yr
For passive investors: Depreciation is non-cash, so a rental often shows a tax loss while cash-flowing — sheltering income. Rental losses are passive: they offset passive income freely, and up to $25,000/yr can offset ordinary (W-2) income if you actively participate and your MAGI is under $100k (phasing out to $0 by $150k); unused losses carry forward. On sale, claimed depreciation is recaptured at up to 25%, and gains may owe capital-gains tax (a 1031 exchange can defer both). Figures are a year-1 estimate at your 24.0% rate — not tax advice; consult a CPA.
Condition & rehab AI · 12 photos
This mobile home requires moderate repairs and maintenance to improve its condition and value. Painting, updating cabinets, and landscaping would significantly enhance its curb appeal and interior aesthetics.
Repairs flagged
- Moderate Kitchen cabinets — Worn condition
- Moderate Kitchen countertops — Worn condition
- Moderate Bathroom fixtures — Worn condition
- Moderate Exterior siding — Worn condition
- Moderate Flooring — Worn condition
- Moderate Paint — Scuffs and marks
- Moderate Windows — Signs of wear
- Moderate HVAC unit — Signs of wear
Value-add opportunities
- Both Painting and updating kitchen cabinets — Improves curb appeal and interior aesthetics
- Both Landscaping and trimming — Enhances curb appeal and creates a more inviting exterior
- Both HVAC unit replacement — Improves comfort and energy efficiency
Renovation cost estimate screening
| Repair item | Severity | Est. cost |
|---|---|---|
| Kitchen cabinets · Worn condition | Moderate | $3,000–15,000 |
| Kitchen countertops · Worn condition | Moderate | $3,000–15,000 |
| Bathroom fixtures · Worn condition | Moderate | $3,000–15,000 |
| Exterior siding · Worn condition | Moderate | $3,000–15,000 |
| Flooring · Worn condition | Moderate | $3,000–15,000 |
| Paint · Scuffs and marks | Moderate | $3,000–15,000 |
| Windows · Signs of wear | Moderate | $3,000–15,000 |
| HVAC unit · Signs of wear | Moderate | $3,000–15,000 |
| Total estimated repair cost · 8 items | $24,000–120,000 |
Value-add ROI direction
- Both Painting and updating kitchen cabinets — Improves curb appeal and interior aesthetics ↑
- Both Landscaping and trimming — Enhances curb appeal and creates a more inviting exterior ↑
- Both HVAC unit replacement — Improves comfort and energy efficiency ↑
ⓘ Cost ranges are severity-bucket heuristics (US national rule-of-thumb). Get contractor quotes + a written scope before underwriting a rehab budget.
Schools (NCES district)
- District
- Colton Joint Unified
- NCES district ID
- 0609390
- Math proficiency
- 16% ▼ -9.00%
- Reading proficiency
- 38% ▼ -1.00%
- Median HH income
- $51,178
- Composite
- 23.74/100
- National rank
- #7820
- State rank
- #373 of 517 in CA
Livability — Grand Terrace
- Score
- 60/100
- State rank
- #592
- US rank
- #19184
Category grades
Schools grade is shown separately in the Schools card above.
Census & demographics
- Census place
- Grand Terrace, CA
- County
- San Bernardino County · 2,030,291 people
- City population
- 13,078
- Metro
- Riverside-San Bernardino-Ontario, CA
- Population (ZIP)
- 13,078
- Household income
- $83,628
- Rent vs Own
- Severe rent burden
- 398.0
Population outlook (San Bernardino County) Hauer SSP2
- Today (2025)
- 2,300,329 people
- By 2030
- 2,378,907 · +3.4%
- By 2040
- 2,523,137 · +9.7%
- By 2050
- 2,642,388 · +14.9%
- By 2075
- 2,880,769 · +25.2%
- By 2100
- 2,909,436 · +26.5%
Race, ethnicity, and origin ACS 2023
- Neighborhood character
- Diverse neighborhood (Simpson 0.60)
- Race & ethnicity
- Hispanic / Latino 53% White 33% Two or more races 15% Asian 4% Black 4% Pacific Islander 2%
- Hispanic origin (detail)
- Mexican 42% Puerto Rican 2%
- Common ancestry
- Lithuanian 2% Serbian 2% Armenian 2%
- Foreign-born
- 14% · Canada, China
- Languages at home
- 65% English-only · Spanish 29% Other Asian/Pacific 2% Arabic 1%
Political lean MEDSL · San Bernardino
- 2024 margin
- Toss-up / Even · D 47.5% · R 49.7% · Other 2.8%
- 2008→2024 swing
- -8.5pp toward R · 2008: 6.3pp · 2024: -2.1pp
- All cycles
- 2024: R+2.1 2020: D+10.7 2016: D+9.8 2012: D+5.4 2008: D+6.3
Not yet ingested
- Civics
- —
Market trends
- HPI YoY
- ▼ -235.93%
- Current HPI
- 344.0046
- Rent YoY
- ▲ 2.38%
- Metro
- Riverside-San Bernardino-Ontario, CA
- State GDP YoY
- ▲ 3.21%
- F500 in state
- 116
Industry mix (Fortune 500 HQ in CA)
| Industry | F500 HQs | Revenue |
|---|---|---|
| Technology | 27 | $1,492B |
|
||
| Financial Services | 3 | $174B |
|
||
| Retail | 3 | $44B |
|
||
| Insurance | 3 | $26B |
|
||
| Media / Entertainment | 2 | $115B |
|
||
| Pharmaceuticals / Biotech | 2 | $62B |
|
||
Price history
+58.3% since first listed7 events — show timeline
- 2026-06-07 Listed $220,000 CRMLS
- 2023-05-12 Sold (MLS) $140,000 CRMLS
- 2023-04-13 Pending — CRMLS
- 2023-04-07 Relisted — CRMLS
- 2023-03-31 Listed $130,000 CRMLS
- 2022-03-30 Listing Removed — CRMLS
- 2022-02-21 Listed $139,000 CRMLS
Cash-flow waterfall
monthlySold comps — $/sqft
last 12 mo · ≤1 miLoading sold comps…