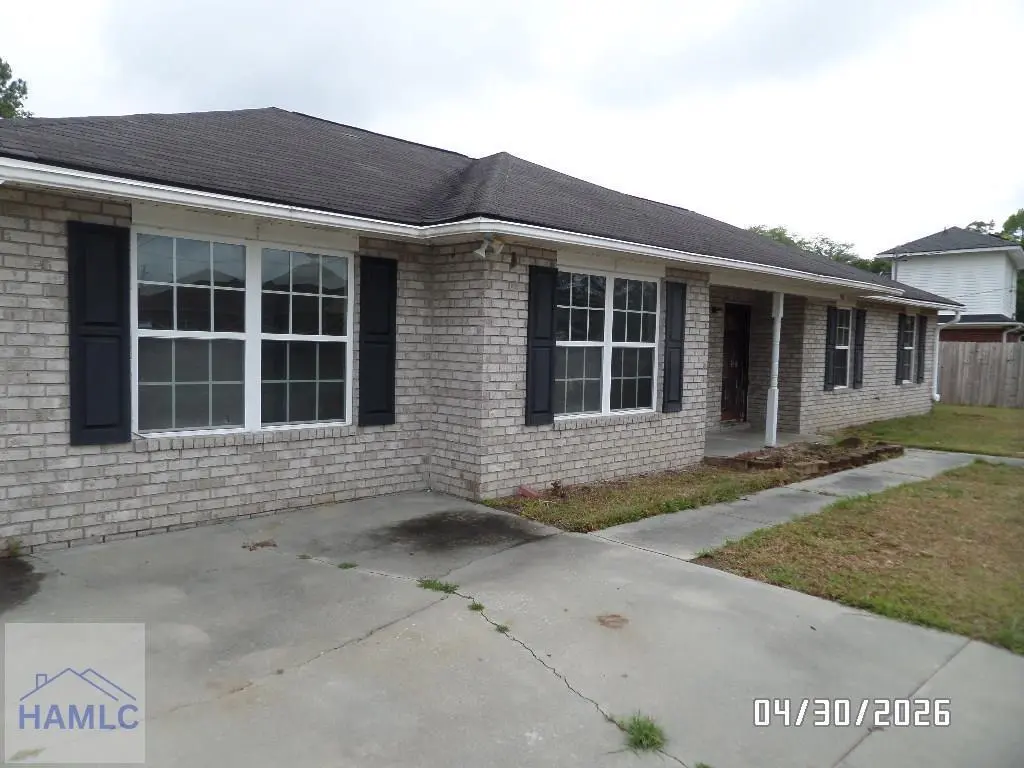
963 Yale Ct · Hinesville, GA
Flood risk 1/10 · Minimal
- FEMA flood zone
- X (unshaded)
- Chance of flooding over 30 yrs
- 0.0%
- Est. flood insurance / yr
- $507 – $1,088
Fire risk 5/10 · Moderate
- Est. fire insurance / yr
- $963 – $1,789
Heat risk 9/10 · Severe
- Hot days now (above 111°F)
- 7 days/yr
- Hot days in 30 yrs
- 18 days/yr
Wind risk 8/10 · Major
- Chance of severe wind over 30 yrs
- 98.0%
Air-quality risk 2/10 · Minimal
- Unhealthy air days now
- 2 days/yr
- Unhealthy air days in 30 yrs
- 2 days/yr
Risk factors via First Street. Map © Google.
Why this score? — see what drove the D+ grade
The composite is a weighted blend of 9 inputs, each scored 0–100. Each bar is that input's sub-score; the figure is the points it added to the 100-point composite (weight × sub-score).
- ARV discount +15.0/15.0
- Cash flow +13.6/30.0
- 1% rule +5.1/10.0
- DSCR +4.1/10.0
- Rent growth +3.9/5.0
- Livability +3.7/5.0
- Condition / age +2.5/5.0
- Schools +2.0/10.0
- Appreciation +0.0/10.0
$194,685
🖨 Deal sheet (PDF) 📄 Offer letter ✓ Due diligence
Listing remarks
Livingroom, family room, 3 bedrooms. Easy to view. All Showings Through Showing Time ALL offers must be submitted atwww. vrmproperties.com. Agentsmust register as a User, enter the property address, and click on “Start Offer”. This property may qualify forSeller Financing (Vendee). If theProperty was built before 1978, lead-based paint Potentially Exists. IMPORTANT: If the Seller selects your offer, the Sales Contract will be generated using the data entered into the website. To avoid delays in executing the Sales Contract, please enter dataas you want it to appearon the Sales Contract SOLD AS IS. Pre-Approval Letter and EM made out to Closing Attorney
Key facts
- 45 acre lot
- Built 2004
- Listed 21 days
Property features AI
Finance
- Other: Located in the Churchfield Estates subdivision; Listing broker: Exit Team Realty
Exterior
- Parking: Driveway; No garage
- Utilities: Public water
- Home design: Single-family residential property
- Construction: Brick veneer construction; Slab foundation; Built as residential single family
- Exterior features: Shingle roof; Outbuilding; No fencing; Paved road access; 45-acre lot
Interior
- Kitchen: Dishwasher; Electric range; Refrigerator
- Bathrooms: 2 full bathrooms
- Interior features: Dishwasher; Electric range; Refrigerator; Electric water heater; No fireplace; 6 total rooms
- Laundry & utility: Electric water heater
Neighborhood map
What this means for you Summary
Snapshot
- This is a 3-bed/2.0-bath single-family listed at $195k.
Deal economics
- At list price, monthly cash flow is $11 ($132/yr) — positive.
- The deal already cash-flows at list — no discount required.
- Meets the 1% rule at list price ($2k rent vs $195k).
- Recommended offer: $192k (1.5% below list) — sets the bar for market timing.
- Cap rate 6.4% vs local median 5.2% in Hinesville — meaningfully above typical; check what's discounted (condition, days-on-market, listing class) to confirm the premium yield is real.
Location & tenants
- Location reads 73/100 on livability (#51 in GA) — a middle-class / working-renter tenant base. Strengths: cost of living A+, housing A+, health & safety A+; Watch: schools D+, commute D+, crime F.
- Liberty County (urban): math 19% / reading 28% proficiency, ranked #133 of 174 in GA (top 76%) — low school quality limits family demand, transient renter base, plan for 1-2y turnover.
- Market conditions: Rents rising fast (+5.4%/yr); 639 active listings in the ZIP; 17 comparable units currently listed for rent nearby; rentals lingering (median 46d on market — plan ~5-8 weeks vacancy on turnover, expect pricing pressure); 100% of comp listings sitting > 30 days — soft ceiling on asking rent; 471 units permitted in Liberty County in 2024 (0 in 5+ unit buildings).
- This rent runs 39% of the median local income ($60k/yr) — at the standard rent-burdened threshold; future hikes will face affordability resistance.
Forward outlook
- Local home prices are declining (-3.0%/yr); year-one equity from $1k of loan paydown is wiped out by about $6k of value loss. Plan a longer hold.
- Liberty County population projected to shrink 8% by 2050 — rents likely to lag national; underwrite the cash flow, not the appreciation.
Negotiation context
- It's been on market 21 days — a 2% lower offer ($192k) is reasonable based on typical stale-listing flexibility.
- 3 sale attempts since 12y ago with the ask held roughly flat each time — persistent listings suggest the price (not the market) is what's stuck; bring a comps-based counter.
- Current owner paid $132k; 48% above their basis — modest negotiation headroom, anchor on the comps not their cost.
Risks & watch-outs
- Watch-outs: property tax is 2.7% of price.
- Climate carrying-cost: severe wind risk, 98% chance of damaging wind over 30y; moderate wildfire risk; extreme-heat days projected 7→18/yr by 2055 (HVAC capex compounding) — expect insurance premiums to compound above CPI over the hold.
Questions for the listing agent
- Property tax is high relative to price — has the assessment been appealed recently, and will the sale trigger a re-assessment?
- Is there a deadline driving the sale (1031 exchange, divorce, estate, relocation)? That informs how much negotiation room exists.
- Schools are D-rated, which usually means shorter tenancies and higher turnover. Who's the typical renter profile here, and what's been the actual vacancy rate?
- Crime grade is F in this area — have there been break-ins, vandalism, or insurance claims at this property in the last 3 years? What carrier currently insures it and at what premium?
- The area grade is low — what's the realistic commute time and amenity access for the typical tenant pool here? Any planned neighborhood developments (good or bad) we should know about?
- What's the average days-on-market for RENTAL listings here right now (not sales)? A rising rental-DOM trend means longer vacancies and softer asking-rent achievability than the comps imply.
- What's the recent tenant-quality profile in this submarket — average credit score on applications, eviction rate, late-payment / NSF rate, and stable-employment percentage? A property-management company in the area should have these aggregated.
- How much new for-sale + rental construction is in the pipeline within 1–3 miles? Heavy new supply typically softens prices + rents 12–24 months out; constrained supply supports both.
Investment metrics
- 1% rule
- 1.01% ✓
- Cap rate
- 6.36%
- Cash-on-cash
- 0.24%
- DSCR
- 1.01
- GRM
- 8.2
CMA / ARV
- ARV (on-the-fly)
- $285,089
- Comps found
- 12
Show comp detail 12 sales within ~0.75 mi
| Address | Dist | Beds/Ba | Sqft | Sold | Price | $/sf | Match |
|---|---|---|---|---|---|---|---|
| 1201 Langston Ln | 0.09mi | 4/2.0 (+1) | 1,976 (-4%) | 22mo | $274,000 | $139 | 66 |
| 624 Amhearst Row | 0.66mi | 3/2.5 | 2,039 (-1%) | 1mo | $217,500 | $107 | 66 |
| 1006 Canton Ct | 0.27mi | 4/2.5 (+1) | 2,114 (+3%) | 17mo | $268,000 | $127 | 61 |
| 629 Amhearst Row | 0.63mi | 3/2.5 | 2,046 (-0%) | 14mo | $275,000 | $134 | 57 |
| 161 Alcott Cir | 0.39mi | 4/2.5 (+1) | 2,171 (+6%) | 24mo | $302,000 | $139 | 45 |
| 310 Alcott Cir | 0.51mi | 4/2.0 (+1) | 2,273 (+11%) | 11mo | $299,000 | $132 | 44 |
| 600 Kendal Ct | 0.74mi | 4/2.0 (+1) | 2,003 (-2%) | 16mo | $292,000 | $146 | 44 |
| 513 Cascade Ct | 0.73mi | 4/2.0 (+1) | 1,923 (-6%) | 9mo | $318,000 | $165 | 43 |
| 1000 Miles Xing | 0.65mi | 3/2.0 | 1,860 (-9%) | 16mo | $279,000 | $150 | 40 |
| 362 Alcott Cir | 0.50mi | 4/3.0 (+1) | 2,280 (+11%) | 11mo | $293,000 | $129 | 40 |
| 1086 Ricade Dr | 0.61mi | 3/2.0 | 1,755 (-14%) | 14mo | $248,500 | $142 | 36 |
| 625 Amhearst Row | 0.61mi | 4/2.5 (+1) | 1,843 (-10%) | 16mo | $283,000 | $154 | 34 |
Match score weights: distance 35% · size 25% · config 20% · recency 20%. Top-matched comps best support the ARV.
Projected returns pro-forma
-3.0% appreciation · 5.41% rent growth · sell at horizon
- IRR
- -12.8%
- Equity multiple
- 0.53×
- Total profit
- $-25,812
- Equity at exit
- $29,028
- IRR
- 0.0%
- Equity multiple
- 1.00×
- Total profit
- $96
- Equity at exit
- $16,833
Cash invested: $54,512 (down + closing). Projections, not guarantees.
Landlord ↔ Tenant lean methodology
- Overall (STATE)
- 90 Strongly Landlord-Friendly
- State Georgia
- 90 Strongly Landlord-Friendly · R+3
- County
- — inherits STATE
- City
- — inherits STATE
ZIP-level market 31313
- Home prices YoY
- -27.1%
- Rents YoY
- 5.4%
- Active inventory
- 639
- Price-to-rent
- 8.2×
Monthly cashflow live
- Estimated rent
- $1,967 high interval (Pro) →
- Mortgage (P&I)
- −$1,021
- Tax from tax record
- −$441 /mo · $5,290/yr
- Insurance
- −$81
- HOA
- −$0
- Vacancy / Maint / Mgmt
- −$413
- Net cashflow
- $11
Break-even live
Sensitivity live
| Price | -10% $121 | -5% $66 | +0% $11 | +5% $-44 | +10% $-99 |
|---|---|---|---|---|---|
| Rent | -10% $-144 | -5% $-67 | +0% $11 | +5% $89 | +10% $166 |
| Rate | -1.0pp $109 | -0.5pp $61 | base $11 | +0.5pp $-39 | +1.0pp $-91 |
UW: 25.0% down · 7.5% · 30yr · 1.5% tax · 5.0% vac · 8.0% maint · 8.0% mgmt
Financing live
Cash to close
- Down payment
- $48,671
- Closing costs
- $5,841
- Reserves months
- —
- Total cash needed
- —
Loan-product check · same deal, 3 products live
Conventional
25% down · 7.5% · 30yr
- Down + closing
- —
- Monthly P&I
- —
- Monthly cashflow
- —
- DSCR
- —
- Eligible?
- —
Personal DTI + credit; lowest rate.
DSCR
20% down · 8.5% · 30yr
- Down + closing
- —
- Monthly P&I
- —
- Monthly cashflow
- —
- DSCR
- —
- Eligible?
- —
No personal income docs; deal must DSCR.
Hard money
10% down · 12.0% · 12mo
- Down + closing
- —
- Monthly P&I
- —
- Monthly cashflow
- —
- DSCR
- —
- Eligible?
- —
Short-term bridge; refi at stabilization.
Rent comps 17 comps
| Address | Beds | Baths | Sqft | Rent | $/sqft | DOM | Units | Dist |
|---|---|---|---|---|---|---|---|---|
| 945 Ruth Dr Hinesville, GA | 4.0 | 2.0 | 1910 | $1,900 | $0.99 | 45d | 1 | 0.03mi |
| 912 Pineland Ave Hinesville, GA | 3.0 | 2.5 | 1428 | $1,648 | $1.15 | 45d | 1 | 0.69mi |
| 1100 Pineland Ave Hinesville, GA | 2.0 | 2.5 | 1412 | $1,575 | $1.12 | 45d | 2 | 0.69mi |
| 203 Guyett Ave Hinesville, GA | 4.0 | 2.5 | 1593 | $2,000 | $1.26 | 45d | 1 | 0.71mi |
| 511 Wyckfield Way Hinesville, GA | 4.0 | 2.5 | 2070 | $2,475 | $1.20 | 45d | 1 | 0.71mi |
| 717 Mill Creek Cir Hinesville, GA | 4.0 | 2.5 | 1776 | $2,200 | $1.24 | 45d | 1 | 0.79mi |
| 712 Mill Creek Cir Hinesville, GA | 4.0 | 2.0 | 1456 | $1,900 | $1.30 | 45d | 1 | 0.83mi |
| 1478 Enterprise Dr Hinesville, GA | 4.0 | 2.0 | 1802 | $1,875 | $1.04 | 45d | 1 | 0.93mi |
| 905 King Air Ct Hinesville, GA | 3.0 | 2.0 | 1407 | $1,750 | $1.24 | 45d | 1 | 1.02mi |
| 1456 Coalition Cir Hinesville, GA | 3.0 | 2.0 | 1424 | $1,700 | $1.19 | 45d | 1 | 1.04mi |
| 960 Gulfstream Rd Hinesville, GA | 4.0 | 2.0 | 1515 | $2,150 | $1.42 | 45d | 1 | 1.05mi |
| 1458 Sheridan Pt Hinesville, GA | 3.0 | 2.0 | 1400 | $1,800 | $1.29 | 45d | 1 | 1.06mi |
| 916 Mandarin Dr Hinesville, GA | 3.0 | 2.0 | 1433 | $1,550 | $1.08 | 45d | 1 | 1.21mi |
| 908 Ringneck Way Hinesville, GA | 3.0 | 2.0 | 1526 | $1,750 | $1.15 | 46d | 1 | 1.33mi |
| 264 Marron Way Hinesville, GA | 4.0 | 2.5 | 1997 | $2,200 | $1.10 | 45d | 1 | 1.35mi |
| 924 Sanford Ln Hinesville, GA | 4.0 | 2.5 | 1801 | $1,995 | $1.11 | 45d | 1 | 1.40mi |
| 710 Little John Dr Hinesville, GA | 3.0 | 2.0 | 1459 | $1,700 | $1.17 | 45d | 1 | 1.46mi |
Listing history 17 events
-
2026-06-21days on market $194,685 Active 21 DOM
-
2026-06-19days on market $194,685 Active 19 DOM
-
2026-06-18days on market $194,685 Active 18 DOM
-
2026-06-17days on market $194,685 Active 17 DOM
-
2026-06-16days on market $194,685 Active 16 DOM
-
2026-06-15days on market $194,685 Active 15 DOM
-
2026-06-14days on market $194,685 Active 13 DOM
-
2026-06-13days on market $194,685 Active 12 DOM
-
2026-06-10days on market $194,685 Active 10 DOM
-
2026-06-09days on market $194,685 Active 9 DOM
-
2026-06-08days on market $194,685 Active 8 DOM
-
2026-06-07days on market $194,685 Active 7 DOM
-
2026-06-05days on market $194,685 Active 4 DOM
-
2026-06-03days on market $194,685 Active 3 DOM
-
2026-06-02days on market $194,685 Active 2 DOM
-
2026-06-01remarks 660-char remark
-
2026-06-01$194,685 Active 1 DOM
ⓘ Source: listings_history table (triggers on properties + properties_extension) + one-shot
backfill from property_details.listing_events for pre-trigger history.
Tax reassessment forecast GA · Resets to sale price
- Current annual tax
- $5,290 · $441/mo
- Projected year-2 tax
- $5,290 · $441/mo
- Expected delta
- $0/yr ($0/mo · 0.0%)
ⓘ Screening estimate from a state-policy table — verify with the county assessor before closing.
Climate risk First Street
- Flood 1/10 Low FEMA zone X (unshaded) · 0% chance over 30 yrs
- Wildfire 5/10 Major
- Heat 9/10 Extreme 7 d/yr ≥111°F today · 18 d/yr by 30 yrs out
- Wind 8/10 Severe 98% chance of damaging wind over 30 yrs
- Air quality 2/10 Low 2 unhealthy d/yr today · 2 by 30 yrs out
Nearby sold comps map
Loading sold comps map…
Walkable amenities ~0.75 mi
Loading nearby amenities…
Taxation est. · year 1
- Rental income
- $23,604
- − Mortgage interest
- −$10,905
- − Property taxes
- −$5,290
- − Insurance
- −$973
- − Repairs & maintenance
- −$1,888
- − Management
- −$1,888
- − Depreciation
- −$5,664
- Taxable loss
- −$3,005
- Est. tax savings @ 24.0%
- +$721
- After-tax cash flow
- $853/yr
For passive investors: Depreciation is non-cash, so a rental often shows a tax loss while cash-flowing — sheltering income. Rental losses are passive: they offset passive income freely, and up to $25,000/yr can offset ordinary (W-2) income if you actively participate and your MAGI is under $100k (phasing out to $0 by $150k); unused losses carry forward. On sale, claimed depreciation is recaptured at up to 25%, and gains may owe capital-gains tax (a 1031 exchange can defer both). Figures are a year-1 estimate at your 24.0% rate — not tax advice; consult a CPA.
Schools (NCES district)
- District
- Liberty County
- NCES district ID
- 1303300
- Math proficiency
- 19% ▼ -16.00%
- Reading proficiency
- 28% ▼ -13.00%
- Median HH income
- $43,911
- Composite
- 20.2/100
- National rank
- #8630
- State rank
- #133 of 174 in GA
Livability — Hinesville
- Score
- 73/100
- State rank
- #51
- US rank
- #5200
Category grades
Schools grade is shown separately in the Schools card above.
Census & demographics
- Census place
- Hinesville, GA
- County
- Liberty County · 58,565 people
- City population
- 42,838
- Metro
- Hinesville, GA
- Population (ZIP)
- 42,838
- Household income
- $60,233
- Rent vs Own
- Severe rent burden
- 1693.0
Population outlook (Liberty County) Hauer SSP2
- Today (2025)
- 58,689 people
- By 2030
- 57,670 · -1.7%
- By 2040
- 55,750 · -5.0%
- By 2050
- 54,155 · -7.7%
- By 2075
- 58,947 · +0.4%
- By 2100
- 66,919 · +14.0%
Race, ethnicity, and origin ACS 2023
- Neighborhood character
- Diverse neighborhood (Simpson 0.67)
- Race & ethnicity
- Black 47% White 31% Hispanic / Latino 13% Two or more races 11% Asian 2%
- Hispanic origin (detail)
- Mexican 4% Puerto Rican 7%
- Common ancestry
- Slovak 1% Italian 1% Lithuanian 1%
- Foreign-born
- 7% · Canada, South Korea
- Languages at home
- 86% English-only · Spanish 7% Other Indo-European 2% German/W. Germanic 1%
Political lean MEDSL · Liberty
- 2024 margin
- D (+17.4) · D 58.5% · R 41.0%
- 2008→2024 swing
- -10.9pp toward R · 2008: 28.4pp · 2024: 17.4pp
- All cycles
- 2024: D+17.4 2020: D+24.1 2016: D+21.2 2012: D+30.2 2008: D+28.4
Not yet ingested
- Civics
- —
Market trends
- HPI YoY
- ▼ -77.50%
- Current HPI
- 208.0927
- Rent YoY
- ▲ 5.41%
- Metro
- Hinesville, GA
- State GDP YoY
- ▲ 2.66%
- F500 in state
- 28
Industry mix (Fortune 500 HQ in GA)
| Industry | F500 HQs | Revenue |
|---|---|---|
| Paper / Packaging | 2 | $29B |
|
||
| Retail | 1 | $160B |
|
||
| Transportation / Logistics | 1 | $91B |
|
||
| Airlines | 1 | $62B |
|
||
| Consumer Goods | 1 | $47B |
|
||
| Utilities | 1 | $25B |
|
||
Price history
+49.8% since first listed7 events — show timeline
- 2026-06-01 Listed $194,685 HABR
- 2026-01-19 Listing Removed — Hive MLS
- 2025-10-30 Price Changed $229,900 HABR
- 2025-10-16 Listed $229,900 Hive MLS
- 2014-08-11 Sold (Public Records) $131,500 Public Records
- 2014-06-20 Sold (MLS) $131,500 Hive MLS
- 2014-02-24 Listed $130,000 Hive MLS
Property tax history
+6.2%/yrLatest (2025): $5,290 · +11.6% YoY. Source: county tax records.
Cash-flow waterfall
monthlySold comps — $/sqft
last 12 mo · ≤1 miLoading sold comps…