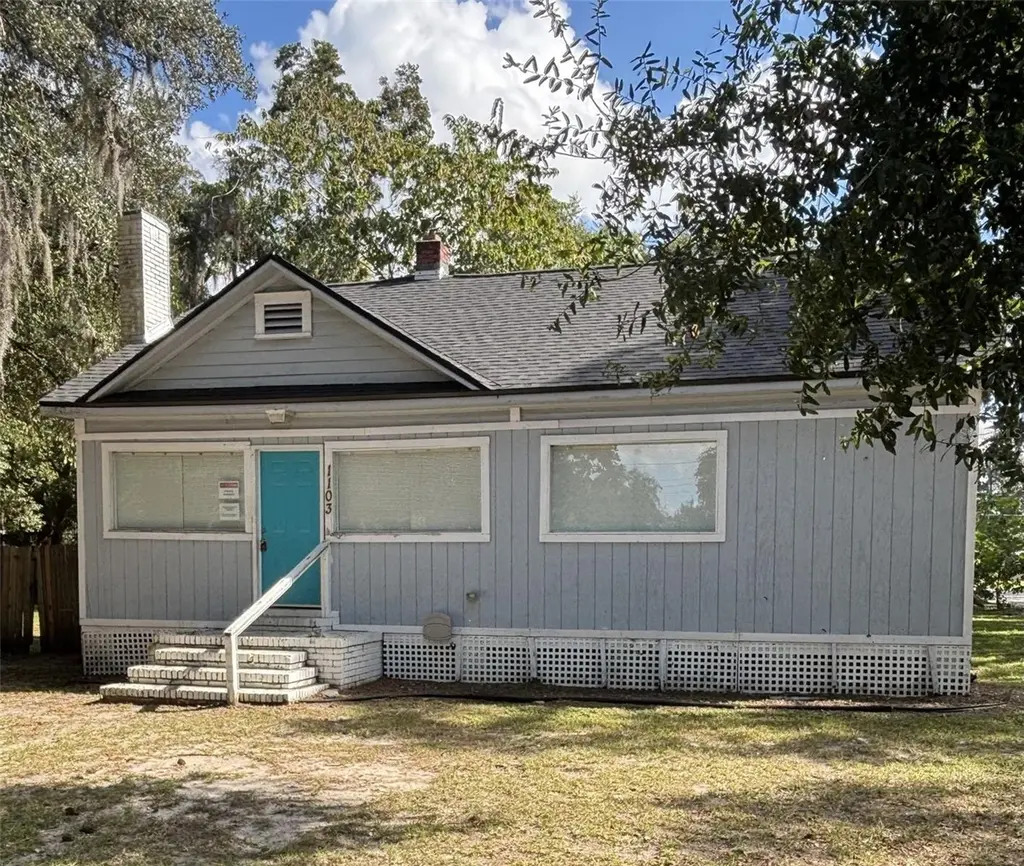
1103 NE 9th Ave · Ocala, FL
Flood risk 1/10 · Minimal
- FEMA flood zone
- X (unshaded)
- Chance of flooding over 30 yrs
- 0.0%
- Est. flood insurance / yr
- $507 – $1,088
Fire risk 2/10 · Minimal
- Est. fire insurance / yr
- $947 – $1,759
Heat risk 8/10 · Major
- Hot days now (above 108°F)
- 7 days/yr
- Hot days in 30 yrs
- 22 days/yr
Wind risk 9/10 · Severe
- Chance of severe wind over 30 yrs
- 99.0%
Air-quality risk 4/10 · Minor
- Unhealthy air days now
- 5 days/yr
- Unhealthy air days in 30 yrs
- 5 days/yr
Risk factors via First Street. Map © Google.
Why this score? — see what drove the C- grade
The composite is a weighted blend of 9 inputs, each scored 0–100. Each bar is that input's sub-score; the figure is the points it added to the 100-point composite (weight × sub-score).
- Cash flow +18.3/30.0
- ARV discount +14.3/15.0
- DSCR +5.8/10.0
- 1% rule +4.5/10.0
- Schools +3.6/10.0
- Livability +3.5/5.0
- Rent growth +2.5/5.0
- Condition / age +2.5/5.0
- Appreciation +0.0/10.0
$175,900
🖨 Deal sheet (PDF) 📄 Offer letter ✓ Due diligence
Listing remarks MLS
Make this 3/1 your own or it would be an ideal investment property. Centrally located and close to Downtown Ocala.
Key facts
- Centrally located
- 0.3 acre lot
- Built 1933
Tags
Neighborhood map
What this means for you Summary
Snapshot
- This is a 3-bed/1.0-bath single-family listed at $176k.
Deal economics
- At list price, monthly cash flow is $162 ($2k/yr) — positive.
- The deal already cash-flows at list — no discount required.
- To meet the 1% rule (rent ≥ 1% of price), the offer needs to be $166k (5.5% below list).
- Recommended offer: $155k (12.0% below list) — sets the bar for market timing.
- Cap rate 7.4% vs local median 4.1% in Ocala — top-decile yield for the area; either an underpriced asset or a hidden risk that comps aren't pricing in. Stress-test before assuming the spread holds.
Location & tenants
- Location reads 69/100 on livability (#476 in FL) — a middle-class / working-renter tenant base. Strengths: cost of living A+, housing A+, health & safety A+; Watch: crime F, amenities F, commute F.
- Marion (rural): math 42% / reading 43% proficiency, ranked #61 of 73 in FL (top 84%) — families likely to look elsewhere, expect single-tenant / working-renter base with shorter leases; 61% free/reduced lunch — lower-income household profile, screen leases tightly.
- Zoned schools: Wyomina Park Elementary School (math 29% / reading 28%, grade F, #1,943 of 2,144 statewide, top 91%, 645 students, 82% FRL); Fort King Middle School (math 37% / reading 35%, grade F, #410 of 571 statewide, top 72%, 1,092 students, 71% FRL); Vanguard High School (math 22% / reading 48%, grade F, #379 of 667 statewide, top 58%, 1,661 students, 59% FRL).
- Market conditions: Rents soft (-0.1%/yr); 297 active listings in the ZIP; 28 comparable units currently listed for rent nearby; rentals at typical pace (median 23d on market — plan ~3-4 weeks tenant-placement turnaround); 7,071 units permitted in Marion County in 2024 (534 in 5+ unit buildings).
- This rent runs 38% of the median local income ($52k/yr) — at the standard rent-burdened threshold; future hikes will face affordability resistance.
Forward outlook
- Local home prices are declining (-3.0%/yr); year-one equity from $1k of loan paydown is wiped out by about $5k of value loss. Plan a longer hold.
- Marion County population projected at +13% by 2050 — modest demand growth; plan on rents tracking national, not racing it.
Negotiation context
- It's been on market 222 days — a 12% lower offer ($155k) is reasonable based on typical stale-listing flexibility.
- 5 sale attempts since 15y ago with the ask held roughly flat each time — persistent listings suggest the price (not the market) is what's stuck; bring a comps-based counter.
- Current owner paid $24k; list at $176k implies a 633% gain — meaningful room to come down on a strong offer.
Risks & watch-outs
- Watch-outs: built in 1933 — expect roof / HVAC / electrical / plumbing capex.
- Climate carrying-cost: severe wind risk, 99% chance of damaging wind over 30y; extreme-heat days projected 7→22/yr by 2055 (HVAC capex compounding) — expect insurance premiums to compound above CPI over the hold.
Questions for the listing agent
- It's been on market 222 days. Have you received any prior offers? Is the seller open to a 12% concession, seller financing, or rate buy-down credit?
- Built in 1933 — when were the roof, HVAC, electrical panel, plumbing, and water heater last replaced?
- Why hasn't it sold? Are there any deal-killer items the seller is aware of (foundation, flood, title, zoning, code violations)?
- Is there a deadline driving the sale (1031 exchange, divorce, estate, relocation)? That informs how much negotiation room exists.
- Crime grade is F in this area — have there been break-ins, vandalism, or insurance claims at this property in the last 3 years? What carrier currently insures it and at what premium?
- What's the average days-on-market for RENTAL listings here right now (not sales)? A rising rental-DOM trend means longer vacancies and softer asking-rent achievability than the comps imply.
- What's the recent tenant-quality profile in this submarket — average credit score on applications, eviction rate, late-payment / NSF rate, and stable-employment percentage? A property-management company in the area should have these aggregated.
- How much new for-sale + rental construction is in the pipeline within 1–3 miles? Heavy new supply typically softens prices + rents 12–24 months out; constrained supply supports both.
Investment metrics
- 1% rule
- 0.95% ✗
- Cap rate
- 7.40%
- Cash-on-cash
- 3.95%
- DSCR
- 1.18
- GRM
- 8.8
CMA / ARV
- ARV (median comp)
- $207,401
- List price
- $175,900
- Delta
- -15.19%
- Verdict
- UNDERPRICED
- Comps
- 20 within 1.0 mi
Show comp detail 6 sales within ~0.75 mi
| Address | Dist | Beds/Ba | Sqft | Sold | Price | $/sf | Match |
|---|---|---|---|---|---|---|---|
| 910 NE 11th Ave | 0.17mi | 3/2.0 | 1,406 (-3%) | 4mo | $200,000 | $142 | 80 |
| 924 NE 12th Ave | 0.28mi | 3/2.5 | 1,439 (-1%) | 5mo | $203,500 | $141 | 75 |
| 1122 NE 9th St | 0.23mi | 3/1.0 | 1,302 (-11%) | 15mo | $199,000 | $153 | 59 |
| 1105 NE 3rd St | 0.55mi | 2/1.0 (-1) | 1,237 (-15%) | 4mo | $240,000 | $194 | 41 |
| 1030 NE 5th St | 0.44mi | 3/2.0 | 1,625 (+12%) | 18mo | $221,000 | $136 | 41 |
| 1516 NE 12th St | 0.65mi | 3/2.0 | 1,521 (+4%) | 20mo | $235,000 | $155 | 41 |
Match score weights: distance 35% · size 25% · config 20% · recency 20%. Top-matched comps best support the ARV.
Projected returns pro-forma
-3.0% appreciation · 0.0% rent growth · sell at horizon
- IRR
- -13.4%
- Equity multiple
- 0.53×
- Total profit
- $-23,065
- Equity at exit
- $26,227
- IRR
- -9.8%
- Equity multiple
- 0.48×
- Total profit
- $-25,677
- Equity at exit
- $15,209
Cash invested: $49,252 (down + closing). Projections, not guarantees.
Landlord ↔ Tenant lean methodology
- Overall (STATE)
- 87 Strongly Landlord-Friendly
- State Florida
- 87 Strongly Landlord-Friendly · R+3
- County
- — inherits STATE
- City
- — inherits STATE
ZIP-level market 34470
- Home prices YoY
- -27.6%
- Rents YoY
- -0.1%
- Active inventory
- 297
- Price-to-rent
- 8.8×
Monthly cashflow live
- Estimated rent
- $1,662 high interval (Pro) →
- Mortgage (P&I)
- −$922
- Tax from tax record
- −$155 /mo · $1,865/yr
- Insurance
- −$73
- HOA
- −$0
- Vacancy / Maint / Mgmt
- −$349
- Net cashflow
- $162
Break-even live
Sensitivity live
| Price | -10% $262 | -5% $212 | +0% $162 | +5% $112 | +10% $63 |
|---|---|---|---|---|---|
| Rent | -10% $31 | -5% $96 | +0% $162 | +5% $228 | +10% $293 |
| Rate | -1.0pp $251 | -0.5pp $207 | base $162 | +0.5pp $117 | +1.0pp $70 |
UW: 25.0% down · 7.5% · 30yr · 1.5% tax · 5.0% vac · 8.0% maint · 8.0% mgmt
Financing live
Cash to close
- Down payment
- $43,975
- Closing costs
- $5,277
- Reserves months
- —
- Total cash needed
- —
Loan-product check · same deal, 3 products live
Conventional
25% down · 7.5% · 30yr
- Down + closing
- —
- Monthly P&I
- —
- Monthly cashflow
- —
- DSCR
- —
- Eligible?
- —
Personal DTI + credit; lowest rate.
DSCR
20% down · 8.5% · 30yr
- Down + closing
- —
- Monthly P&I
- —
- Monthly cashflow
- —
- DSCR
- —
- Eligible?
- —
No personal income docs; deal must DSCR.
Hard money
10% down · 12.0% · 12mo
- Down + closing
- —
- Monthly P&I
- —
- Monthly cashflow
- —
- DSCR
- —
- Eligible?
- —
Short-term bridge; refi at stabilization.
Rent comps 28 comps
| Address | Beds | Baths | Sqft | Rent | $/sqft | DOM | Units | Dist |
|---|---|---|---|---|---|---|---|---|
| 710 NE 4th St Unit 101 Ocala, FL | 3.0 | 3.0 | 1422 | $1,575 | $1.11 | 23d | 1 | 0.46mi |
| 339 NE Sanchez Ave Unit 111 Ocala, FL | 3.0 | 3.0 | 1422 | $1,649 | $1.16 | 23d | 1 | 0.47mi |
| 408 NE 12th Ave Ocala, FL | 4.0 | 2.0 | 1808 | $2,100 | $1.16 | 23d | 1 | 0.47mi |
| 241 NE Tuscawilla Ave Ocala, FL | 2.0 | 1.0 | 1644 | $1,400 | $0.85 | 23d | 1 | 0.57mi |
| 1643 NE 16th Ave Unit B Ocala, FL | 2.0 | 1.0 | 1635 | $1,450 | $0.89 | 23d | 1 | 0.81mi |
| 302 SE Broadway St #460 Ocala, FL | 2.0 | 2.0 | 1500 | $3,000 | $2.00 | 23d | 1 | 0.84mi |
| 1549 NE 2nd St Unit B Ocala, FL | 2.0 | 2.0 | 1036 | $1,249 | $1.21 | 23d | 1 | 0.86mi |
| 1706 NE 4th St Ocala, FL | 3.0 | 2.0 | 1573 | $2,100 | $1.34 | 15d | 1 | 0.92mi |
| 1316 E Fort King St Unit 1316-1 Ocala, FL | 2.0 | 1.0 | 892 | $1,499 | $1.68 | 23d | 1 | 0.92mi |
| 305 SE 10th Ave Ocala, FL | 2.0 | 1.0 | 1449 | $1,800 | $1.24 | 23d | 1 | 0.92mi |
| 131 SE 13th Ave Ocala, FL | 2.0 | 1.0 | 956 | $1,225 | $1.28 | 15d | 1 | 0.93mi |
| 127 SE 13th Ave Unit R 3107 Ocala, FL | 2.0 | 1.0 | 956 | $1,225 | $1.28 | 15d | 1 | 0.94mi |
| 2205 NE 14th Ave Ocala, FL | 3.0 | 1.0 | 1020 | $1,345 | $1.32 | 23d | 1 | 0.94mi |
| 1718 NE 3rd St Ocala, FL | 2.0 | 1.5 | 1200 | $1,289 | $1.07 | 15d | 1 | 0.96mi |
| 1718 NE 3rd St Ocala, FL | 2.0 | 1.5 | 1200 | $1,289 | $1.07 | 23d | 1 | 0.96mi |
| 1713 NE 2nd St Ocala, FL | 2.0 | 1.5 | 1200 | $1,289 | $1.07 | 23d | 1 | 0.98mi |
| 1812 NE 3rd St Unit 1808 Ocala, FL | 2.0 | 2.0 | 936 | $1,599 | $1.71 | 15d | 1 | 1.04mi |
| 1812 NE 3rd St Unit 1752 Ocala, FL | 2.0 | 2.0 | 936 | $1,499 | $1.60 | 23d | 1 | 1.05mi |
| 1838 NE 17th St Ocala, FL | 2.0 | 1.0 | 1680 | $1,200 | $0.71 | 15d | 1 | 1.08mi |
| 712 NE 26th St Ocala, FL | 3.0 | 2.0 | 1105 | $1,590 | $1.44 | 23d | 1 | 1.15mi |
| 708 NE 26th St Ocala, FL | 3.0 | 2.0 | 1100 | $1,600 | $1.45 | 23d | 1 | 1.15mi |
| 714 NW 1st St Ocala, FL | 3.0 | 2.0 | 1444 | $2,200 | $1.52 | 15d | 1 | 1.23mi |
| 717 W Silver Springs Pl Ocala, FL | 3.0 | 2.0 | 1000 | $1,445 | $1.45 | 15d | 1 | 1.25mi |
| 900 SE 3rd Ave Ocala, FL | 2.0–3.0 | 2.0 | 1160 | $2,325 | $2.00 | 15d | 4 | 1.27mi |
| 510 SE 11th St Unit 510-D Ocala, FL | 2.0 | 1.0 | 925 | $995 | $1.08 | 15d | 1 | 1.36mi |
| 2321 NE 3rd St Ocala, FL | 1.0–3.0 | 1.0–2.0 | 1010 | $990 | $0.98 | 15d | 1 | 1.39mi |
| 2281 NE 2nd St Ocala, FL | 2.0 | 2.0 | 1000 | $1,499 | $1.50 | 23d | 1 | 1.43mi |
| 730 SE 13th St Ocala, FL | 2.0 | 1.0 | 1000 | $1,499 | $1.50 | 23d | 1 | 1.47mi |
Listing history 27 events
-
2026-06-22days on market $175,900 Active 222 DOM
-
2026-06-18days on market $175,900 Active 219 DOM
-
2026-06-17days on market $175,900 Active 218 DOM
-
2026-06-16days on market $175,900 Active 217 DOM
-
2026-06-15days on market $175,900 Active 216 DOM
-
2026-06-14days on market $175,900 Active 214 DOM
-
2026-06-13days on market $175,900 Active 213 DOM
-
2026-06-10days on market $175,900 Active 211 DOM
-
2026-06-09days on market $175,900 Active 210 DOM
-
2026-06-08days on market $175,900 Active 209 DOM
-
2026-06-07days on market $175,900 Active 208 DOM
-
2026-06-03days on market $175,900 Active 204 DOM
-
2026-06-02days on market $175,900 Active 203 DOM
-
2026-05-31days on market $175,900 Active 201 DOM
-
2026-05-30days on market $175,900 Active 200 DOM
-
2026-04-10price $175,900 114-char remark
Show marketing remark (114 chars)
Make this 3/1 your own or it would be an ideal investment property. Centrally located and close to Downtown Ocala.
-
2026-01-22price $177,900 114-char remark
Show marketing remark (114 chars)
Make this 3/1 your own or it would be an ideal investment property. Centrally located and close to Downtown Ocala.
-
2025-11-11$179,900 Active 114-char remark
Show marketing remark (114 chars)
Make this 3/1 your own or it would be an ideal investment property. Centrally located and close to Downtown Ocala.
-
2025-07-24historical $1,675
-
2025-07-17$1,675
-
2023-09-08historical $1,600
-
2023-08-19$1,600
-
2013-05-15soldstatus $24,000 303-char remark
Show marketing remark (303 chars)
Investor alert! Three bedrooms, one bath, large kitchen with inside laundry. The home is 90% renovated. New windows, plumbing, electric, water heater, bathroom, kitchen, carpet, linoleum, and paint. No electric drop to house. Aggressively priced to sell AS IS. $495.50 quote to complete electrical work.
-
2012-11-09$39,900 303-char remark
Show marketing remark (303 chars)
Investor alert! Three bedrooms, one bath, large kitchen with inside laundry. The home is 90% renovated. New windows, plumbing, electric, water heater, bathroom, kitchen, carpet, linoleum, and paint. No electric drop to house. Aggressively priced to sell AS IS. $495.50 quote to complete electrical work.
-
2012-03-31historical
-
2011-08-30$47,500
-
2008-06-18soldstatus $67,000
ⓘ Source: listings_history table (triggers on properties + properties_extension) + one-shot
backfill from property_details.listing_events for pre-trigger history.
Tax reassessment forecast FL · Resets to sale price
- Current annual tax
- $1,865 · $155/mo
- Projected year-2 tax
- $1,865 · $155/mo
- Expected delta
- $0/yr ($0/mo · 0.0%)
ⓘ Screening estimate from a state-policy table — verify with the county assessor before closing.
Climate risk First Street
- Flood 1/10 Low FEMA zone X (unshaded) · 0% chance over 30 yrs
- Wildfire 2/10 Low
- Heat 8/10 Severe 7 d/yr ≥108°F today · 22 d/yr by 30 yrs out
- Wind 9/10 Extreme 99% chance of damaging wind over 30 yrs
- Air quality 4/10 Moderate 5 unhealthy d/yr today · 5 by 30 yrs out
Nearby sold comps map
Loading sold comps map…
Walkable amenities ~0.75 mi
Loading nearby amenities…
Taxation est. · year 1
- Rental income
- $19,948
- − Mortgage interest
- −$9,853
- − Property taxes
- −$1,865
- − Insurance
- −$880
- − Repairs & maintenance
- −$1,596
- − Management
- −$1,596
- − Depreciation
- −$5,117
- Taxable loss
- −$958
- Est. tax savings @ 24.0%
- +$230
- After-tax cash flow
- $2,175/yr
For passive investors: Depreciation is non-cash, so a rental often shows a tax loss while cash-flowing — sheltering income. Rental losses are passive: they offset passive income freely, and up to $25,000/yr can offset ordinary (W-2) income if you actively participate and your MAGI is under $100k (phasing out to $0 by $150k); unused losses carry forward. On sale, claimed depreciation is recaptured at up to 25%, and gains may owe capital-gains tax (a 1031 exchange can defer both). Figures are a year-1 estimate at your 24.0% rate — not tax advice; consult a CPA.
Schools (NCES district)
- District
- Marion
- NCES district ID
- 1201260
- Math proficiency
- 42% ▼ -7.00%
- Reading proficiency
- 43% ▼ -4.00%
- Median HH income
- $40,015
- Composite
- 35.61/100
- National rank
- #4890
- State rank
- #61 of 73 in FL
Livability — Ocala
- Score
- 69/100
- State rank
- #476
- US rank
- #8461
Category grades
Schools grade is shown separately in the Schools card above.
Census & demographics
- Census place
- Ocala, FL
- County
- Marion County · 315,796 people
- City population
- 263,375
- Metro
- Ocala, FL
- Population (ZIP)
- 22,443
- Household income
- $52,083
- Rent vs Own
- Severe rent burden
- 771.0
Population outlook (Marion County) Hauer SSP2
- Today (2025)
- 365,905 people
- By 2030
- 376,768 · +3.0%
- By 2040
- 396,555 · +8.4%
- By 2050
- 412,723 · +12.8%
- By 2075
- 446,090 · +21.9%
- By 2100
- 436,193 · +19.2%
Race, ethnicity, and origin ACS 2023
- Neighborhood character
- Predominantly White (71%)
- Race & ethnicity
- White 71% Two or more races 12% Hispanic / Latino 12% Black 10% Asian 1%
- Hispanic origin (detail)
- Mexican 2% Puerto Rican 6% Cuban 1%
- Common ancestry
- Lithuanian 3% Romanian 2% Italian 2%
- Foreign-born
- 6% · Canada, Jamaica, Vietnam
- Languages at home
- 89% English-only · Spanish 9%
Political lean MEDSL · Marion
- 2024 margin
- Solid R (+31.6) · D 33.8% · R 65.5%
- 2008→2024 swing
- -20.0pp toward R · 2008: -11.6pp · 2024: -31.6pp
- All cycles
- 2024: R+31.6 2020: R+25.9 2016: R+26.2 2012: R+16.2 2008: R+11.6
Not yet ingested
- Civics
- —
Market trends
- HPI YoY
- ▼ -92.74%
- Current HPI
- 242.686
- Rent YoY
- ▼ -0.07%
- Metro
- Ocala, FL
- State GDP YoY
- ▲ 3.28%
- F500 in state
- 36
Industry mix (Fortune 500 HQ in FL)
| Industry | F500 HQs | Revenue |
|---|---|---|
| Industrial Technology | 2 | $29B |
|
||
| Insurance | 2 | $17B |
|
||
| Retail | 1 | $60B |
|
||
| Technology Distribution | 1 | $58B |
|
||
| Homebuilding | 1 | $35B |
|
||
| Technology Manufacturing | 1 | $35B |
|
||
Price history
+162.5% since first listed12 events — show timeline
- 2026-04-10 Price Changed $175,900 Stellar MLS as Distributed by MLS Grid
- 2026-01-22 Price Changed $177,900 Stellar MLS as Distributed by MLS Grid
- 2025-11-11 Listed $179,900 Stellar MLS as Distributed by MLS Grid
- 2025-07-24 Rental Removed $1,675 STELLARMLS
- 2025-07-17 Listed for Rent $1,675 STELLARMLS
- 2023-09-08 Rental Removed $1,600 STELLARMLS
- 2023-08-19 Listed for Rent $1,600 STELLARMLS
- 2013-05-15 Sold (MLS) $24,000 Stellar MLS as Distributed by MLS Grid
- 2012-11-09 Listed $39,900 Stellar MLS as Distributed by MLS Grid
- 2012-03-31 Listing Removed — Stellar MLS as Distributed by MLS Grid
- 2011-08-30 Listed $47,500 Stellar MLS as Distributed by MLS Grid
- 2008-06-18 Sold (Public Records) $67,000 Public Records
Property tax history
+15.2%/yrLatest (2025): $1,865 · +22.6% YoY. Source: county tax records.
Cash-flow waterfall
monthlySold comps — $/sqft
last 12 mo · ≤1 miLoading sold comps…