 🏗️ New Construction
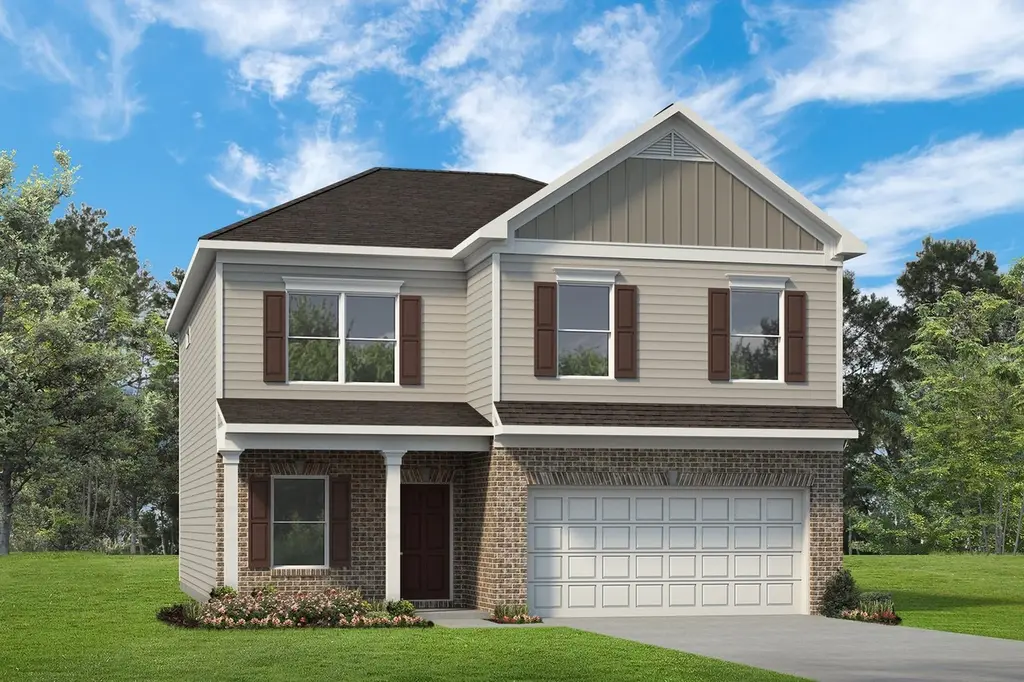
The Harrington Plan · Eatonton, GA
Flood risk No data
- FEMA flood zone
- —
- Chance of flooding over 30 yrs
- —
- Est. flood insurance / yr
- —
Fire risk No data
- Est. fire insurance / yr
- —
Heat risk No data
- Hot days now (above threshold)
- —
- Hot days in 30 yrs
- —
Wind risk No data
- Chance of severe wind over 30 yrs
- —
Air-quality risk No data
- Unhealthy air days now
- —
- Unhealthy air days in 30 yrs
- —
Risk factors via First Street. Map © Google.
Why this score? — see what drove the F grade
The composite is a weighted blend of 9 inputs, each scored 0–100. Each bar is that input's sub-score; the figure is the points it added to the 100-point composite (weight × sub-score).
- Cash flow +8.1/30.0
- ARV discount +7.5/15.0
- Condition / age +4.0/5.0
- Livability +3.6/5.0
- Schools +2.7/10.0
- 1% rule +2.5/10.0
- Rent growth +2.5/5.0
- DSCR +2.1/10.0
- Appreciation +0.0/10.0
$297,900
🖨 Deal sheet (PDF) 📄 Offer letter ✓ Due diligence
Listing remarks MLS
Based on our top-selling plan, the Harrington delights with its massive second-floor owner's suite privately tucked away on the same level as its three additional bedrooms. The first floor impresses with an open concept family room, breakfast nook and large center island, plus a dining room that can be a living room, study or a 5th bedroom/bathroom. Explore your choices for the Harrington kitchen, using our Interactive Kitchen Designer Tool as well.
Key facts
- Large center island
- 2 parking spots
- Listed 737 days
Tags
Neighborhood map
What this means for you Summary
Snapshot
- This is a 4-bed/2.5-bath single-family listed at $298k. Condition is rated good.
Deal economics
- At list price, monthly cash flow is $-333 ($-4k/yr) — negative.
- To cash-flow at today's rent, offer at most $288k (3.2% below list).
- To meet the 1% rule (rent ≥ 1% of price), the offer needs to be $252k (15.3% below list).
- Recommended offer: $252k (15.3% below list) — sets the bar for 1% rule.
- Cap rate 5.1% vs local median 3.7% in Eatonton — top-decile yield for the area; either an underpriced asset or a hidden risk that comps aren't pricing in. Stress-test before assuming the spread holds.
Location & tenants
- Location reads 71/100 on livability (#76 in GA) — a middle-class / working-renter tenant base. Strengths: cost of living A+, housing A+, crime A; Watch: amenities F, commute F, employment F.
- Putnam County (rural): math 33% / reading 30% proficiency, ranked #86 of 174 in GA (top 49%) — families likely to look elsewhere, expect single-tenant / working-renter base with shorter leases; 69% free/reduced lunch — lower-income household profile, screen leases tightly.
- Zoned schools: Putnam County Primary School (756 students, 81% FRL); Putnam County Middle School (math 31% / reading 33%, grade F, #229 of 470 statewide, top 49%, 681 students, 81% FRL); Putnam County High School (math 8% / reading 32%, grade F, #238 of 424 statewide, top 57%, 919 students, 81% FRL).
- Market conditions: 533 active listings in the ZIP; 129 units permitted in Putnam County in 2024 (50 in 5+ unit buildings).
- At $2,523/mo this rent would consume 46% of the median local household income ($66k/yr) (locally 696% of renters already pay >50% of income on rent) — very limited rent-growth headroom before tenants either downsize or default.
Forward outlook
- Local home prices are declining (-3.0%/yr); year-one equity from $2k of loan paydown is wiped out by about $10k of value loss. Plan a longer hold.
- Putnam County population projected at -18% by 2050 — secular population decline; favor cash flow + early exit over multi-decade hold.
Negotiation context
- It's been on market 738 days — a 12% lower offer ($262k) is reasonable based on typical stale-listing flexibility.
Questions for the listing agent
- What do current leases actually rent for vs. the listed asking? Can we see a recent rent roll and the last 12 months of T-12 income?
- It's been on market 738 days. Have you received any prior offers? Is the seller open to a 15% concession, seller financing, or rate buy-down credit?
- Why hasn't it sold? Are there any deal-killer items the seller is aware of (foundation, flood, title, zoning, code violations)?
- Is there a deadline driving the sale (1031 exchange, divorce, estate, relocation)? That informs how much negotiation room exists.
- Schools are F-rated, which usually means shorter tenancies and higher turnover. Who's the typical renter profile here, and what's been the actual vacancy rate?
- The area grade is low — what's the realistic commute time and amenity access for the typical tenant pool here? Any planned neighborhood developments (good or bad) we should know about?
- What's the average days-on-market for RENTAL listings here right now (not sales)? A rising rental-DOM trend means longer vacancies and softer asking-rent achievability than the comps imply.
- What's the recent tenant-quality profile in this submarket — average credit score on applications, eviction rate, late-payment / NSF rate, and stable-employment percentage? A property-management company in the area should have these aggregated.
- How much new for-sale + rental construction is in the pipeline within 1–3 miles? Heavy new supply typically softens prices + rents 12–24 months out; constrained supply supports both.
Investment metrics
- 1% rule
- 0.75% ✗
- Cap rate
- 5.11%
- Cash-on-cash
- -4.23%
- DSCR
- 0.81
- GRM
- 11.1
CMA / ARV
- ARV (median comp)
- $336,592
- List price
- $297,900
- Delta
- -11.50%
- Verdict
- UNDERPRICED
- Comps
- 20 within 1.0 mi
Show comp detail 8 sales within ~0.75 mi
| Address | Dist | Beds/Ba | Sqft | Sold | Price | $/sf | Match |
|---|---|---|---|---|---|---|---|
| 128 Creekside Rd Unit (LOT 45) | 0.20mi | 4/2.5 | 2,565 (0%) | 9mo | $340,365 | $133 | 83 |
| 152 Creekside Rd Unit (LOT 33) | 0.22mi | 4/2.5 | 2,372 (-8%) | 2mo | $349,790 | $147 | 76 |
| 115 Creekside Rd Unit (LOT 6) | 0.24mi | 4/2.5 | 2,565 (0%) | 18mo | $348,485 | $136 | 74 |
| 131 Creekside Rd Unit (LOT 20) | 0.25mi | 4/2.5 | 2,372 (-8%) | 6mo | $356,914 | $150 | 71 |
| 107 Timber Way Ct Unit (LOT 11) | 0.26mi | 4/2.5 | 2,372 (-8%) | 7mo | $300,040 | $126 | 70 |
| 108 Timber Way Ct Unit (LOT 14) | 0.28mi | 4/2.5 | 2,372 (-8%) | 10mo | $349,940 | $148 | 66 |
| 106 Timber Way Ct Unit (LOT 15) | 0.26mi | 4/2.5 | 2,372 (-8%) | 12mo | $366,000 | $154 | 65 |
| 109 Creekside Rd | 0.27mi | 4/2.5 | 2,372 (-8%) | 18mo | $349,900 | $148 | 60 |
Match score weights: distance 35% · size 25% · config 20% · recency 20%. Top-matched comps best support the ARV.
Projected returns pro-forma
-3.0% appreciation · 3.0% rent growth · sell at horizon
- IRR
- -23.4%
- Equity multiple
- 0.20×
- Total profit
- $-75,687
- Equity at exit
- $50,187
- IRR
- -18.2%
- Equity multiple
- 0.01×
- Total profit
- $-93,029
- Equity at exit
- $29,102
Cash invested: $94,246 (down + closing). Projections, not guarantees.
Landlord ↔ Tenant lean methodology
- Overall (STATE)
- 90 Strongly Landlord-Friendly
- State Georgia
- 90 Strongly Landlord-Friendly · R+3
- County
- — inherits STATE
- City
- — inherits STATE
ZIP-level market 31024
- Active inventory
- 533
- Price-to-rent
- 9.8×
Monthly cashflow live
- Estimated rent
- $2,523 medium interval (Pro) →
- Mortgage (P&I)
- −$1,765
- Tax est. 1.5%
- −$421 /mo · $5,049/yr
- Insurance
- −$140
- HOA
- −$0
- Vacancy / Maint / Mgmt
- −$530
- Net cashflow
- $-333
Break-even live
Sensitivity live
| Price | -10% $-100 | -5% $-216 | +0% $-333 | +5% $-449 | +10% $-565 |
|---|---|---|---|---|---|
| Rent | -10% $-532 | -5% $-432 | +0% $-333 | +5% $-233 | +10% $-133 |
| Rate | -1.0pp $-163 | -0.5pp $-247 | base $-333 | +0.5pp $-420 | +1.0pp $-509 |
UW: 25.0% down · 7.5% · 30yr · 1.5% tax · 5.0% vac · 8.0% maint · 8.0% mgmt
Financing live
Cash to close
- Down payment
- $84,148
- Closing costs
- $10,098
- Reserves months
- —
- Total cash needed
- —
Loan-product check · same deal, 3 products live
Conventional
25% down · 7.5% · 30yr
- Down + closing
- —
- Monthly P&I
- —
- Monthly cashflow
- —
- DSCR
- —
- Eligible?
- —
Personal DTI + credit; lowest rate.
DSCR
20% down · 8.5% · 30yr
- Down + closing
- —
- Monthly P&I
- —
- Monthly cashflow
- —
- DSCR
- —
- Eligible?
- —
No personal income docs; deal must DSCR.
Hard money
10% down · 12.0% · 12mo
- Down + closing
- —
- Monthly P&I
- —
- Monthly cashflow
- —
- DSCR
- —
- Eligible?
- —
Short-term bridge; refi at stabilization.
Listing history 21 events
-
2026-06-22days on market $297,900 Active 738 DOM
-
2026-06-21days on market $297,900 Active 737 DOM
-
2026-06-19days on market $297,900 Active 735 DOM
-
2026-06-18days on market $297,900 Active 734 DOM
-
2026-06-17days on market $297,900 Active 733 DOM
-
2026-06-16days on market $297,900 Active 732 DOM
-
2026-06-15days on market $297,900 Active 731 DOM
-
2026-06-14days on market $297,900 Active 729 DOM
-
2026-06-12days on market $297,900 Active 728 DOM
-
2026-06-09days on market $297,900 Active 725 DOM
-
2026-06-08days on market $297,900 Active 724 DOM
-
2026-06-07days on market $297,900 Active 723 DOM
-
2026-06-05days on market $297,900 Active 720 DOM
-
2026-06-03days on market $297,900 Active 719 DOM
-
2026-06-02days on market $297,900 Active 718 DOM
-
2026-06-01days on market $297,900 Active 717 DOM
-
2026-05-31days on market $297,900 Active 716 DOM
-
2026-05-30days on market $297,900 Active 715 DOM
-
2026-02-09price $297,900 453-char remark
Show marketing remark (453 chars)
Based on our top-selling plan, the Harrington delights with its massive second-floor owner's suite privately tucked away on the same level as its three additional bedrooms. The first floor impresses with an open concept family room, breakfast nook and large center island, plus a dining room that can be a living room, study or a 5th bedroom/bathroom. Explore your choices for the Harrington kitchen, using our Interactive Kitchen Designer Tool as well.
-
2025-06-04price $307,900 453-char remark
Show marketing remark (453 chars)
Based on our top-selling plan, the Harrington delights with its massive second-floor owner's suite privately tucked away on the same level as its three additional bedrooms. The first floor impresses with an open concept family room, breakfast nook and large center island, plus a dining room that can be a living room, study or a 5th bedroom/bathroom. Explore your choices for the Harrington kitchen, using our Interactive Kitchen Designer Tool as well.
-
2024-06-14$315,900 Active 453-char remark
Show marketing remark (453 chars)
Based on our top-selling plan, the Harrington delights with its massive second-floor owner's suite privately tucked away on the same level as its three additional bedrooms. The first floor impresses with an open concept family room, breakfast nook and large center island, plus a dining room that can be a living room, study or a 5th bedroom/bathroom. Explore your choices for the Harrington kitchen, using our Interactive Kitchen Designer Tool as well.
ⓘ Source: listings_history table (triggers on properties + properties_extension) + one-shot
backfill from property_details.listing_events for pre-trigger history.
Nearby sold comps map
Loading sold comps map…
Walkable amenities ~0.75 mi
Loading nearby amenities…
Taxation est. · year 1
- Rental income
- $30,281
- − Mortgage interest
- −$18,854
- − Property taxes
- −$5,049
- − Insurance
- −$1,683
- − Repairs & maintenance
- −$2,423
- − Management
- −$2,423
- − Depreciation
- −$9,792
- Taxable loss
- −$9,942
- Est. tax savings @ 24.0%
- +$2,386
- After-tax cash flow
- $-1,605/yr
For passive investors: Depreciation is non-cash, so a rental often shows a tax loss while cash-flowing — sheltering income. Rental losses are passive: they offset passive income freely, and up to $25,000/yr can offset ordinary (W-2) income if you actively participate and your MAGI is under $100k (phasing out to $0 by $150k); unused losses carry forward. On sale, claimed depreciation is recaptured at up to 25%, and gains may owe capital-gains tax (a 1031 exchange can defer both). Figures are a year-1 estimate at your 24.0% rate — not tax advice; consult a CPA.
Condition & rehab AI · 1 photo
The Harrington Plan is in excellent condition with no visible repairs needed. It offers a good return on investment with updates to the exterior, landscaping, kitchen, and bathrooms to maximize resale and rental value.
Value-add opportunities
- Both Painting exterior and interior — Fresh paint enhances curb appeal and interior aesthetics
- Both Landscaping improvements — Enhances curb appeal and adds value
- Both Kitchen updates — Modernizing the kitchen can attract more buyers and renters
- Both Bathroom updates — Modernizing bathrooms can attract more buyers and renters
Renovation cost estimate screening
Value-add ROI direction
- Both Painting exterior and interior — Fresh paint enhances curb appeal and interior aesthetics ↑
- Both Landscaping improvements — Enhances curb appeal and adds value ↑
- Both Kitchen updates — Modernizing the kitchen can attract more buyers and renters ↑
- Both Bathroom updates — Modernizing bathrooms can attract more buyers and renters ↑
ⓘ Cost ranges are severity-bucket heuristics (US national rule-of-thumb). Get contractor quotes + a written scope before underwriting a rehab budget.
Schools (NCES district)
- District
- Putnam County
- NCES district ID
- 1304260
- Math proficiency
- 33% ▼ -5.00%
- Reading proficiency
- 30% ▼ -1.00%
- Median HH income
- $44,038
- Composite
- 26.9/100
- National rank
- #7088
- State rank
- #86 of 174 in GA
Livability — Eatonton
- Score
- 71/100
- State rank
- #76
- US rank
- #6665
Category grades
Schools grade is shown separately in the Schools card above.
Census & demographics
- County
- Putnam County · 21,601 people
- City population
- 21,601
- Metro
- nan
- Population (ZIP)
- 21,601
- Household income
- $65,971
- Rent vs Own
- Severe rent burden
- 696.0
Population outlook (Putnam County) Hauer SSP2
- Today (2025)
- 20,747 people
- By 2030
- 20,163 · -2.8%
- By 2040
- 18,680 · -10.0%
- By 2050
- 17,117 · -17.5%
- By 2075
- 13,269 · -36.0%
- By 2100
- 9,234 · -55.5%
Race, ethnicity, and origin ACS 2023
- Neighborhood character
- Majority White (64%)
- Race & ethnicity
- White 64% Black 26% Hispanic / Latino 7% Two or more races 5%
- Hispanic origin (detail)
- Mexican 4%
- Common ancestry
- Slovak 1% Italian 1% Lithuanian 1%
- Foreign-born
- 6% · Canada
- Languages at home
- 94% English-only · Spanish 5%
Political lean MEDSL · Putnam
- 2024 margin
- Solid R (+42.2) · D 28.7% · R 71.0%
- 2008→2024 swing
- -10.9pp toward R · 2008: -31.4pp · 2024: -42.2pp
- All cycles
- 2024: R+42.2 2020: R+40.9 2016: R+40.0 2012: R+35.8 2008: R+31.4
Not yet ingested
- Civics
- —
Market trends
- HPI YoY
- ▼ -199.84%
- Current HPI
- 269.8265
- Rent YoY
- —
- Metro
- nan
- State GDP YoY
- ▲ 2.66%
- F500 in state
- 28
Industry mix (Fortune 500 HQ in GA)
| Industry | F500 HQs | Revenue |
|---|---|---|
| Paper / Packaging | 2 | $29B |
|
||
| Retail | 1 | $160B |
|
||
| Transportation / Logistics | 1 | $91B |
|
||
| Airlines | 1 | $62B |
|
||
| Consumer Goods | 1 | $47B |
|
||
| Utilities | 1 | $25B |
|
||
Price history
-5.7% since first listed3 events — show timeline
- 2026-02-09 Price Changed $297,900 Zillow
- 2025-06-04 Price Changed $307,900 Zillow
- 2024-06-14 Listed $315,900 Zillow
Cash-flow waterfall
monthlySold comps — $/sqft
last 12 mo · ≤1 miLoading sold comps…