 Multi-family
11730 Essex Rd · Riverview, VA
Flood risk 10/10 · Severe
- FEMA flood zone
- AE
- Chance of flooding over 30 yrs
- 0.99%
- Est. flood insurance / yr
- $1,737 – $8,500
Fire risk 2/10 · Minimal
- Est. fire insurance / yr
- $666 – $1,236
Heat risk 3/10 · Minor
- Hot days now (above 92°F)
- 7 days/yr
- Hot days in 30 yrs
- 21 days/yr
Wind risk 2/10 · Minimal
- Chance of severe wind over 30 yrs
- —
Air-quality risk 1/10 · Minimal
- Unhealthy air days now
- 0 days/yr
- Unhealthy air days in 30 yrs
- 0 days/yr
Risk factors via First Street. Map © Google.
Why this score? — see what drove the B+ grade
The composite is a weighted blend of 9 inputs, each scored 0–100. Each bar is that input's sub-score; the figure is the points it added to the 100-point composite (weight × sub-score).
- Cash flow +30.0/30.0
- 1% rule +10.0/10.0
- DSCR +10.0/10.0
- ARV discount +7.5/15.0
- Schools +6.3/10.0
- Appreciation +5.0/10.0
- Livability +2.8/5.0
- Rent growth +2.5/5.0
- Condition / age +1.0/5.0
$65,000
🖨 Deal sheet 📄 Offer letter ✓ Due diligence
Multi-family units
County records classify this as Multi-Family (2-4 Unit). Listing-text estimate: 1 unit. estimate disagrees with records
Listing remarks
Potential Income-Producing Mobile Home Park Opportunity in Virginia! This established trailer park features 3 total units with excellent income-producing potential and opportunity for future growth. Conveniently located with easy access to local amenities, shopping, and major roadways, this property presents a great investment opportunity for both seasoned investors and those looking to expand their portfolio. With value-add possibilities and long-term investment potential, this multi-unit property offers the chance to create steady cash flow in a growing market. Don't miss this opportunity to invest in Virginia real estate with strong upside potential. Schedule your showing today!
Key facts
- Steady cash flow
- Growing market
- Multi-unit property
Tags
Property features AI
Exterior
- Utilities: Public water
- Home design: Manufactured house; Multi-family residential property; Zoned for multi use
- Construction: Construction materials: Other
- Exterior features: Level topography; Property in a flood zone
Interior
- Interior features: Has heating; Heating type: Other
Neighborhood map
What this means for you Summary
Snapshot
- This is a multifamily listed at $65k. Condition is rated poor.
Deal economics
- At list price, monthly cash flow is $151 ($2k/yr) — positive.
- The deal already cash-flows at list — no discount required.
- Meets the 1% rule at list price ($1k rent vs $65k).
- Recommended offer: $63k (3.0% below list) — sets the bar for market timing.
Location & tenants
- Location reads 55/100 on livability (#516 in VA) — a working-class tenant base; expect higher turnover. Strengths: cost of living A+, housing A; Watch: crime D+, amenities F, commute F.
- Wise County Public School District (town): math 74% / reading 79% proficiency, ranked #11 of 131 in VA (top 8%) — strong family-tenant draw, lease renewals of 3-5y typical.
- Zoned schools: Coeburn Primary (math 82% / reading 82%, grade A+, #106 of 1,108 statewide, top 11%, 466 students, 80% FRL); Coeburn Middle (math 76% / reading 80%, grade A+, #34 of 342 statewide, top 10%, 307 students, 89% FRL); Union High (math 57% / reading 77%, grade B, #185 of 319 statewide, top 61%, 601 students, 86% FRL) — zoned schools average 85% FRL vs 55% district-wide (30 pts higher); higher-poverty schools than district average — tighter screening recommended.
- Market conditions: 46 active listings in the ZIP; 1 comparable units currently listed for rent nearby; 17 units permitted in Wise County in 2024 (0 in 5+ unit buildings).
Forward outlook
- In year one you build about $493 of equity ($449 loan paydown + $44 appreciation (0.1% local appreciation)).
- Wise County population projected at -26% by 2050 — secular population decline; favor cash flow + early exit over multi-decade hold.
- At projected returns (0.1% appreciation + 3.0% rent growth), your $18k cash investment doubles in ~7 years — after that, you're playing with house money.
Negotiation context
- It's been on market 38 days — a 3% lower offer ($63k) is reasonable based on typical stale-listing flexibility.
Risks & watch-outs
- Watch-outs: flood insurance adds $427/mo.
- Climate carrying-cost: in FEMA flood zone AE (mandatory federal flood insurance) — expect insurance premiums to compound above CPI over the hold.
Questions for the listing agent
- It's been on market 38 days. Have you received any prior offers? Is the seller open to a 3% concession, seller financing, or rate buy-down credit?
- Have any recent inspections been done? Can we get a copy of the seller's disclosures and any deferred-maintenance estimates?
- What's the actual annual flood-insurance premium (NFIP or private), and is the property in a SFHA with mandatory coverage?
- Is there a deadline driving the sale (1031 exchange, divorce, estate, relocation)? That informs how much negotiation room exists.
- Schools are F-rated, which usually means shorter tenancies and higher turnover. Who's the typical renter profile here, and what's been the actual vacancy rate?
- Crime grade is D in this area — have there been break-ins, vandalism, or insurance claims at this property in the last 3 years? What carrier currently insures it and at what premium?
- What's the average days-on-market for RENTAL listings here right now (not sales)? A rising rental-DOM trend means longer vacancies and softer asking-rent achievability than the comps imply.
- What's the recent tenant-quality profile in this submarket — average credit score on applications, eviction rate, late-payment / NSF rate, and stable-employment percentage? A property-management company in the area should have these aggregated.
- How much new apartment / multifamily construction is in the pipeline within 1–3 miles? Heavy new supply (>2% of stock underway) typically softens rents 12–24 months out; light construction supports rent growth.
Investment metrics
- 1% rule
- 2.00% ✓
- Cap rate
- 16.96%
- Cash-on-cash
- 38.10%
- DSCR
- 2.70
- GRM
- 4.2
CMA / ARV
No comps found within radius.
Projected returns pro-forma
0.07% appreciation · 3.0% rent growth · sell at horizon
- IRR
- 9.4%
- Equity multiple
- 1.45×
- Total profit
- $8,222
- Equity at exit
- $19,096
- IRR
- 14.5%
- Equity multiple
- 2.62×
- Total profit
- $29,473
- Equity at exit
- $23,131
Cash invested: $18,200 (down + closing). Projections, not guarantees.
Landlord ↔ Tenant lean methodology
- Overall (STATE)
- 55 Moderately Landlord-Leaning
- State Virginia
- 55 Moderately Landlord-Leaning · D+2
- County
- — inherits STATE
- City
- — inherits STATE
ZIP-level market 24230
- Home prices YoY
- 0.1%
- Active inventory
- 46
- Price-to-rent
- 4.2×
Monthly cashflow live
- Estimated rent
- $1,300 medium interval (Pro) →
- Mortgage (P&I)
- −$341
- Tax est. 1.5%
- −$81 /mo · $975/yr
- Insurance
- −$27
- Flood insurance flood zone
- −$427 /mo · $5,118/yr
- HOA
- −$0
- Vacancy / Maint / Mgmt
- −$273
- Net cashflow
- $151
Break-even live
UW: 25.0% down · 7.5% · 30yr · 1.5% tax · 5.0% vac · 8.0% maint · 8.0% mgmt
Financing live
Cash to close
- Down payment
- $16,250
- Closing costs
- $1,950
- Reserves months
- —
- Total cash needed
- —
Loan-product check · same deal, 3 products live
Conventional
25% down · 7.5% · 30yr
- Down + closing
- —
- Monthly P&I
- —
- Monthly cashflow
- —
- DSCR
- —
- Eligible?
- —
Personal DTI + credit; lowest rate.
DSCR
20% down · 8.5% · 30yr
- Down + closing
- —
- Monthly P&I
- —
- Monthly cashflow
- —
- DSCR
- —
- Eligible?
- —
No personal income docs; deal must DSCR.
Hard money
10% down · 12.0% · 12mo
- Down + closing
- —
- Monthly P&I
- —
- Monthly cashflow
- —
- DSCR
- —
- Eligible?
- —
Short-term bridge; refi at stabilization.
Rent comps 1 comps
| Address | Beds | Baths | Sqft | Rent | $/sqft | DOM | Units | Dist |
|---|---|---|---|---|---|---|---|---|
| 208 Prospect Ave NW Coeburn, VA | 3.0 | 1.0 | 1400 | $1,300 | $0.93 | 44d | 1 | 0.53mi |
Listing history 16 events
-
2026-06-18days on market $65,000 Active 38 DOM
-
2026-06-17days on market $65,000 Active 37 DOM
-
2026-06-16days on market $65,000 Active 36 DOM
-
2026-06-15days on market $65,000 Active 35 DOM
-
2026-06-15days on market $65,000 Active 34 DOM
-
2026-06-13days on market $65,000 Active 33 DOM
-
2026-06-12days on market $65,000 Active 32 DOM
-
2026-06-09days on market $65,000 Active 29 DOM
-
2026-06-08days on market $65,000 Active 28 DOM
-
2026-06-08days on market $65,000 Active 27 DOM
-
2026-06-07days on market $65,000 Active 26 DOM
-
2026-06-03days on market $65,000 Active 23 DOM
-
2026-06-02days on market $65,000 Active 22 DOM
-
2026-06-01days on market $65,000 Active 21 DOM
-
2026-05-31days on market $65,000 Active 20 DOM
-
2026-05-11$65,000 Active 690-char remark
ⓘ Source: listings_history table (triggers on properties + properties_extension) + one-shot
backfill from property_details.listing_events for pre-trigger history.
Climate risk First Street
- Flood 10/10 Extreme FEMA zone AE · 99% chance over 30 yrs
- Wildfire 2/10 Low
- Heat 3/10 Moderate 7 d/yr ≥92°F today · 21 d/yr by 30 yrs out
- Wind 2/10 Low
- Air quality 1/10 Low 0 unhealthy d/yr today · 0 by 30 yrs out
Nearby sold comps map
Loading sold comps map…
Walkable amenities ~0.75 mi
Loading nearby amenities…
Taxation est. · year 1
- Rental income
- $15,600
- − Mortgage interest
- −$3,641
- − Property taxes
- −$975
- − Insurance
- −$5,444
- − Repairs & maintenance
- −$1,248
- − Management
- −$1,248
- − Depreciation
- −$1,891
- Taxable income
- $1,154
- Est. tax owed @ 24.0%
- −$277
- After-tax cash flow
- $1,538/yr
For passive investors: Depreciation is non-cash, so a rental often shows a tax loss while cash-flowing — sheltering income. Rental losses are passive: they offset passive income freely, and up to $25,000/yr can offset ordinary (W-2) income if you actively participate and your MAGI is under $100k (phasing out to $0 by $150k); unused losses carry forward. On sale, claimed depreciation is recaptured at up to 25%, and gains may owe capital-gains tax (a 1031 exchange can defer both). Figures are a year-1 estimate at your 24.0% rate — not tax advice; consult a CPA.
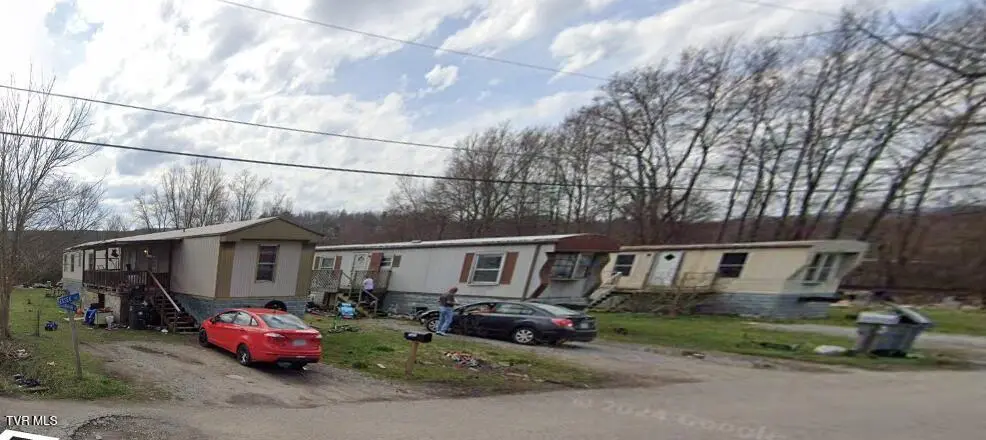
Condition & rehab AI · 1 photo
This multi-family mobile home park is in poor condition with extensive structural and interior damage. Significant repairs and improvements are needed to stabilize the units and improve their resale and rental value.
Repairs flagged
- Major structural repairs — The mobile homes are tilted and appear to be structurally compromised
- Major roof repairs — The roof is visibly damaged and needs immediate attention
- Major flooring repairs — The flooring is damaged and uneven, requiring replacement
- Major interior wall repairs — The interior walls and paint are damaged and peeling, requiring extensive repairs
- Major HVAC and mechanical repairs — The systems appear to be in disrepair and need professional assessment and repair
- Major landscaping and curb appeal — The area is cluttered with debris and overgrown vegetation, requiring landscaping and curb appeal improvements
Value-add opportunities
- Both structural repairs and stabilization — Stabilizing the mobile homes and addressing structural issues will improve both resale and rental value
- Both exterior and interior repairs — Repairing the exterior and interior will enhance the home's appearance and appeal to potential buyers or renters
- Both HVAC and mechanical upgrades — Upgrading the HVAC and mechanical systems will improve comfort and energy efficiency, attracting more tenants and buyers
- Both landscaping and curb appeal improvements — Aesthetic improvements will enhance the home's curb appeal and attract more potential buyers or renters
Renovation cost estimate screening
| Repair item | Severity | Est. cost |
|---|---|---|
| structural repairs · The mobile homes are tilted and appear to be structurally compromised | Major | $15,000–50,000 |
| roof repairs · The roof is visibly damaged and needs immediate attention | Major | $15,000–50,000 |
| flooring repairs · The flooring is damaged and uneven, requiring replacement | Major | $15,000–50,000 |
| interior wall repairs · The interior walls and paint are damaged and peeling, requiring extensive repairs | Major | $15,000–50,000 |
| HVAC and mechanical repairs · The systems appear to be in disrepair and need professional assessment and repair | Major | $15,000–50,000 |
| landscaping and curb appeal · The area is cluttered with debris and overgrown vegetation, requiring landscaping and curb appeal improvements | Major | $15,000–50,000 |
| Total estimated repair cost · 6 items | $90,000–300,000 |
Value-add ROI direction
- Both structural repairs and stabilization — Stabilizing the mobile homes and addressing structural issues will improve both resale and rental value ↑
- Both exterior and interior repairs — Repairing the exterior and interior will enhance the home's appearance and appeal to potential buyers or renters ↑
- Both HVAC and mechanical upgrades — Upgrading the HVAC and mechanical systems will improve comfort and energy efficiency, attracting more tenants and buyers ↑
- Both landscaping and curb appeal improvements — Aesthetic improvements will enhance the home's curb appeal and attract more potential buyers or renters ↑
ⓘ Cost ranges are severity-bucket heuristics (US national rule-of-thumb). Get contractor quotes + a written scope before underwriting a rehab budget.
Schools (NCES district)
- District
- Wise County Public School District
- NCES district ID
- 5104080
- Math proficiency
- 74% ▼ -20.00%
- Reading proficiency
- 79% ▼ -7.00%
- Median HH income
- $35,624
- Composite
- 63.37/100
- National rank
- #625
- State rank
- #11 of 131 in VA
Livability — Riverview
- Score
- 55/100
- State rank
- #516
- US rank
- #23306
Category grades
Schools grade is shown separately in the Schools card above.
Census & demographics
- Census place
- Riverview, VA
- Population (ZIP)
- 7,057
Population outlook (Wise County) Hauer SSP2
- Today (2025)
- 35,714 people
- By 2030
- 33,742 · -5.5%
- By 2040
- 29,870 · -16.4%
- By 2050
- 26,233 · -26.5%
- By 2075
- 18,296 · -48.8%
- By 2100
- 12,147 · -66.0%
Race, ethnicity, and origin ACS 2023
- Neighborhood character
- Predominantly White (93%)
- Race & ethnicity
- White 93% Black 3% Hispanic / Latino 1%
- Common ancestry
- Slovak 2% Italian 2% Serbian 1%
- Foreign-born
- 2% · Canada
- Languages at home
- 98% English-only · Spanish 1%
Political lean MEDSL · Wise
- 2024 margin
- Solid R (+63.3) · D 18.1% · R 81.4%
- 2008→2024 swing
- -35.6pp toward R · 2008: -27.7pp · 2024: -63.3pp
- All cycles
- 2024: R+63.3 2020: R+61.7 2016: R+62.0 2012: R+48.8 2008: R+27.7
Not yet ingested
- Civics
- —
Market trends
- HPI YoY
- ▲ 0.07%
- Current HPI
- 135.5947
- Rent YoY
- —
- Metro
- —
- State GDP YoY
- ▲ 2.40%
- F500 in state
- 50
Industry mix (Fortune 500 HQ in VA)
| Industry | F500 HQs | Revenue |
|---|---|---|
| Aerospace / Defense | 4 | $236B |
|
||
| Technology / Defense | 3 | $32B |
|
||
| Financial Services | 2 | $176B |
|
||
| Utilities | 2 | $27B |
|
||
| Insurance | 2 | $25B |
|
||
| Technology | 2 | $15B |
|
||
Price history
1 event — show timeline
- 2026-05-11 Listed $65,000 TVRMLS
Cash-flow waterfall
monthlySold comps — $/sqft
last 12 mo · ≤1 miLoading sold comps…