5248 Sam Houston Dr · Log Cabin, TX
Flood risk 1/10 · Minimal
- FEMA flood zone
- X (unshaded)
- Chance of flooding over 30 yrs
- 0.0%
- Est. flood insurance / yr
- $507 – $1,088
Fire risk 3/10 · Minor
- Est. fire insurance / yr
- $1,222 – $2,270
Heat risk 7/10 · Major
- Hot days now (above 110°F)
- 7 days/yr
- Hot days in 30 yrs
- 26 days/yr
Wind risk 6/10 · Moderate
- Chance of severe wind over 30 yrs
- 62.0%
Air-quality risk 2/10 · Minimal
- Unhealthy air days now
- 0 days/yr
- Unhealthy air days in 30 yrs
- 1 days/yr
Risk factors via First Street. Map © Google.
Why this score? — see what drove the D- grade
The composite is a weighted blend of 9 inputs, each scored 0–100. Each bar is that input's sub-score; the figure is the points it added to the 100-point composite (weight × sub-score).
- Cash flow +17.7/30.0
- DSCR +5.5/10.0
- 1% rule +4.4/10.0
- Schools +3.2/10.0
- Rent growth +2.5/5.0
- Condition / age +2.5/5.0
- Livability +1.9/5.0
- ARV discount +0.0/15.0
- Appreciation +0.0/10.0
$254,500
🖨 Deal sheet 📄 Offer letter ✓ Due diligence
Listing remarks MLS
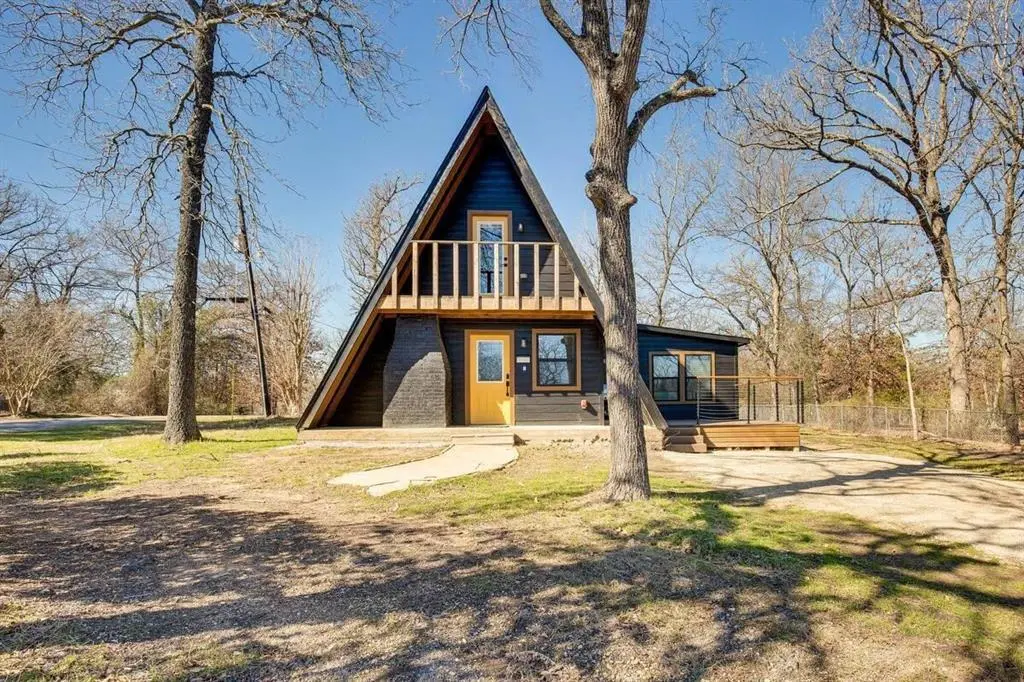
Welcome to a home that truly stands out. Ideally located in a peaceful neighborhood, yet just minutes from schools, shopping, and everyday conveniences, this property offers the perfect balance between tranquility and accessibility. Enjoy easy access to outdoor living with a nearby boat launch, swimming area, and playground, making it an ideal setting for families and anyone who loves an active lifestyle. Owner financing is available with flexible terms depending on the offer and buyer profile (minimum 20% down payment), creating a unique opportunity for buyers seeking alternative financing options. Built in 2022, this eye-catching A-Frame home features 3 bedrooms and 2 bathrooms, with a layout that works perfectly for everyday living, relaxing, or entertaining guests. The open design, abundant natural light, and distinctive architecture create a warm and inviting atmosphere that sets this home apart from the rest. Beyond its appeal as a primary residence, this property also presents an excellent opportunity for those looking to enter the short-term rental market. Its unique A-Frame design and desirable location make it highly attractive for guests and a strong option for investors. Don’t miss the chance to own a property that offers lifestyle, flexibility, and investment potential all in one. Schedule your showing today. PS: Agent is related to seller.
Key facts
- Swimming area
- Boat launch
- A-frame home
Tags
Neighborhood map
What this means for you Summary
Snapshot
- This is a 3-bed/2.0-bath single-family listed at $254k.
Deal economics
- At list price, monthly cash flow is $207 ($2k/yr) — positive.
- The deal already cash-flows at list — no discount required.
- To meet the 1% rule (rent ≥ 1% of price), the offer needs to be $240k (5.7% below list).
- Recommended offer: $239k (6.0% below list) — sets the bar for market timing.
- Cap rate 7.3% vs local median 0.9% in Log Cabin — top-decile yield for the area; either an underpriced asset or a hidden risk that comps aren't pricing in. Stress-test before assuming the spread holds.
Location & tenants
- Location reads 38/100 on livability (#1,626 in TX) — a limited-amenity area; tenant pool skews transient or value-seeking. Strengths: cost of living A+, crime A; Watch: schools F, amenities F, commute F.
- Eustace ISD (rural): math 32% / reading 45% proficiency, ranked #455 of 826 in TX (top 55%) — families likely to look elsewhere, expect single-tenant / working-renter base with shorter leases; 62% free/reduced lunch — lower-income household profile, screen leases tightly.
- Market conditions: 225 active listings in the ZIP; 1 comparable units currently listed for rent nearby; 263 units permitted in Henderson County in 2024 (0 in 5+ unit buildings).
Forward outlook
- Local home prices are declining (-3.0%/yr); year-one equity from $2k of loan paydown is wiped out by about $8k of value loss. Plan a longer hold.
Negotiation context
- It's been on market 86 days — a 6% lower offer ($239k) is reasonable based on typical stale-listing flexibility.
- 8 sale attempts since 7y ago; this cycle's ask is 13295% above the opening price — seller raised mid-cycle; expect resistance to lowballs.
Risks & watch-outs
- Climate carrying-cost: major wind risk, 62% chance of damaging wind over 30y; extreme-heat days projected 7→26/yr by 2055 (HVAC capex compounding) — expect insurance premiums to compound above CPI over the hold.
Questions for the listing agent
- It's been on market 86 days. Have you received any prior offers? Is the seller open to a 6% concession, seller financing, or rate buy-down credit?
- Why hasn't it sold? Are there any deal-killer items the seller is aware of (foundation, flood, title, zoning, code violations)?
- Is there a deadline driving the sale (1031 exchange, divorce, estate, relocation)? That informs how much negotiation room exists.
- Schools are F-rated, which usually means shorter tenancies and higher turnover. Who's the typical renter profile here, and what's been the actual vacancy rate?
- The area grade is low — what's the realistic commute time and amenity access for the typical tenant pool here? Any planned neighborhood developments (good or bad) we should know about?
- What's the average days-on-market for RENTAL listings here right now (not sales)? A rising rental-DOM trend means longer vacancies and softer asking-rent achievability than the comps imply.
- What's the recent tenant-quality profile in this submarket — average credit score on applications, eviction rate, late-payment / NSF rate, and stable-employment percentage? A property-management company in the area should have these aggregated.
- How much new for-sale + rental construction is in the pipeline within 1–3 miles? Heavy new supply typically softens prices + rents 12–24 months out; constrained supply supports both.
Investment metrics
- 1% rule
- 0.94% ✗
- Cap rate
- 7.27%
- Cash-on-cash
- 3.48%
- DSCR
- 1.15
- GRM
- 8.8
CMA / ARV
- ARV (median comp)
- $183,493
- List price
- $254,500
- Delta
- 38.70%
- Verdict
- OVERPRICED
- Comps
- 20 within 1.0 mi
Show comp detail 5 sales within ~0.75 mi
| Address | Dist | Beds/Ba | Sqft | Sold | Price | $/sf | Match |
|---|---|---|---|---|---|---|---|
| 5253 Bill Cody Cir | 0.06mi | 3/2.0 | 1,600 (-1%) | 11mo | $210,000 | $131 | 86 |
| 14347 Jim Bowie | 0.16mi | 3/2.0 | 1,558 (-4%) | 16mo | $169,900 | $109 | 74 |
| 5530 Sam Slade Trl | 0.60mi | 3/2.0 | 1,570 (-3%) | 4mo | $249,900 | $159 | 64 |
| 14815 Goliad Dr | 0.47mi | 3/2.0 | 1,500 (-7%) | 10mo | $249,900 | $167 | 58 |
| 13695 Sherre Cir | 0.75mi | 4/2.0 (+1) | 1,660 (+3%) | 8mo | $749,000 | $451 | 49 |
Match score weights: distance 35% · size 25% · config 20% · recency 20%. Top-matched comps best support the ARV.
Projected returns pro-forma
-3.0% appreciation · 3.0% rent growth · sell at horizon
- IRR
- -10.8%
- Equity multiple
- 0.61×
- Total profit
- $-28,081
- Equity at exit
- $37,947
- IRR
- -1.5%
- Equity multiple
- 0.89×
- Total profit
- $-7,527
- Equity at exit
- $22,005
Cash invested: $71,260 (down + closing). Projections, not guarantees.
Landlord ↔ Tenant lean methodology
- Overall (STATE)
- 87 Strongly Landlord-Friendly
- State Texas
- 87 Strongly Landlord-Friendly · R+5
- County
- — inherits STATE
- City
- — inherits STATE
ZIP-level market 75148
- Home prices YoY
- -27.6%
- Active inventory
- 225
- Price-to-rent
- 8.8×
Monthly cashflow live
- Estimated rent
- $2,400 medium interval (Pro) →
- Mortgage (P&I)
- −$1,335
- Tax from tax record
- −$249 /mo · $2,984/yr
- Insurance
- −$106
- HOA
- −$0
- Vacancy / Maint / Mgmt
- −$504
- Net cashflow
- $207
Break-even live
UW: 25.0% down · 7.5% · 30yr · 1.5% tax · 5.0% vac · 8.0% maint · 8.0% mgmt
Financing live
Cash to close
- Down payment
- $63,625
- Closing costs
- $7,635
- Reserves months
- —
- Total cash needed
- —
Loan-product check · same deal, 3 products live
Conventional
25% down · 7.5% · 30yr
- Down + closing
- —
- Monthly P&I
- —
- Monthly cashflow
- —
- DSCR
- —
- Eligible?
- —
Personal DTI + credit; lowest rate.
DSCR
20% down · 8.5% · 30yr
- Down + closing
- —
- Monthly P&I
- —
- Monthly cashflow
- —
- DSCR
- —
- Eligible?
- —
No personal income docs; deal must DSCR.
Hard money
10% down · 12.0% · 12mo
- Down + closing
- —
- Monthly P&I
- —
- Monthly cashflow
- —
- DSCR
- —
- Eligible?
- —
Short-term bridge; refi at stabilization.
Rent comps 1 comps
| Address | Beds | Baths | Sqft | Rent | $/sqft | DOM | Units | Dist |
|---|---|---|---|---|---|---|---|---|
| 5320 Loma Vis Malakoff, TX | 2.0 | 2.0 | 1324 | $2,400 | $1.81 | 43d | 1 | 0.98mi |
Listing history 36 events
-
2026-06-19days on market $254,500 Active 86 DOM
-
2026-06-18days on market $254,500 Active 85 DOM
-
2026-06-17days on market $254,500 Active 84 DOM
-
2026-06-16days on market $254,500 Active 83 DOM
-
2026-06-15days on market $254,500 Active 82 DOM
-
2026-06-14days on market $254,500 Active 80 DOM
-
2026-06-12days on market $254,500 Active 79 DOM
-
2026-06-09days on market $254,500 Active 76 DOM
-
2026-06-08days on market $254,500 Active 75 DOM
-
2026-06-07days on market $254,500 Active 74 DOM
-
2026-06-05days on market $254,500 Active 71 DOM
-
2026-06-02days on market $254,500 Active 69 DOM
-
2026-06-01days on market $254,500 Active 68 DOM
-
2026-05-31days on market $254,500 Active 67 DOM
-
2026-05-30days on market $254,500 Active 66 DOM
-
2026-05-01price $254,500 1396-char remark
Show marketing remark (1396 chars)
Welcome to a home that truly stands out. Ideally located in a peaceful neighborhood, yet just minutes from schools, shopping, and everyday conveniences, this property offers the perfect balance between tranquility and accessibility. Enjoy easy access to outdoor living with a nearby boat launch, swimming area, and playground, making it an ideal setting for families and anyone who loves an active lifestyle. Owner financing is available with flexible terms depending on the offer and buyer profile (minimum 20% down payment), creating a unique opportunity for buyers seeking alternative financing options. Built in 2022, this eye-catching A-Frame home features 3 bedrooms and 2 bathrooms, with a layout that works perfectly for everyday living, relaxing, or entertaining guests. The open design, abundant natural light, and distinctive architecture create a warm and inviting atmosphere that sets this home apart from the rest. Beyond its appeal as a primary residence, this property also presents an excellent opportunity for those looking to enter the short-term rental market. Its unique A-Frame design and desirable location make it highly attractive for guests and a strong option for investors. Don’t miss the chance to own a property that offers lifestyle, flexibility, and investment potential all in one. Schedule your showing today. PS: Agent is related to seller.
-
2026-03-26$1,900
-
2026-03-23$255,000 Active 1396-char remark
Show marketing remark (1396 chars)
Welcome to a home that truly stands out. Ideally located in a peaceful neighborhood, yet just minutes from schools, shopping, and everyday conveniences, this property offers the perfect balance between tranquility and accessibility. Enjoy easy access to outdoor living with a nearby boat launch, swimming area, and playground, making it an ideal setting for families and anyone who loves an active lifestyle. Owner financing is available with flexible terms depending on the offer and buyer profile (minimum 20% down payment), creating a unique opportunity for buyers seeking alternative financing options. Built in 2022, this eye-catching A-Frame home features 3 bedrooms and 2 bathrooms, with a layout that works perfectly for everyday living, relaxing, or entertaining guests. The open design, abundant natural light, and distinctive architecture create a warm and inviting atmosphere that sets this home apart from the rest. Beyond its appeal as a primary residence, this property also presents an excellent opportunity for those looking to enter the short-term rental market. Its unique A-Frame design and desirable location make it highly attractive for guests and a strong option for investors. Don’t miss the chance to own a property that offers lifestyle, flexibility, and investment potential all in one. Schedule your showing today. PS: Agent is related to seller.
-
2025-09-25historical $1,800
-
2025-09-12$1,800
-
2025-03-31historical
-
2025-03-01historical $2,800
-
2024-11-29$2,800
-
2024-11-19$299,999 Active
-
2022-07-12soldstatus
-
2022-06-24soldstatus Closed
-
2022-06-10status Pending
-
2022-06-09price $79,900
-
2021-10-14$89,900 Active
-
2021-04-12soldstatus
-
2020-07-04historical
-
2019-07-15status Active
-
2019-07-08price $29,000
-
2019-07-08$2,900 Active
-
2019-07-08historical
-
2002-07-12soldstatus
ⓘ Source: listings_history table (triggers on properties + properties_extension) + one-shot
backfill from property_details.listing_events for pre-trigger history.
Tax reassessment forecast TX · Resets to sale price
- Current annual tax
- $2,984 · $249/mo
- Projected year-2 tax
- $4,657 · $388/mo
- Expected delta
- +$1,674/yr (+$139/mo · 56.1%)
ⓘ Screening estimate from a state-policy table — verify with the county assessor before closing.
Climate risk First Street
- Flood 1/10 Low FEMA zone X (unshaded) · 0% chance over 30 yrs
- Wildfire 3/10 Moderate
- Heat 7/10 Severe 7 d/yr ≥110°F today · 26 d/yr by 30 yrs out
- Wind 6/10 Major 62% chance of damaging wind over 30 yrs
- Air quality 2/10 Low 0 unhealthy d/yr today · 1 by 30 yrs out
Nearby sold comps map
Loading sold comps map…
Walkable amenities ~0.75 mi
Loading nearby amenities…
Taxation est. · year 1
- Rental income
- $28,800
- − Mortgage interest
- −$14,256
- − Property taxes
- −$2,984
- − Insurance
- −$1,272
- − Repairs & maintenance
- −$2,304
- − Management
- −$2,304
- − Depreciation
- −$7,404
- Taxable loss
- −$1,724
- Est. tax savings @ 24.0%
- +$414
- After-tax cash flow
- $2,894/yr
For passive investors: Depreciation is non-cash, so a rental often shows a tax loss while cash-flowing — sheltering income. Rental losses are passive: they offset passive income freely, and up to $25,000/yr can offset ordinary (W-2) income if you actively participate and your MAGI is under $100k (phasing out to $0 by $150k); unused losses carry forward. On sale, claimed depreciation is recaptured at up to 25%, and gains may owe capital-gains tax (a 1031 exchange can defer both). Figures are a year-1 estimate at your 24.0% rate — not tax advice; consult a CPA.
Schools (NCES district)
- District
- Eustace ISD
- NCES district ID
- 4818720
- Math proficiency
- 32% ▼ -18.00%
- Reading proficiency
- 45% ▼ -7.00%
- Median HH income
- $42,425
- Composite
- 32.48/100
- National rank
- #5711
- State rank
- #455 of 826 in TX
Livability — Log Cabin
- Score
- 38/100
- State rank
- #1626
- US rank
- #27499
Category grades
Schools grade is shown separately in the Schools card above.
Census & demographics
- Census place
- Log Cabin, TX
- Population (ZIP)
- 5,944
Population outlook (Henderson County) Hauer SSP2
- Today (2025)
- 80,471 people
- By 2030
- 80,608 · +0.2%
- By 2040
- 80,087 · -0.5%
- By 2050
- 78,208 · -2.8%
- By 2075
- 72,423 · -10.0%
- By 2100
- 61,012 · -24.2%
Race, ethnicity, and origin ACS 2023
- Neighborhood character
- Predominantly White (71%)
- Race & ethnicity
- White 71% Two or more races 11% Hispanic / Latino 11% Black 11%
- Hispanic origin (detail)
- Mexican 10%
- Common ancestry
- Russian 2% Slovak 2% Italian 1%
- Foreign-born
- 5% · Canada
- Languages at home
- 92% English-only · Spanish 8%
Political lean MEDSL · Henderson
- 2024 margin
- Solid R (+63.5) · D 18.0% · R 81.4%
- 2008→2024 swing
- -18.8pp toward R · 2008: -44.6pp · 2024: -63.5pp
- All cycles
- 2024: R+63.5 2020: R+60.2 2016: R+60.0 2012: R+54.8 2008: R+44.6
Not yet ingested
- Civics
- —
Market trends
- HPI YoY
- ▼ -82.76%
- Current HPI
- 217.1629
- Rent YoY
- —
- Metro
- —
- State GDP YoY
- ▲ 3.95%
- F500 in state
- 110
Industry mix (Fortune 500 HQ in TX)
| Industry | F500 HQs | Revenue |
|---|---|---|
| Energy | 16 | $1,198B |
|
||
| Technology | 5 | $198B |
|
||
| Engineering / Construction | 4 | $72B |
|
||
| Energy Services | 3 | $60B |
|
||
| Utilities | 3 | $41B |
|
||
| Healthcare | 2 | $330B |
|
||
Price history
+8675.9% since first listed21 events — show timeline
- 2026-05-01 Price Changed $254,500 NTREIS
- 2026-03-26 Listed for Rent $1,900 NTREIS
- 2026-03-23 Listed $255,000 NTREIS
- 2025-09-25 Rental Removed $1,800 NTREIS
- 2025-09-12 Listed for Rent $1,800 NTREIS
- 2025-03-31 Listing Removed — NTREIS
- 2025-03-01 Rental Removed $2,800 NTREIS
- 2024-11-29 Listed for Rent $2,800 NTREIS
- 2024-11-19 Listed $299,999 NTREIS
- 2022-07-12 Sold (Public Records) — Public Records
- 2022-06-24 Sold (MLS) — NTREIS
- 2022-06-10 Pending — NTREIS
- 2022-06-09 Price Changed $79,900 NTREIS
- 2021-10-14 Listed $89,900 NTREIS
- 2021-04-12 Sold (Public Records) — Public Records
- 2020-07-04 Listing Removed — NTREIS
- 2019-07-15 Relisted — NTREIS
- 2019-07-08 Price Changed $29,000 NTREIS
- 2019-07-08 Listing Removed — NTREIS
- 2019-07-08 Listed $2,900 NTREIS
- 2002-07-12 Sold (Public Records) — Public Records
Property tax history
+8.0%/yrLatest (2025): $2,984 · -2.4% YoY. Source: county tax records.
Cash-flow waterfall
monthlySold comps — $/sqft
last 12 mo · ≤1 miLoading sold comps…