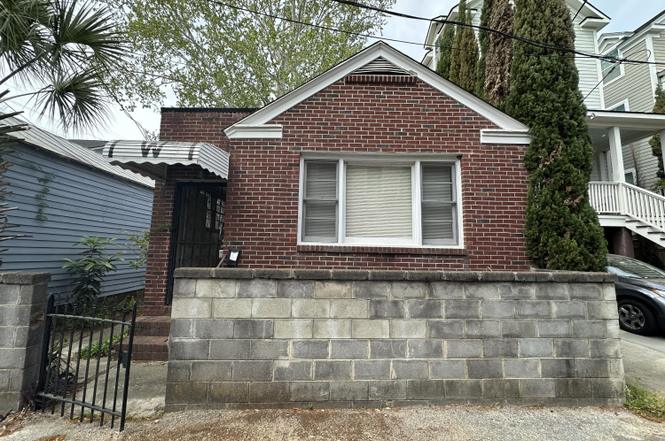
3 Woodall Ct · Charleston, SC
Flood risk 9/10 · Severe
- FEMA flood zone
- AE
- Chance of flooding over 30 yrs
- 0.99%
- Est. flood insurance / yr
- $1,737 – $8,500
Fire risk 3/10 · Minor
- Est. fire insurance / yr
- $783 – $1,453
Heat risk 10/10 · Severe
- Hot days now (above 105°F)
- 7 days/yr
- Hot days in 30 yrs
- 18 days/yr
Wind risk 9/10 · Severe
- Chance of severe wind over 30 yrs
- 99.0%
Air-quality risk 3/10 · Minor
- Unhealthy air days now
- 3 days/yr
- Unhealthy air days in 30 yrs
- 3 days/yr
Risk factors via First Street. Map © Google.
Why this score? — see what drove the B- grade
The composite is a weighted blend of 9 inputs, each scored 0–100. Each bar is that input's sub-score; the figure is the points it added to the 100-point composite (weight × sub-score).
- Cash flow +28.0/30.0
- DSCR +9.9/10.0
- ARV discount +7.5/15.0
- 1% rule +6.8/10.0
- Schools +4.3/10.0
- Livability +3.8/5.0
- Rent growth +3.6/5.0
- Condition / age +2.5/5.0
- Appreciation +0.0/10.0
$375,000
🖨 Deal sheet 📄 Offer letter ✓ Due diligence
Listing remarks
Opportunity awaits at 3 Woodall Court! This gutted home is ready for renovation or a fresh vision. Located within walking distance to restaurants, The Citadel, MUSC, and Hampton Park, the possibilities are endless. Purchase individually or combine with 227 and 229 Fishburne Street for a larger downtown project. Don't miss this incredible chance to create something special in the heart of Charleston! No off-street parking for this property. No survey or plat. Permit for the removal of the large Sycamore tree can be found in the documents. UPDATE 5/26/2026: WE HAVE HAD A LOT OF INTEREST AND OFFERS ON THESE PROPERTIES. AT THIS TIME, THERE IS STILL NO ETA ON PROBATE AND NO CHANGES TO REPORT. SE
Key facts
- Heart of charleston
- 1,742 sq ft lot
- Built 1963
Tags
Property features AI
Finance
- HOA & community: Trash service included in community features
Exterior
- Utilities: Public sewer; Charleston Water Service; Dominion Energy
- Home design: Single-family detached home; One story; Located in the Westside subdivision; Residential property
- Construction: Asphalt roof
- Exterior features: Asphalt roof; Lot under 0.5 acre; No other structures on the property
Interior
- Bedrooms: 2 bedrooms (master bedroom on the lower level)
- Bathrooms: 1 bathroom
- Heating & cooling: Wall Unit(s)
- Interior features: Wall unit heating
Neighborhood map
What this means for you Summary
Snapshot
- This is a 3-bed/2.5-bath single-family listed at $375k.
Deal economics
- At list price, monthly cash flow is $743 ($9k/yr) — positive.
- The deal already cash-flows at list — no discount required.
- Meets the 1% rule at list price ($4k rent vs $375k).
- Recommended offer: $330k (12.0% below list) — sets the bar for market timing.
- Cap rate 10.0% vs local median 2.4% in Charleston — top-decile yield for the area; either an underpriced asset or a hidden risk that comps aren't pricing in. Stress-test before assuming the spread holds.
Location & tenants
- Location reads 76/100 on livability (#22 in SC, #3,336 nationally) — a middle-class / working-renter tenant base. Strengths: amenities A+, housing A+, health & safety A+; Watch: crime D+, commute F, cost of living D-.
- Charleston 01 (urban): math 48% / reading 53% proficiency, ranked #7 of 80 in SC (top 9%) — acceptable for families but not a draw, mixed tenant base, ~2y average lease.
- Zoned schools: Mitchell Elementary (math 22% / reading 8%, grade F, #549 of 597 statewide, top 92%, 222 students, 100% FRL); Simmons Pinckney Middle (math 3% / reading 13%, grade F, #226 of 229 statewide, top 99%, 219 students, 100% FRL); Burke High (math 32% / reading 67%, grade D, #151 of 196 statewide, top 79%, 352 students, 100% FRL) — zoned schools average 100% FRL vs 44% district-wide (56 pts higher); higher-poverty schools than district average — tighter screening recommended.
- Zoned-school proficiency averages 24% at this address vs 50% district-wide (-26 pts) — the specific schools serving this property underperform the Charleston 01 average; the district grade overstates school quality for this exact location.
- Market conditions: Rents rising fast (+4.6%/yr); 147 active listings in the ZIP; 40 comparable units currently listed for rent nearby; rentals at typical pace (median 15d on market — plan ~3-4 weeks tenant-placement turnaround); 4,156 units permitted in Charleston County in 2024 (857 in 5+ unit buildings).
Forward outlook
- Local home prices are declining (-3.0%/yr); year-one equity from $3k of loan paydown is wiped out by about $11k of value loss. Plan a longer hold.
- Charleston County population projected at +44% by 2050 — long-run rental-demand tailwind backs the buy-and-hold thesis.
- At projected returns (-3.0% appreciation + 4.6% rent growth), your $105k cash investment doubles in ~10 years — after that, you're playing with house money.
Negotiation context
- It's been on market 435 days — a 12% lower offer ($330k) is reasonable based on typical stale-listing flexibility.
- 3 sale attempts since 2y ago; this cycle's ask is 6150% above the opening price — seller raised mid-cycle; expect resistance to lowballs.
Risks & watch-outs
- Watch-outs: flood insurance adds $427/mo.
- Climate carrying-cost: in FEMA flood zone AE (mandatory federal flood insurance); severe wind risk, 99% chance of damaging wind over 30y; extreme-heat days projected 7→18/yr by 2055 (HVAC capex compounding) — expect insurance premiums to compound above CPI over the hold.
Questions for the listing agent
- It's been on market 435 days. Have you received any prior offers? Is the seller open to a 12% concession, seller financing, or rate buy-down credit?
- Built in 1963 — when were the roof, HVAC, electrical panel, plumbing, and water heater last replaced?
- What's the actual annual flood-insurance premium (NFIP or private), and is the property in a SFHA with mandatory coverage?
- Why hasn't it sold? Are there any deal-killer items the seller is aware of (foundation, flood, title, zoning, code violations)?
- Is there a deadline driving the sale (1031 exchange, divorce, estate, relocation)? That informs how much negotiation room exists.
- Schools are A-rated — typically a magnet for longer-tenancy family renters. What's the average tenant stay here, and is there a school-zone premium baked into asking?
- Crime grade is D in this area — have there been break-ins, vandalism, or insurance claims at this property in the last 3 years? What carrier currently insures it and at what premium?
- What's the average days-on-market for RENTAL listings here right now (not sales)? A rising rental-DOM trend means longer vacancies and softer asking-rent achievability than the comps imply.
- What's the recent tenant-quality profile in this submarket — average credit score on applications, eviction rate, late-payment / NSF rate, and stable-employment percentage? A property-management company in the area should have these aggregated.
- How much new for-sale + rental construction is in the pipeline within 1–3 miles? Heavy new supply typically softens prices + rents 12–24 months out; constrained supply supports both.
Investment metrics
- 1% rule
- 1.18% ✓
- Cap rate
- 10.04%
- Cash-on-cash
- 13.37%
- DSCR
- 1.59
- GRM
- 7.1
CMA / ARV
- ARV (on-the-fly)
- $882,000
- Comps found
- 12
Show comp detail 12 sales within ~0.75 mi
| Address | Dist | Beds/Ba | Sqft | Sold | Price | $/sf | Match |
|---|---|---|---|---|---|---|---|
| 14 F St Unit B | 0.60mi | 3/2.5 | 1,676 (-0%) | 2mo | $800,000 | $477 | 70 |
| 8 Islington Ct | 0.42mi | 3/3.0 | 1,540 (-8%) | 1mo | $800,000 | $519 | 64 |
| 68 Vanderhorst St Unit A | 0.72mi | 3/2.5 | 1,670 (-1%) | 2mo | $875,000 | $524 | 64 |
| 193 Saint Philip St | 0.60mi | 3/2.5 | 1,768 (+5%) | 0mo | $1,225,000 | $693 | 63 |
| 668 Rutledge Ave | 0.53mi | 3/1.5 | 1,620 (-4%) | 3mo | $799,999 | $494 | 63 |
| 2 F St | 0.60mi | 3/2.5 | 1,770 (+5%) | 1mo | $875,000 | $494 | 62 |
| 68 Vanderhorst St Unit B | 0.72mi | 3/2.5 | 1,720 (+2%) | 2mo | $875,000 | $509 | 61 |
| 122 Smith St | 0.73mi | 3/2.5 | 1,724 (+3%) | 1mo | $1,595,000 | $925 | 61 |
| 55 Carolina St | 0.30mi | 3/2.5 | 1,921 (+14%) | 2mo | $1,425,000 | $742 | 61 |
| 6 F St | 0.60mi | 3/2.5 | 1,553 (-8%) | 2mo | $815,000 | $525 | 58 |
| 152 Grove St | 0.74mi | 3/2.0 | 1,800 (+7%) | 0mo | $1,260,000 | $700 | 51 |
| 16 Cleveland St #300 | 0.65mi | 3/3.5 | 1,489 (-11%) | 2mo | $840,000 | $564 | 45 |
Match score weights: distance 35% · size 25% · config 20% · recency 20%. Top-matched comps best support the ARV.
Projected returns pro-forma
-3.0% appreciation · 4.58% rent growth · sell at horizon
- IRR
- -1.5%
- Equity multiple
- 0.94×
- Total profit
- $-6,146
- Equity at exit
- $55,914
- IRR
- 9.9%
- Equity multiple
- 1.82×
- Total profit
- $86,426
- Equity at exit
- $32,423
Cash invested: $105,000 (down + closing). Projections, not guarantees.
Landlord ↔ Tenant lean methodology
- Overall (STATE)
- 90 Strongly Landlord-Friendly
- State South Carolina
- 90 Strongly Landlord-Friendly · R+6
- County
- — inherits STATE
- City
- — inherits STATE
ZIP-level market 29403
- Rents YoY
- 4.6%
- Active inventory
- 147
- Price-to-rent
- 7.1×
Monthly cashflow live
- Estimated rent
- $4,410 high interval (Pro) →
- Mortgage (P&I)
- −$1,967
- Tax from tax record
- −$191 /mo · $2,290/yr
- Insurance
- −$156
- Flood insurance flood zone
- −$427 /mo · $5,118/yr
- HOA
- −$0
- Vacancy / Maint / Mgmt
- −$926
- Net cashflow
- $743
Break-even live
UW: 25.0% down · 7.5% · 30yr · 1.5% tax · 5.0% vac · 8.0% maint · 8.0% mgmt
Financing live
Cash to close
- Down payment
- $93,750
- Closing costs
- $11,250
- Reserves months
- —
- Total cash needed
- —
Loan-product check · same deal, 3 products live
Conventional
25% down · 7.5% · 30yr
- Down + closing
- —
- Monthly P&I
- —
- Monthly cashflow
- —
- DSCR
- —
- Eligible?
- —
Personal DTI + credit; lowest rate.
DSCR
20% down · 8.5% · 30yr
- Down + closing
- —
- Monthly P&I
- —
- Monthly cashflow
- —
- DSCR
- —
- Eligible?
- —
No personal income docs; deal must DSCR.
Hard money
10% down · 12.0% · 12mo
- Down + closing
- —
- Monthly P&I
- —
- Monthly cashflow
- —
- DSCR
- —
- Eligible?
- —
Short-term bridge; refi at stabilization.
Rent comps 40 comps
| Address | Beds | Baths | Sqft | Rent | $/sqft | DOM | Units | Dist |
|---|---|---|---|---|---|---|---|---|
| 16 Nats Ct Charleston, SC | 3.0 | 2.5 | 1400 | $4,875 | $3.48 | 14d | 1 | 0.15mi |
| 133 Bogard St Unit A Charleston, SC | 2.0 | 1.0 | 1100 | $3,200 | $2.91 | 3d | 1 | 0.22mi |
| 133 Bogard St Unit B Charleston, SC | 2.0 | 1.0 | 1100 | $2,950 | $2.68 | 24d | 1 | 0.22mi |
| 70 Carolina St Unit 301 Charleston, SC | 3.0 | 3.0 | 1415 | $5,400 | $3.82 | 24d | 1 | 0.23mi |
| 250 Rutledge Ave Unit B Charleston, SC | 3.0 | 2.0 | 1100 | $4,500 | $4.09 | 14d | 1 | 0.25mi |
| 9 Allway St Charleston, SC | 3.0 | 2.0 | 1109 | $2,700 | $2.43 | 14d | 1 | 0.27mi |
| 16 Porters Ct Charleston, SC | 3.0 | 2.0 | 1175 | $3,500 | $2.98 | 24d | 1 | 0.29mi |
| 25 Sires St Charleston, SC | 2.0 | 2.0 | 1060 | $4,900 | $4.62 | 24d | 1 | 0.32mi |
| 10 Sires St Charleston, SC | 2.0 | 2.5 | 1307 | $6,000 | $4.59 | 24d | 1 | 0.36mi |
| 21 Percy St Charleston, SC | 2.0 | 2.5 | 1614 | $6,500 | $4.03 | 24d | 1 | 0.38mi |
| 272 Coming St Unit C Charleston, SC | 3.0 | 3.5 | 1514 | $5,000 | $3.30 | 24d | 1 | 0.42mi |
| 3 Carrere Ct Charleston, SC | 3.0 | 2.5 | 1469 | $6,000 | $4.08 | 3d | 1 | 0.45mi |
| 9 Bogard St Apt C Charleston, SC | 3.0 | 2.5 | 1339 | $5,400 | $4.03 | 24d | 1 | 0.48mi |
| 10 Westedge St Charleston, SC | 2.0 | 1.0–2.0 | 980 | $5,058 | $5.16 | 3d | 28 | 0.52mi |
| 13 H St Charleston, SC | 3.0 | 2.5 | 1201 | $6,000 | $5.00 | 3d | 1 | 0.53mi |
| 40 H St Charleston, SC | 3.0 | 2.0 | 1317 | $3,930 | $2.98 | 14d | 1 | 0.55mi |
| 6 F St Charleston, SC | 3.0 | 2.5 | 1553 | $5,600 | $3.61 | 24d | 1 | 0.57mi |
| 6 Maverick St Charleston, SC | 4.0 | 2.0 | 1170 | $3,750 | $3.21 | 3d | 1 | 0.61mi |
| 45 Morris St Unit A Charleston, SC | 3.0 | 2.5 | 1449 | $5,300 | $3.66 | 3d | 1 | 0.61mi |
| 40 Line St Charleston, SC | 2.0 | 1.0–2.0 | 1032 | $10,465 | $10.14 | 3d | 79 | 0.66mi |
| 1000 King St Charleston, SC | 2.0–3.0 | 1.0–2.0 | 975 | $2,800 | $2.87 | 3d | 9 | 0.70mi |
| 28 Woolfe St Unit 1523766P Charleston, SC | 3.0 | 3.0 | 1356 | $3,326 | $2.45 | 14d | 1 | 0.73mi |
| 28 Woolfe St Unit 1523764P Charleston, SC | 4.0 | 4.0 | 1539 | $4,100 | $2.66 | 21d | 1 | 0.73mi |
| 441 Meeting St Charleston, SC | 2.0 | 1.0–2.0 | 993 | $4,013 | $4.04 | 3d | 13 | 0.74mi |
| 105 Cooper St Charleston, SC | 3.0 | 2.0 | 1056 | $2,750 | $2.60 | 24d | 1 | 0.75mi |
| 201 Nassau St Charleston, SC | 3.0 | 2.0 | 1188 | $3,800 | $3.20 | 3d | 1 | 0.76mi |
| 601 Meeting St Charleston, SC | 2.0 | 1.0–2.0 | 743 | $2,904 | $3.91 | 3d | 29 | 0.77mi |
| 78 Nassau St Charleston, SC | 3.0 | 2.0 | 1068 | $4,500 | $4.21 | 3d | 1 | 0.80mi |
| 18 Line St Unit C Charleston, SC | 3.0 | 2.0 | 1300 | $3,281 | $2.52 | 14d | 1 | 0.81mi |
| 16 Gordon St Charleston, SC | 3.0 | 1.5 | 1344 | $3,800 | $2.83 | 12d | 1 | 0.83mi |
| 73 Cooper St Charleston, SC | 3.0 | 3.0 | 1450 | $6,000 | $4.14 | 24d | 1 | 0.86mi |
| 110 Gordon St Charleston, SC | 2.0 | 1.5 | 1908 | $3,500 | $1.83 | 24d | 1 | 0.87mi |
| 61 Reid St Unit C Charleston, SC | 4.0 | 2.5 | 1654 | $6,000 | $3.63 | 21d | 1 | 0.88mi |
| 1 Piedmont Ave Charleston, SC | 3.0 | 3.0 | 1810 | $6,500 | $3.59 | 24d | 1 | 0.91mi |
| 75 Smith St Charleston, SC | 4.0 | 3.5 | 1836 | $11,000 | $5.99 | 3d | 1 | 0.93mi |
| 831 Rutledge Ave Charleston, SC | 2.0 | 2.0 | 1430 | $4,300 | $3.01 | 3d | 1 | 0.96mi |
| 87 Romney St Charleston, SC | 3.0 | 2.5 | 2038 | $3,695 | $1.81 | 24d | 1 | 0.97mi |
| 49 America St Charleston, SC | 4.0 | 2.0 | 2180 | $6,000 | $2.75 | 21d | 1 | 0.98mi |
| 24 Blake St Unit B Charleston, SC | 2.0 | 2.5 | 1200 | $3,200 | $2.67 | 24d | 1 | 0.99mi |
| 39 America St Unit A Charleston, SC | 3.0 | 1.0 | 1200 | $2,600 | $2.17 | 24d | 1 | 0.99mi |
Listing history 20 events
-
2026-06-18days on market $375,000 Active 435 DOM
-
2026-06-17days on market $375,000 Active 434 DOM
-
2026-06-16days on market $375,000 Active 433 DOM
-
2026-06-15remarks 699-char remark
-
2026-06-15days on market $375,000 Active 432 DOM
-
2026-06-10days on market $375,000 Active 427 DOM
-
2026-06-09days on market $375,000 Active 426 DOM
-
2026-06-08days on market $375,000 Active 425 DOM
-
2026-06-07days on market $375,000 Active 424 DOM
-
2026-06-05days on market $375,000 Active 421 DOM
-
2026-06-03days on market $375,000 Active 420 DOM
-
2026-06-01days on market $375,000 Active 418 DOM
-
2026-05-31days on market $375,000 Active 417 DOM
-
2025-10-22historical $6,000
-
2025-04-24$6,000
-
2025-04-09$375,000 Active
-
2024-12-16historical $6,000
-
2024-10-29$6,000
-
2015-09-24soldstatus $427,900
-
2014-09-12soldstatus $90,000
ⓘ Source: listings_history table (triggers on properties + properties_extension) + one-shot
backfill from property_details.listing_events for pre-trigger history.
Tax reassessment forecast SC · Resets to sale price
- Current annual tax
- $2,290 · $191/mo
- Projected year-2 tax
- $2,290 · $191/mo
- Expected delta
- $0/yr ($0/mo · 0.0%)
ⓘ Screening estimate from a state-policy table — verify with the county assessor before closing.
Climate risk First Street
- Flood 9/10 Extreme FEMA zone AE · 99% chance over 30 yrs
- Wildfire 3/10 Moderate
- Heat 10/10 Extreme 7 d/yr ≥105°F today · 18 d/yr by 30 yrs out
- Wind 9/10 Extreme 99% chance of damaging wind over 30 yrs
- Air quality 3/10 Moderate 3 unhealthy d/yr today · 3 by 30 yrs out
Nearby sold comps map
Loading sold comps map…
Walkable amenities ~0.75 mi
Loading nearby amenities…
Taxation est. · year 1
- Rental income
- $52,914
- − Mortgage interest
- −$21,006
- − Property taxes
- −$2,290
- − Insurance
- −$6,994
- − Repairs & maintenance
- −$4,233
- − Management
- −$4,233
- − Depreciation
- −$10,909
- Taxable income
- $3,249
- Est. tax owed @ 24.0%
- −$780
- After-tax cash flow
- $8,140/yr
For passive investors: Depreciation is non-cash, so a rental often shows a tax loss while cash-flowing — sheltering income. Rental losses are passive: they offset passive income freely, and up to $25,000/yr can offset ordinary (W-2) income if you actively participate and your MAGI is under $100k (phasing out to $0 by $150k); unused losses carry forward. On sale, claimed depreciation is recaptured at up to 25%, and gains may owe capital-gains tax (a 1031 exchange can defer both). Figures are a year-1 estimate at your 24.0% rate — not tax advice; consult a CPA.
Schools (NCES district)
- District
- Charleston 01
- NCES district ID
- 4501440
- Math proficiency
- 48% ▼ -2.00%
- Reading proficiency
- 53% ▬ 0.00%
- Median HH income
- $52,376
- Composite
- 43.41/100
- National rank
- #3018
- State rank
- #7 of 80 in SC
Livability — Charleston
- Score
- 76/100
- State rank
- #22
- US rank
- #3336
Category grades
Schools grade is shown separately in the Schools card above.
Census & demographics
- Census place
- Charleston, SC
- County
- Charleston County · 366,793 people
- City population
- 200,573
- Metro
- Charleston-North Charleston, SC
- Population (ZIP)
- 22,533
- Household income
- $66,944
- Rent vs Own
- Severe rent burden
- 2319.0
Population outlook (Charleston County) Hauer SSP2
- Today (2025)
- 480,562 people
- By 2030
- 525,921 · +9.4%
- By 2040
- 612,189 · +27.4%
- By 2050
- 691,627 · +43.9%
- By 2075
- 847,979 · +76.5%
- By 2100
- 926,482 · +92.8%
Race, ethnicity, and origin ACS 2023
- Neighborhood character
- Majority White (58%)
- Race & ethnicity
- White 58% Black 34% Hispanic / Latino 4% Two or more races 3% Asian 1%
- Common ancestry
- Slovak 2% Italian 2% Romanian 1%
- Foreign-born
- 3% · Canada, Dominican Republic, China
- Languages at home
- 96% English-only · Spanish 1% French/Haitian/Cajun 1% Other Indo-European 1%
Political lean MEDSL · Charleston
- 2024 margin
- Lean D (+5.7) · D 51.9% · R 46.3% · Other 1.8%
- 2008→2024 swing
- -2.7pp toward R · 2008: 8.3pp · 2024: 5.7pp
- All cycles
- 2024: D+5.7 2020: D+12.9 2016: D+7.9 2012: D+2.4 2008: D+8.3
Not yet ingested
- Civics
- —
Market trends
- HPI YoY
- ▼ -471.75%
- Current HPI
- 585.4871
- Rent YoY
- ▲ 4.58%
- Metro
- Charleston-North Charleston, SC
- State GDP YoY
- ▲ 4.51%
- F500 in state
- 2
Industry mix (Fortune 500 HQ in SC)
| Industry | F500 HQs | Revenue |
|---|---|---|
| Packaging | 1 | $7B |
|
||
Price history
-93.3% since first listed7 events — show timeline
- 2025-10-22 Rental Removed $6,000 CHARLESTONMLS
- 2025-04-24 Listed for Rent $6,000 CHARLESTONMLS
- 2025-04-09 Listed $375,000 Charleston Trident MLS
- 2024-12-16 Rental Removed $6,000 CHARLESTONMLS
- 2024-10-29 Listed for Rent $6,000 CHARLESTONMLS
- 2015-09-24 Sold (Public Records) $427,900 Public Records
- 2014-09-12 Sold (Public Records) $90,000 Public Records
Property tax history
+26.2%/yrLatest (2022): $2,290 · -4.9% YoY. Source: county tax records.
Cash-flow waterfall
monthlySold comps — $/sqft
last 12 mo · ≤1 miLoading sold comps…