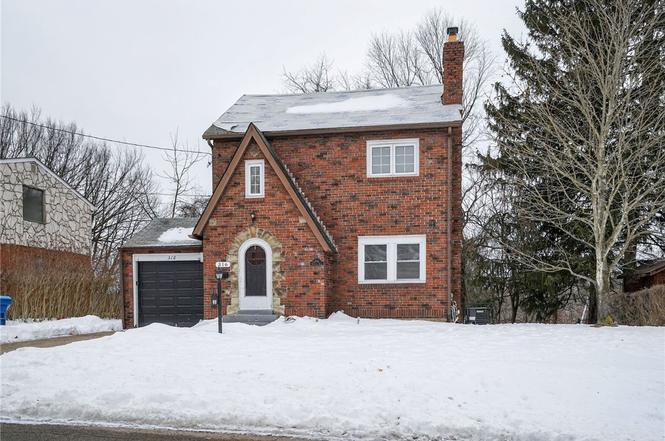
316 Highland Rd · Churchill, PA
Flood risk 1/10 · Minimal
- FEMA flood zone
- X (unshaded)
- Chance of flooding over 30 yrs
- 0.0%
- Est. flood insurance / yr
- $473 – $860
Fire risk 1/10 · Minimal
- Est. fire insurance / yr
- $511 – $949
Heat risk 3/10 · Minor
- Hot days now (above 96°F)
- 7 days/yr
- Hot days in 30 yrs
- 15 days/yr
Wind risk 2/10 · Minimal
- Chance of severe wind over 30 yrs
- —
Air-quality risk 4/10 · Minor
- Unhealthy air days now
- 5 days/yr
- Unhealthy air days in 30 yrs
- 7 days/yr
Risk factors via First Street. Map © Google.
Why this score? — see what drove the D grade
The composite is a weighted blend of 9 inputs, each scored 0–100. Each bar is that input's sub-score; the figure is the points it added to the 100-point composite (weight × sub-score).
- Cash flow +13.5/30.0
- ARV discount +6.5/15.0
- Rent growth +4.4/5.0
- 1% rule +4.3/10.0
- DSCR +4.1/10.0
- Livability +3.7/5.0
- Condition / age +2.5/5.0
- Schools +1.6/10.0
- Appreciation +0.0/10.0
$164,900
🖨 Deal sheet 📄 Offer letter ✓ Due diligence
Listing remarks MLS
Hardwood Floors Throughout This 3-Bedroom 2-Story. So Many Possibilities For This One. Level Lot, Side Yard Is Lovely! House being sold "as-is. "
Key facts
- Brick tudor style
- Bright kitchen
- Large dining room
Tags
Neighborhood map
What this means for you Summary
Snapshot
- This is a 3-bed/1.0-bath single-family listed at $165k.
Deal economics
- At list price, monthly cash flow is $6 ($74/yr) — positive.
- The deal already cash-flows at list — no discount required.
- To meet the 1% rule (rent ≥ 1% of price), the offer needs to be $153k (7.1% below list).
- Recommended offer: $153k (7.1% below list) — sets the bar for 1% rule.
- Cap rate 6.3% vs local median 2.6% in Churchill — top-decile yield for the area; either an underpriced asset or a hidden risk that comps aren't pricing in. Stress-test before assuming the spread holds.
Location & tenants
- Location reads 74/100 on livability (#486 in PA, #4,477 nationally) — a middle-class / working-renter tenant base. Strengths: crime A+, employment A+, housing A+; Watch: health & safety D, amenities F, commute F.
- Penn Hills SD (suburban): math 13% / reading 24% proficiency, ranked #496 of 539 in PA (top 92%) — low school quality limits family demand, transient renter base, plan for 1-2y turnover.
- Market conditions: Rents rising fast (+7.6%/yr); 129 active listings in the ZIP; 23 comparable units currently listed for rent nearby; rentals at typical pace (median 15d on market — plan ~3-4 weeks tenant-placement turnaround); 2,996 units permitted in Allegheny County in 2024 (1,588 in 5+ unit buildings).
Forward outlook
- Local home prices are declining (-3.0%/yr); year-one equity from $1k of loan paydown is wiped out by about $5k of value loss. Plan a longer hold.
Negotiation context
- It's been on market 19 days — a 2% lower offer ($162k) is reasonable based on typical stale-listing flexibility.
- 7 sale attempts since 31y ago with the ask held roughly flat each time — persistent listings suggest the price (not the market) is what's stuck; bring a comps-based counter.
- Current owner paid $80k; list at $165k implies a 106% gain — meaningful room to come down on a strong offer.
Risks & watch-outs
- Watch-outs: built in 1940 — expect roof / HVAC / electrical / plumbing capex.
Questions for the listing agent
- Built in 1940 — when were the roof, HVAC, electrical panel, plumbing, and water heater last replaced?
- Is there a deadline driving the sale (1031 exchange, divorce, estate, relocation)? That informs how much negotiation room exists.
- Schools are B-rated — typically a magnet for longer-tenancy family renters. What's the average tenant stay here, and is there a school-zone premium baked into asking?
- The area grade is low — what's the realistic commute time and amenity access for the typical tenant pool here? Any planned neighborhood developments (good or bad) we should know about?
- What's the average days-on-market for RENTAL listings here right now (not sales)? A rising rental-DOM trend means longer vacancies and softer asking-rent achievability than the comps imply.
- What's the recent tenant-quality profile in this submarket — average credit score on applications, eviction rate, late-payment / NSF rate, and stable-employment percentage? A property-management company in the area should have these aggregated.
- How much new for-sale + rental construction is in the pipeline within 1–3 miles? Heavy new supply typically softens prices + rents 12–24 months out; constrained supply supports both.
Investment metrics
- 1% rule
- 0.93% ✗
- Cap rate
- 6.34%
- Cash-on-cash
- 0.16%
- DSCR
- 1.01
- GRM
- 9.0
CMA / ARV
- ARV (on-the-fly)
- $161,188
- Comps found
- 12
Show comp detail 12 sales within ~0.75 mi
| Address | Dist | Beds/Ba | Sqft | Sold | Price | $/sf | Match |
|---|---|---|---|---|---|---|---|
| 332 Highland Rd | 0.03mi | 3/2.0 | 1,400 (+2%) | 3mo | $208,000 | $149 | 88 |
| 111 Dauntless Dr | 0.03mi | 2/2.0 (-1) | 1,340 (-2%) | 2mo | $217,000 | $162 | 85 |
| 11522 Clematis Blvd | 0.32mi | 3/1.0 | 1,480 (+8%) | 5mo | $165,000 | $111 | 67 |
| 327 Macfarlane Dr | 0.41mi | 2/1.5 (-1) | 1,288 (-6%) | 3mo | $151,450 | $118 | 62 |
| 202 Duffield Ave | 0.61mi | 2/1.5 (-1) | 1,350 (-1%) | 2mo | $145,000 | $107 | 61 |
| 11534 Clematis Blvd | 0.31mi | 4/2.5 (+1) | 1,461 (+7%) | 4mo | $260,000 | $178 | 59 |
| 418 Pennwood Dr | 0.37mi | 3/1.5 | 1,197 (-12%) | 3mo | $115,000 | $96 | 58 |
| 11403 Clematis Blvd | 0.33mi | 2/1.0 (-1) | 1,209 (-12%) | 6mo | $184,000 | $152 | 56 |
| 2 Beulah Ln | 0.71mi | 2/1.5 (-1) | 1,348 (-1%) | 3mo | $125,000 | $93 | 55 |
| 524 Macfarlane Dr | 0.57mi | 3/2.5 | 1,275 (-7%) | 2mo | $205,000 | $161 | 54 |
| 11505 Clematis Blvd | 0.31mi | 3/2.0 | 1,552 (+14%) | 6mo | $172,000 | $111 | 53 |
| 416 Penn Vista Dr | 0.53mi | 3/1.0 | 1,163 (-15%) | 2mo | $115,000 | $99 | 49 |
Match score weights: distance 35% · size 25% · config 20% · recency 20%. Top-matched comps best support the ARV.
Projected returns pro-forma
-3.0% appreciation · 7.63% rent growth · sell at horizon
- IRR
- -10.7%
- Equity multiple
- 0.59×
- Total profit
- $-18,799
- Equity at exit
- $24,587
- IRR
- 4.4%
- Equity multiple
- 1.39×
- Total profit
- $18,118
- Equity at exit
- $14,258
Cash invested: $46,172 (down + closing). Projections, not guarantees.
Landlord ↔ Tenant lean methodology
- Overall (STATE)
- 62 Landlord-Friendly
- State Pennsylvania
- 62 Landlord-Friendly · EVEN
- County
- — inherits STATE
- City
- — inherits STATE
ZIP-level market 15235
- Home prices YoY
- -34.1%
- Rents YoY
- 7.6%
- Active inventory
- 129
- Price-to-rent
- 9.0×
Monthly cashflow live
- Estimated rent
- $1,532 high interval (Pro) →
- Mortgage (P&I)
- −$865
- Tax from tax record
- −$271 /mo · $3,247/yr
- Insurance
- −$69
- HOA
- −$0
- Vacancy / Maint / Mgmt
- −$322
- Net cashflow
- $6
Break-even live
UW: 25.0% down · 7.5% · 30yr · 1.5% tax · 5.0% vac · 8.0% maint · 8.0% mgmt
Financing live
Cash to close
- Down payment
- $41,225
- Closing costs
- $4,947
- Reserves months
- —
- Total cash needed
- —
Loan-product check · same deal, 3 products live
Conventional
25% down · 7.5% · 30yr
- Down + closing
- —
- Monthly P&I
- —
- Monthly cashflow
- —
- DSCR
- —
- Eligible?
- —
Personal DTI + credit; lowest rate.
DSCR
20% down · 8.5% · 30yr
- Down + closing
- —
- Monthly P&I
- —
- Monthly cashflow
- —
- DSCR
- —
- Eligible?
- —
No personal income docs; deal must DSCR.
Hard money
10% down · 12.0% · 12mo
- Down + closing
- —
- Monthly P&I
- —
- Monthly cashflow
- —
- DSCR
- —
- Eligible?
- —
Short-term bridge; refi at stabilization.
Rent comps 23 comps
| Address | Beds | Baths | Sqft | Rent | $/sqft | DOM | Units | Dist |
|---|---|---|---|---|---|---|---|---|
| 124 Dauntless Dr Pittsburgh, PA | 3.0 | 1.0 | 1100 | $1,395 | $1.27 | 24d | 1 | 0.08mi |
| 131 Jacob Dr Pittsburgh, PA | 3.0 | 1.0 | 1144 | $2,300 | $2.01 | 2d | 1 | 0.34mi |
| 62 Melvin Ct Penn Hills Township, PA | 1.0–2.0 | 1.0 | 825 | $1,549 | $1.88 | 8d | 2 | 0.37mi |
| 11843 Joan Dr Pittsburgh, PA | 3.0 | 1.0 | 1144 | $1,500 | $1.31 | 4d | 1 | 0.38mi |
| 314 Penn Vista Dr Pittsburgh, PA | 2.0 | 1.0 | 1150 | $1,250 | $1.09 | 44d | 1 | 0.46mi |
| 457 Elias Dr #445 Pittsburgh, PA | 2.0 | 1.0 | 888 | $1,200 | $1.35 | 17d | 1 | 0.48mi |
| 641 Penny Dr Pittsburgh, PA | 3.0 | 1.5 | 1199 | $1,525 | $1.27 | 15d | 1 | 0.56mi |
| 610 Churchill Ave Pittsburgh, PA | 3.0 | 1.0 | 1100 | $1,395 | $1.27 | 2d | 1 | 0.77mi |
| 3005 Laketon Rd Pittsburgh, PA | 3.0 | 1.0 | 1100 | $1,295 | $1.18 | 15d | 1 | 0.80mi |
| 648 Southern Ave Penn Hills, PA | 3.0 | 1.0 | 1100 | $1,600 | $1.45 | 8d | 1 | 0.87mi |
| 10135 Pearl Rd Pittsburgh, PA | 3.0 | 2.0 | 1163 | $1,450 | $1.25 | 24d | 1 | 0.89mi |
| 150 Marshall Dr Pittsburgh, PA | 3.0 | 1.5 | 923 | $1,450 | $1.57 | 24d | 1 | 0.93mi |
| 209 Briarwood Dr Pittsburgh, PA | 3.0 | 2.0 | 1080 | $1,500 | $1.39 | 24d | 1 | 0.98mi |
| 185 Howard St Pittsburgh, PA | 2.0 | 1.0 | 1000 | $1,250 | $1.25 | 44d | 1 | 0.99mi |
| 261 Universal Rd Unit 261UNIV Pittsburgh, PA | 3.0 | 1.0 | 1100 | $1,225 | $1.11 | 3d | 1 | 1.01mi |
| 127 Stowe Dr Pittsburgh, PA | 3.0 | 1.0 | 948 | $1,495 | $1.58 | 21d | 1 | 1.01mi |
| 325 Poe Dr Pittsburgh, PA | 2.0 | 1.0 | 1056 | $1,599 | $1.51 | 44d | 1 | 1.04mi |
| 1526 Edwards St Verona, PA | 3.0 | 1.0 | 1296 | $1,730 | $1.33 | 44d | 1 | 1.16mi |
| 717 Jefferson Rd Pittsburgh, PA | 3.0 | 1.0 | 1152 | $1,295 | $1.12 | 15d | 1 | 1.19mi |
| 753 Jefferson Rd Pittsburgh, PA | 4.0 | 1.0 | 1152 | $1,350 | $1.17 | 4d | 1 | 1.25mi |
| 154 Collins Dr Pittsburgh, PA | 3.0 | 1.0 | 986 | $1,295 | $1.31 | 2d | 1 | 1.30mi |
| 1426 Homestead Rd Unit 3 Verona, PA | 3.0 | 1.0 | 1000 | $1,499 | $1.50 | 12d | 1 | 1.42mi |
| 279 Hazel Rd Pittsburgh, PA | 3.0 | 1.0 | 1080 | $1,732 | $1.60 | 44d | 1 | 1.49mi |
Listing history 21 events
-
2026-03-11status Pending
-
2026-02-20$164,900 Active
-
2020-10-05soldstatus $80,000
-
2020-09-28soldstatus $80,000 Closed 156-char remark
Show marketing remark (156 chars)
Hardwood Floors Throughout This 3-Bedroom 2-Story. So Many Possibilities For This One. Level Lot, Side Yard Is Lovely! House being sold "as-is. "
-
2020-09-02status Pending 156-char remark
Show marketing remark (156 chars)
Hardwood Floors Throughout This 3-Bedroom 2-Story. So Many Possibilities For This One. Level Lot, Side Yard Is Lovely! House being sold "as-is. "
-
2020-08-26status Active 156-char remark
Show marketing remark (156 chars)
Hardwood Floors Throughout This 3-Bedroom 2-Story. So Many Possibilities For This One. Level Lot, Side Yard Is Lovely! House being sold "as-is. "
-
2020-08-22historical Contingent 156-char remark
Show marketing remark (156 chars)
Hardwood Floors Throughout This 3-Bedroom 2-Story. So Many Possibilities For This One. Level Lot, Side Yard Is Lovely! House being sold "as-is. "
-
2020-08-19$89,900 Active 156-char remark
Show marketing remark (156 chars)
Hardwood Floors Throughout This 3-Bedroom 2-Story. So Many Possibilities For This One. Level Lot, Side Yard Is Lovely! House being sold "as-is. "
-
2018-08-30historical Withdrawn 131-char remark
Show marketing remark (131 chars)
SOLID BRICK TUDOR HOME WITH GREAT POTENTIAL THAT NEEDS A LOT OF TLC. GREAT FIXER UPPER FOR FIRST TIME HOME BUYERS AND/OR INVESTORS
-
2018-04-23historical Contingent 131-char remark
Show marketing remark (131 chars)
SOLID BRICK TUDOR HOME WITH GREAT POTENTIAL THAT NEEDS A LOT OF TLC. GREAT FIXER UPPER FOR FIRST TIME HOME BUYERS AND/OR INVESTORS
-
2018-03-15price $45,000 131-char remark
Show marketing remark (131 chars)
SOLID BRICK TUDOR HOME WITH GREAT POTENTIAL THAT NEEDS A LOT OF TLC. GREAT FIXER UPPER FOR FIRST TIME HOME BUYERS AND/OR INVESTORS
-
2018-02-16$65,000 Active 131-char remark
Show marketing remark (131 chars)
SOLID BRICK TUDOR HOME WITH GREAT POTENTIAL THAT NEEDS A LOT OF TLC. GREAT FIXER UPPER FOR FIRST TIME HOME BUYERS AND/OR INVESTORS
-
2007-08-20soldstatus $49,000
-
2007-04-24$49,900
-
2002-06-24soldstatus $92,500
-
2002-06-20soldstatus $92,500
-
2002-03-19$92,500
-
1996-04-30soldstatus $71,500
-
1996-04-26soldstatus $71,500
-
1995-10-01$74,900
-
1987-05-01soldstatus $55,000
ⓘ Source: listings_history table (triggers on properties + properties_extension) + one-shot
backfill from property_details.listing_events for pre-trigger history.
Tax reassessment forecast PA · Partial reset (capped growth)
- Current annual tax
- $3,247 · $271/mo
- Projected year-2 tax
- $3,247 · $271/mo
- Expected delta
- $0/yr ($0/mo · 0.0%)
ⓘ Screening estimate from a state-policy table — verify with the county assessor before closing.
Climate risk First Street
- Flood 1/10 Low FEMA zone X (unshaded) · 0% chance over 30 yrs
- Wildfire 1/10 Low
- Heat 3/10 Moderate 7 d/yr ≥96°F today · 15 d/yr by 30 yrs out
- Wind 2/10 Low
- Air quality 4/10 Moderate 5 unhealthy d/yr today · 7 by 30 yrs out
Nearby sold comps map
Loading sold comps map…
Walkable amenities ~0.75 mi
Loading nearby amenities…
Taxation est. · year 1
- Rental income
- $18,382
- − Mortgage interest
- −$9,237
- − Property taxes
- −$3,247
- − Insurance
- −$824
- − Repairs & maintenance
- −$1,471
- − Management
- −$1,471
- − Depreciation
- −$4,797
- Taxable loss
- −$2,664
- Est. tax savings @ 24.0%
- +$639
- After-tax cash flow
- $713/yr
For passive investors: Depreciation is non-cash, so a rental often shows a tax loss while cash-flowing — sheltering income. Rental losses are passive: they offset passive income freely, and up to $25,000/yr can offset ordinary (W-2) income if you actively participate and your MAGI is under $100k (phasing out to $0 by $150k); unused losses carry forward. On sale, claimed depreciation is recaptured at up to 25%, and gains may owe capital-gains tax (a 1031 exchange can defer both). Figures are a year-1 estimate at your 24.0% rate — not tax advice; consult a CPA.
Schools (NCES district)
- District
- Penn Hills SD
- NCES district ID
- 4218590
- Math proficiency
- 13% ▼ -6.00%
- Reading proficiency
- 24% ▼ -14.00%
- Median HH income
- $47,794
- Composite
- 16.42/100
- National rank
- #9192
- State rank
- #496 of 539 in PA
Livability — Churchill
- Score
- 74/100
- State rank
- #486
- US rank
- #4477
Category grades
Schools grade is shown separately in the Schools card above.
Census & demographics
- County
- Allegheny County · 1,022,028 people
- Metro
- Pittsburgh, PA
- Population (ZIP)
- 33,951
- Household income
- $67,240
- Rent vs Own
- Severe rent burden
- 955.0
Population outlook (Allegheny County) Hauer SSP2
- Today (2025)
- 1,250,282 people
- By 2030
- 1,256,482 · +0.5%
- By 2040
- 1,256,318 · +0.5%
- By 2050
- 1,244,169 · -0.5%
- By 2075
- 1,197,693 · -4.2%
- By 2100
- 1,093,187 · -12.6%
Race, ethnicity, and origin ACS 2023
- Neighborhood character
- Diverse neighborhood (Simpson 0.58)
- Race & ethnicity
- White 51% Black 40% Two or more races 7% Hispanic / Latino 2%
- Common ancestry
- Romanian 5% Serbian 2% Slovak 1%
- Foreign-born
- 4% · Canada
- Languages at home
- 97% English-only · Other Indo-European 1% Spanish 1%
Political lean MEDSL · Allegheny
- 2024 margin
- Strong D (+20.3) · D 59.7% · R 39.4%
- 2008→2024 swing
- +4.8pp toward D · 2008: 15.5pp · 2024: 20.3pp
- All cycles
- 2024: D+20.3 2020: D+20.4 2016: D+16.4 2012: D+14.4 2008: D+15.5
Not yet ingested
- Civics
- —
Market trends
- HPI YoY
- ▼ -121.68%
- Current HPI
- 235.4861
- Rent YoY
- ▲ 7.63%
- Metro
- Pittsburgh, PA
- State GDP YoY
- ▲ 1.68%
- F500 in state
- 34
Industry mix (Fortune 500 HQ in PA)
| Industry | F500 HQs | Revenue |
|---|---|---|
| Healthcare | 2 | $309B |
|
||
| Insurance | 2 | $27B |
|
||
| Telecommunications / Media | 1 | $124B |
|
||
| Industrial Distribution | 1 | $22B |
|
||
| Financial Services | 1 | $20B |
|
||
| Chemicals / Materials | 1 | $18B |
|
||
Price history
+199.8% since first listed21 events — show timeline
- 2026-03-11 Pending — West Penn MLS
- 2026-02-20 Listed $164,900 West Penn MLS
- 2020-10-05 Sold (Public Records) $80,000 Public Records
- 2020-09-28 Sold (MLS) $80,000 West Penn MLS
- 2020-09-02 Pending — West Penn MLS
- 2020-08-26 Relisted — West Penn MLS
- 2020-08-22 Contingent — West Penn MLS
- 2020-08-19 Listed $89,900 West Penn MLS
- 2018-08-30 Delisted — West Penn MLS
- 2018-04-23 Contingent — West Penn MLS
- 2018-03-15 Price Changed $45,000 West Penn MLS
- 2018-02-16 Listed $65,000 West Penn MLS
- 2007-08-20 Sold (MLS) $49,000 West Penn MLS
- 2007-04-24 Listed $49,900 West Penn MLS
- 2002-06-24 Sold (Public Records) $92,500 Public Records
- 2002-06-20 Sold (MLS) $92,500 West Penn MLS
- 2002-03-19 Listed $92,500 West Penn MLS
- 1996-04-30 Sold (Public Records) $71,500 Public Records
- 1996-04-26 Sold (MLS) $71,500 West Penn MLS
- 1995-10-01 Listed $74,900 West Penn MLS
- 1987-05-01 Sold (Public Records) $55,000 Public Records
Property tax history
+2.5%/yrLatest (2026): $3,247 · +0.0% YoY. Source: county tax records.
Cash-flow waterfall
monthlySold comps — $/sqft
last 12 mo · ≤1 miLoading sold comps…