3134 Wilkens Ave · Baltimore, MD
Flood risk 1/10 · Minimal
- FEMA flood zone
- X (unshaded)
- Chance of flooding over 30 yrs
- 0.0%
- Est. flood insurance / yr
- $473 – $860
Fire risk 1/10 · Minimal
- Est. fire insurance / yr
- $755 – $1,403
Heat risk 7/10 · Major
- Hot days now (above 103°F)
- 7 days/yr
- Hot days in 30 yrs
- 15 days/yr
Wind risk 6/10 · Moderate
- Chance of severe wind over 30 yrs
- 27.0%
Air-quality risk 3/10 · Minor
- Unhealthy air days now
- 3 days/yr
- Unhealthy air days in 30 yrs
- 4 days/yr
Risk factors via First Street. Map © Google.
Why this score? — see what drove the C grade
The composite is a weighted blend of 9 inputs, each scored 0–100. Each bar is that input's sub-score; the figure is the points it added to the 100-point composite (weight × sub-score).
- Cash flow +29.8/30.0
- DSCR +10.0/10.0
- 1% rule +8.3/10.0
- Rent growth +4.4/5.0
- Livability +3.8/5.0
- Condition / age +2.5/5.0
- Schools +1.0/10.0
- ARV discount +0.0/15.0
- Appreciation +0.0/10.0
$124,900
🖨 Deal sheet (PDF) 📄 Offer letter ✓ Due diligence
Listing remarks MLS
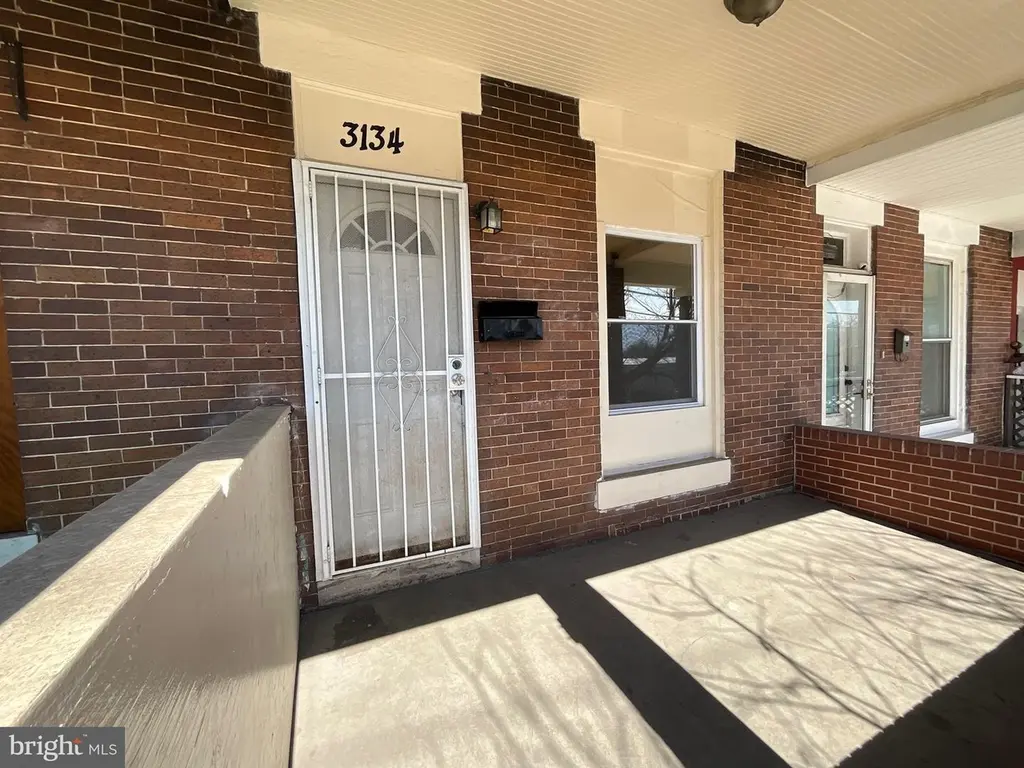
Hurry—this one won’t last! This move-in ready, spacious 3-bedroom, 1-bath townhome is the opportunity you’ve been waiting for. Step on the covered front porch, and into a home featuring updated flooring and a welcoming layout. The kitchen is equipped with stainless steel appliances, and the convenience of a main-level washer and dryer. The unfinished basement offers incredible potential—ready to be transformed into additional living space, a home office, or recreation area—adding both functionality and future value. Whether you're a first-time buyer or a savvy investor, this home checks all the boxes for comfort, value, and opportunity. Schedule your tour today!
Key facts
- Covered front porch
- Unfinished basement
- Updated flooring
Tags
Neighborhood map
What this means for you Summary
Snapshot
- This is a 3-bed/1.0-bath townhouse listed at $125k.
Deal economics
- At list price, monthly cash flow is $460 ($6k/yr) — positive.
- The deal already cash-flows at list — no discount required.
- Meets the 1% rule at list price ($2k rent vs $125k).
- Recommended offer: $117k (6.0% below list) — sets the bar for market timing.
Location & tenants
- Location reads 76/100 on livability (#90 in MD, #3,396 nationally) — a middle-class / working-renter tenant base. Strengths: amenities A+, commute A+, housing A+; Watch: crime F.
- Baltimore City Public Schools (urban): math 7% / reading 16% proficiency, ranked #24 of 24 in MD (top 100%) — low school quality limits family demand, transient renter base, plan for 1-2y turnover; 79% free/reduced lunch — lower-income household profile, screen leases tightly.
- Zoned schools: Elmer A. Henderson: A Johns Hopkins Partnership (math 2% / reading 16%, grade F, #650 of 860 statewide, top 77%, 642 students, 80% FRL); Baltimore Polytechnic Institute (math 71% / reading 84%, grade A-, #22 of 222 statewide, top 10%, 1,555 students, 43% FRL) — zoned schools average 62% FRL vs 79% district-wide (17 pts lower); this property's tenant base skews higher-income than the district average.
- Zoned-school proficiency averages 43% at this address vs 12% district-wide (+32 pts) — the actual schools serving this property are materially stronger than the Baltimore City Public Schools average implies; a family-tenant draw the district grade alone would hide.
- Market conditions: Rents rising fast (+7.5%/yr); 425 active listings in the ZIP; 40 comparable units currently listed for rent nearby; rentals at typical pace (median 26d on market — plan ~3-4 weeks tenant-placement turnaround); 1,273 units permitted in Baltimore city in 2024 (1,104 in 5+ unit buildings).
Forward outlook
- Local home prices are declining (-3.0%/yr); year-one equity from $864 of loan paydown is wiped out by about $4k of value loss. Plan a longer hold.
- Baltimore County population projected to shrink 4% by 2050 — rents likely to lag national; underwrite the cash flow, not the appreciation.
- At projected returns (-3.0% appreciation + 7.5% rent growth), your $35k cash investment doubles in ~6 years — after that, you're playing with house money.
Negotiation context
- It's been on market 88 days — a 6% lower offer ($117k) is reasonable based on typical stale-listing flexibility.
- 5 sale attempts since 12y ago with the ask held roughly flat each time — persistent listings suggest the price (not the market) is what's stuck; bring a comps-based counter.
- Current owner paid $60k; list at $125k implies a 108% gain — meaningful room to come down on a strong offer.
Risks & watch-outs
- Watch-outs: built in 1920 — expect roof / HVAC / electrical / plumbing capex.
- Climate carrying-cost: major wind risk, 27% chance of damaging wind over 30y; extreme-heat days projected 7→15/yr by 2055 (HVAC capex compounding) — expect insurance premiums to compound above CPI over the hold.
Questions for the listing agent
- It's been on market 88 days. Have you received any prior offers? Is the seller open to a 6% concession, seller financing, or rate buy-down credit?
- Built in 1920 — when were the roof, HVAC, electrical panel, plumbing, and water heater last replaced?
- Why hasn't it sold? Are there any deal-killer items the seller is aware of (foundation, flood, title, zoning, code violations)?
- Is there a deadline driving the sale (1031 exchange, divorce, estate, relocation)? That informs how much negotiation room exists.
- Schools are D-rated, which usually means shorter tenancies and higher turnover. Who's the typical renter profile here, and what's been the actual vacancy rate?
- Crime grade is F in this area — have there been break-ins, vandalism, or insurance claims at this property in the last 3 years? What carrier currently insures it and at what premium?
- What's the average days-on-market for RENTAL listings here right now (not sales)? A rising rental-DOM trend means longer vacancies and softer asking-rent achievability than the comps imply.
- What's the recent tenant-quality profile in this submarket — average credit score on applications, eviction rate, late-payment / NSF rate, and stable-employment percentage? A property-management company in the area should have these aggregated.
- How much new for-sale + rental construction is in the pipeline within 1–3 miles? Heavy new supply typically softens prices + rents 12–24 months out; constrained supply supports both.
Investment metrics
- 1% rule
- 1.33% ✓
- Cap rate
- 10.71%
- Cash-on-cash
- 15.78%
- DSCR
- 1.70
- GRM
- 6.3
CMA / ARV
- ARV (median comp)
- $93,647
- List price
- $124,900
- Delta
- 33.37%
- Verdict
- OVERPRICED
- Comps
- 20 within 1.0 mi
Show comp detail 12 sales within ~0.75 mi
| Address | Dist | Beds/Ba | Sqft | Sold | Price | $/sf | Match |
|---|---|---|---|---|---|---|---|
| 1052 Parksley Ave | 0.29mi | 2/1.0 (-1) | 1,050 (-2%) | 4mo | $110,000 | $105 | 75 |
| 3396 Dulany St | 0.41mi | 2/1.5 (-1) | 1,080 (+1%) | 0mo | $177,523 | $164 | 72 |
| 3549 Benzinger Rd | 0.68mi | 2/1.5 (-1) | 1,050 (-2%) | 0mo | $192,800 | $184 | 58 |
| 3547 Benzinger Rd | 0.68mi | 2/1.5 (-1) | 1,050 (-2%) | 1mo | $199,900 | $190 | 57 |
| 1023 Rockhill Ave | 0.66mi | 3/1.0 | 992 (-8%) | 0mo | $220,000 | $222 | 57 |
| 3517 Wilkens Ave | 0.60mi | 2/2.0 (-1) | 1,050 (-2%) | 4mo | $215,000 | $205 | 56 |
| 3507 Greenvale Rd | 0.73mi | 3/2.0 | 1,024 (-4%) | 0mo | $241,000 | $235 | 54 |
| 3579 Benzinger Rd | 0.73mi | 2/1.5 (-1) | 1,050 (-2%) | 3mo | $189,000 | $180 | 53 |
| 2637 Dulany St | 0.59mi | 3/1.0 | 972 (-9%) | 6mo | $35,000 | $36 | 52 |
| 2737 Wilkens Ave | 0.43mi | 3/1.0 | 1,232 (+15%) | 4mo | $53,000 | $43 | 51 |
| 3542 Benzinger Rd | 0.67mi | 2/2.0 (-1) | 999 (-7%) | 1mo | $198,000 | $198 | 48 |
| 2642 Wilkens Ave | 0.57mi | 2/1.5 (-1) | 1,174 (+10%) | 4mo | $51,000 | $43 | 47 |
Match score weights: distance 35% · size 25% · config 20% · recency 20%. Top-matched comps best support the ARV.
Projected returns pro-forma
-3.0% appreciation · 7.51% rent growth · sell at horizon
- IRR
- 11.6%
- Equity multiple
- 1.48×
- Total profit
- $16,936
- Equity at exit
- $18,623
- IRR
- 23.9%
- Equity multiple
- 3.52×
- Total profit
- $88,000
- Equity at exit
- $10,799
Cash invested: $34,972 (down + closing). Projections, not guarantees.
Landlord ↔ Tenant lean methodology
- Overall (CITY)
- 12 Strongly Tenant-Friendly
- State Maryland
- 27 Tenant-Leaning · D+14
- County
- — inherits STATE
- City Baltimore
- 12 Strongly Tenant-Friendly · D+58
ZIP-level market 21223
- Rents YoY
- 7.5%
- Active inventory
- 425
- Price-to-rent
- 6.3×
Monthly cashflow live
- Estimated rent
- $1,660 high interval (Pro) →
- Mortgage (P&I)
- −$655
- Tax from tax record
- −$145 /mo · $1,736/yr
- Insurance
- −$52
- HOA
- −$0
- Vacancy / Maint / Mgmt
- −$349
- Net cashflow
- $460
Break-even live
Sensitivity live
| Price | -10% $530 | -5% $495 | +0% $460 | +5% $424 | +10% $389 |
|---|---|---|---|---|---|
| Rent | -10% $329 | -5% $394 | +0% $460 | +5% $525 | +10% $591 |
| Rate | -1.0pp $523 | -0.5pp $492 | base $460 | +0.5pp $427 | +1.0pp $394 |
UW: 25.0% down · 7.5% · 30yr · 1.5% tax · 5.0% vac · 8.0% maint · 8.0% mgmt
Financing live
Cash to close
- Down payment
- $31,225
- Closing costs
- $3,747
- Reserves months
- —
- Total cash needed
- —
Loan-product check · same deal, 3 products live
Conventional
25% down · 7.5% · 30yr
- Down + closing
- —
- Monthly P&I
- —
- Monthly cashflow
- —
- DSCR
- —
- Eligible?
- —
Personal DTI + credit; lowest rate.
DSCR
20% down · 8.5% · 30yr
- Down + closing
- —
- Monthly P&I
- —
- Monthly cashflow
- —
- DSCR
- —
- Eligible?
- —
No personal income docs; deal must DSCR.
Hard money
10% down · 12.0% · 12mo
- Down + closing
- —
- Monthly P&I
- —
- Monthly cashflow
- —
- DSCR
- —
- Eligible?
- —
Short-term bridge; refi at stabilization.
Rent comps 40 comps
| Address | Beds | Baths | Sqft | Rent | $/sqft | DOM | Units | Dist |
|---|---|---|---|---|---|---|---|---|
| 3130 Stafford St Baltimore, MD | 3.0 | 1.0 | 1200 | $1,500 | $1.25 | 22d | 1 | 0.33mi |
| 3392 Saint Benedict St Baltimore, MD | 2.0 | 1.0 | 864 | $1,450 | $1.68 | 25d | 1 | 0.40mi |
| 2737 Wilkens Ave Baltimore, MD | 3.0 | 1.5 | 1232 | $1,650 | $1.34 | 6d | 1 | 0.43mi |
| 2738 Wilkens Ave Baltimore, MD | 3.0 | 1.0 | 1183 | $1,500 | $1.27 | 45d | 1 | 0.44mi |
| 2671 Saint Benedict St Baltimore, MD | 2.0 | 1.0 | 1144 | $1,325 | $1.16 | 45d | 1 | 0.55mi |
| 2657 Lehman St Unit 1 Baltimore, MD | 2.0 | 1.0 | 1056 | $1,000 | $0.95 | 45d | 1 | 0.58mi |
| 2509 Christian St Baltimore, MD | 4.0 | 2.0 | 1248 | $1,699 | $1.36 | 5d | 1 | 0.72mi |
| 2514 Wilkens Ave Baltimore, MD | 4.0 | 1.0 | 1344 | $1,800 | $1.34 | 12d | 1 | 0.73mi |
| 2514 Wilkens Ave Baltimore, MD | 4.0 | 1.0 | 1344 | $1,800 | $1.34 | 45d | 1 | 0.73mi |
| 332 S Franklintown Rd Unit 2 Baltimore, MD | 2.0 | 1.0 | 776 | $795 | $1.02 | 25d | 1 | 0.74mi |
| 2540 Frederick Ave Baltimore, MD | 3.0 | 1.0 | 1075 | $1,400 | $1.30 | 25d | 1 | 0.77mi |
| 3336 W Caton Ave Baltimore, MD | 3.0 | 2.0 | 1236 | $1,625 | $1.31 | 25d | 1 | 0.84mi |
| 1706 Harman Ave Baltimore, MD | 3.0 | 1.0 | 1056 | $1,600 | $1.52 | 0d | 1 | 0.87mi |
| 3310 Elbert St Baltimore, MD | 2.0 | 1.0 | 920 | $1,550 | $1.68 | 25d | 1 | 0.90mi |
| 110 S Catherine St Unit 1 Baltimore, MD | 2.0 | 1.0 | 1330 | $1,500 | $1.13 | 45d | 1 | 0.91mi |
| 2537 Hollins St Baltimore, MD | 3.0 | 2.0 | 1200 | $1,450 | $1.21 | 25d | 1 | 0.95mi |
| 41 N Kossuth St Baltimore, MD | 3.0 | 2.0 | 1216 | $1,800 | $1.48 | 25d | 1 | 0.98mi |
| 2516 Hollins St Baltimore, MD | 3.0 | 2.0 | 1100 | $1,700 | $1.55 | 45d | 1 | 0.98mi |
| 304 Collins Ave Unit 2 Baltimore, MD | 3.0 | 1.0 | 1016 | $2,100 | $2.07 | 45d | 1 | 0.99mi |
| 212 S Loudon Ave Baltimore, MD | 3.0 | 1.5 | 1310 | $1,550 | $1.18 | 45d | 1 | 0.99mi |
| 3704 Coolidge Ave Baltimore, MD | 2.0 | 1.0 | 1262 | $2,000 | $1.58 | 22d | 1 | 1.01mi |
| 1931 Griffis Ave Baltimore, MD | 2.0 | 1.0 | 912 | $1,349 | $1.48 | 6d | 1 | 1.04mi |
| 4018 Massachusetts Ave Baltimore, MD | 3.0 | 1.0 | 1050 | $1,400 | $1.33 | 25d | 1 | 1.05mi |
| 307 S Smallwood St Baltimore, MD | 2.0 | 2.5 | 1400 | $1,350 | $0.96 | 45d | 1 | 1.05mi |
| 4301 Parkton St Baltimore, MD | 1.0–3.0 | 1.0 | 730 | $1,550 | $2.12 | 45d | 1 | 1.07mi |
| 514 S Payson St Unit 2 Baltimore, MD | 3.0 | 2.0 | 1264 | $1,750 | $1.38 | 45d | 1 | 1.12mi |
| 2056 Griffis Ave Baltimore, MD | 3.0 | 1.5 | 1230 | $1,495 | $1.22 | 23d | 1 | 1.16mi |
| 3607 W Lexington St Baltimore, MD | 3.0 | 2.0 | 1050 | $1,895 | $1.80 | 6d | 1 | 1.18mi |
| 2225 W Baltimore St Baltimore, MD | 3.0 | 2.5 | 1200 | $1,600 | $1.33 | 25d | 1 | 1.19mi |
| 2232 W Baltimore St Baltimore, MD | 3.0 | 1.0 | 1250 | $1,875 | $1.50 | 25d | 1 | 1.19mi |
| 62 N Gorman Ave Baltimore, MD | 3.0 | 2.0 | 1100 | $2,500 | $2.27 | 19d | 1 | 1.20mi |
| 751 Yale Ave Baltimore, MD | 3.0 | 1.5 | 1024 | $1,750 | $1.71 | 45d | 1 | 1.21mi |
| 738 Yale Ave Baltimore, MD | 2.0 | 1.0 | 1346 | $1,900 | $1.41 | 25d | 1 | 1.22mi |
| 2815 W Mulberry St Baltimore, MD | 4.0 | 2.0 | 1040 | $2,050 | $1.97 | 45d | 1 | 1.23mi |
| 1708 Hall Ave Unit 2 Halethorpe, MD | 2.0 | 1.0 | 845 | $1,625 | $1.92 | 13d | 1 | 1.24mi |
| 405 N Edgewood St Baltimore, MD | 4.0 | 2.0 | 1408 | $2,750 | $1.95 | 0d | 1 | 1.26mi |
| 4431 Eldone Rd Baltimore, MD | 3.0 | 2.0 | 896 | $2,000 | $2.23 | 25d | 1 | 1.29mi |
| 2 S Woodington Rd Baltimore, MD | 2.0 | 1.0 | 856 | $1,160 | $1.36 | 16d | 1 | 1.31mi |
| 2 N Woodington Rd Baltimore, MD | 1.0–2.0 | 1.0 | 738 | $1,335 | $1.81 | 5d | 5 | 1.32mi |
| 500 Lucia Ave Baltimore, MD | 3.0 | 2.0 | 1472 | $2,100 | $1.43 | 18d | 1 | 1.33mi |
Listing history 30 events
-
2026-06-21days on market $124,900 Active 88 DOM
-
2026-06-18days on market $124,900 Active 85 DOM
-
2026-06-17days on market $124,900 Active 84 DOM
-
2026-06-16days on market $124,900 Active 83 DOM
-
2026-06-15days on market $124,900 Active 82 DOM
-
2026-06-13days on market $124,900 Active 80 DOM
-
2026-06-09days on market $124,900 Active 76 DOM
-
2026-06-08days on market $124,900 Active 75 DOM
-
2026-06-07days on market $124,900 Active 74 DOM
-
2026-06-04days on market $124,900 Active 71 DOM
-
2026-06-03days on market $124,900 Active 70 DOM
-
2026-06-02days on market $124,900 Active 69 DOM
-
2026-06-01days on market $124,900 Active 68 DOM
-
2026-05-31days on market $124,900 Active 67 DOM
-
2026-03-25$124,900 Active 700-char remark
Show marketing remark (700 chars)
Hurry—this one won’t last! This move-in ready, spacious 3-bedroom, 1-bath townhome is the opportunity you’ve been waiting for. Step on the covered front porch, and into a home featuring updated flooring and a welcoming layout. The kitchen is equipped with stainless steel appliances, and the convenience of a main-level washer and dryer. The unfinished basement offers incredible potential—ready to be transformed into additional living space, a home office, or recreation area—adding both functionality and future value. Whether you're a first-time buyer or a savvy investor, this home checks all the boxes for comfort, value, and opportunity. Schedule your tour today!
-
2026-02-07historical
-
2026-02-04$125,000 Active
-
2026-02-04historical
-
2025-06-07historical
-
2025-04-06price $169,900
-
2025-01-17price $149,900
-
2024-12-09$169,000 Active
-
2020-08-20soldstatus $60,000
-
2019-03-25soldstatus $21,000
-
2014-11-04status Contract
-
2014-11-04soldstatus $17,000 Sold
-
2014-11-04soldstatus $17,000
-
2014-09-23$15,000 Active
-
2014-09-23$15,000
-
1982-11-10soldstatus $21,900
ⓘ Source: listings_history table (triggers on properties + properties_extension) + one-shot
backfill from property_details.listing_events for pre-trigger history.
Tax reassessment forecast MD · Partial reset (capped growth)
- Current annual tax
- $1,736 · $145/mo
- Projected year-2 tax
- $1,736 · $145/mo
- Expected delta
- $0/yr ($0/mo · 0.0%)
ⓘ Screening estimate from a state-policy table — verify with the county assessor before closing.
Climate risk First Street
- Flood 1/10 Low FEMA zone X (unshaded) · 0% chance over 30 yrs
- Wildfire 1/10 Low
- Heat 7/10 Severe 7 d/yr ≥103°F today · 15 d/yr by 30 yrs out
- Wind 6/10 Major 27% chance of damaging wind over 30 yrs
- Air quality 3/10 Moderate 3 unhealthy d/yr today · 4 by 30 yrs out
Nearby sold comps map
Loading sold comps map…
Walkable amenities ~0.75 mi
Loading nearby amenities…
Taxation est. · year 1
- Rental income
- $19,920
- − Mortgage interest
- −$6,996
- − Property taxes
- −$1,736
- − Insurance
- −$624
- − Repairs & maintenance
- −$1,594
- − Management
- −$1,594
- − Depreciation
- −$3,633
- Taxable income
- $3,743
- Est. tax owed @ 24.0%
- −$898
- After-tax cash flow
- $4,619/yr
For passive investors: Depreciation is non-cash, so a rental often shows a tax loss while cash-flowing — sheltering income. Rental losses are passive: they offset passive income freely, and up to $25,000/yr can offset ordinary (W-2) income if you actively participate and your MAGI is under $100k (phasing out to $0 by $150k); unused losses carry forward. On sale, claimed depreciation is recaptured at up to 25%, and gains may owe capital-gains tax (a 1031 exchange can defer both). Figures are a year-1 estimate at your 24.0% rate — not tax advice; consult a CPA.
Schools (NCES district)
- District
- Baltimore City Public Schools
- NCES district ID
- 2400090
- Math proficiency
- 7% ▼ -9.00%
- Reading proficiency
- 16% ▼ -5.00%
- Median HH income
- $42,108
- Composite
- 10.08/100
- National rank
- #9805
- State rank
- #24 of 24 in MD
Livability — Baltimore
- Score
- 76/100
- State rank
- #90
- US rank
- #3396
Category grades
Schools grade is shown separately in the Schools card above.
Census & demographics
- Census place
- Baltimore, MD
- County
- Baltimore City · 558,601 people
- City population
- 588,727
- Metro
- Baltimore-Columbia-Towson, MD
- Population (ZIP)
- 19,572
- Household income
- $45,840
- Rent vs Own
- Severe rent burden
- 1755.0
Population outlook (Baltimore County) Hauer SSP2
- Today (2025)
- 624,249 people
- By 2030
- 621,541 · -0.4%
- By 2040
- 609,756 · -2.3%
- By 2050
- 597,249 · -4.3%
- By 2075
- 552,236 · -11.5%
- By 2100
- 513,934 · -17.7%
Race, ethnicity, and origin ACS 2023
- Neighborhood character
- Predominantly Black (72%)
- Race & ethnicity
- Black 72% White 16% Hispanic / Latino 7% Two or more races 6% Asian 1%
- Hispanic origin (detail)
- Mexican 3% Puerto Rican 1%
- Common ancestry
- Romanian 1%
- Foreign-born
- 8% · Canada
- Languages at home
- 90% English-only · Spanish 6% French/Haitian/Cajun 2% Other Indo-European 1%
Political lean MEDSL · Baltimore
- 2024 margin
- Solid D (+73.0) · D 85.2% · R 12.2% · Other 2.6%
- 2008→2024 swing
- -2.5pp toward R · 2008: 75.5pp · 2024: 73.0pp
- All cycles
- 2024: D+73.0 2020: D+76.6 2016: D+74.6 2012: D+76.4 2008: D+75.5
Not yet ingested
- Civics
- —
Market trends
- HPI YoY
- ▼ -97.99%
- Current HPI
- 140.5836
- Rent YoY
- ▲ 7.51%
- Metro
- Baltimore-Columbia-Towson, MD
- State GDP YoY
- ▲ 2.97%
- F500 in state
- 12
Industry mix (Fortune 500 HQ in MD)
| Industry | F500 HQs | Revenue |
|---|---|---|
| Aerospace / Defense | 1 | $71B |
|
||
| Utilities | 1 | $25B |
|
||
| Hotels | 1 | $24B |
|
||
| Consumer Goods | 1 | $7B |
|
||
| Real Estate | 1 | $6B |
|
||
| Chemicals | 1 | $2B |
|
||
Price history
+470.3% since first listed16 events — show timeline
- 2026-03-25 Listed $124,900 BRIGHT MLS
- 2026-02-07 Listing Removed — BRIGHT MLS
- 2026-02-04 Listed $125,000 BRIGHT MLS
- 2026-02-04 Coming Soon — BRIGHT MLS
- 2025-06-07 Listing Removed — BRIGHT MLS
- 2025-04-06 Price Changed $169,900 BRIGHT MLS
- 2025-01-17 Price Changed $149,900 BRIGHT MLS
- 2024-12-09 Listed $169,000 BRIGHT MLS
- 2020-08-20 Sold (Public Records) $60,000 Public Records
- 2019-03-25 Sold (Public Records) $21,000 Public Records
- 2014-11-04 Pending — MRIS
- 2014-11-04 Sold (MLS) $17,000 BRIGHT MLS
- 2014-11-04 Sold (MLS) $17,000 MRIS
- 2014-09-23 Listed $15,000 MRIS
- 2014-09-23 Listed $15,000 BRIGHT MLS
- 1982-11-10 Sold (Public Records) $21,900 Public Records
Property tax history
+1.5%/yrLatest (2025): $1,736 · +11.1% YoY. Source: county tax records.
Cash-flow waterfall
monthlySold comps — $/sqft
last 12 mo · ≤1 miLoading sold comps…