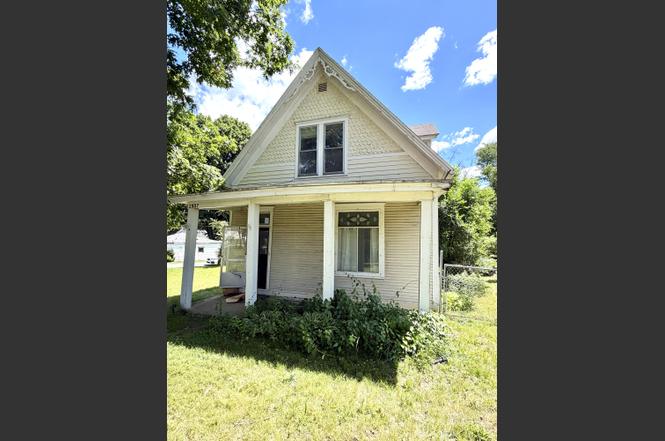
2907 Union St · Hobart, IN
Flood risk 1/10 · Minimal
- FEMA flood zone
- X (unshaded)
- Chance of flooding over 30 yrs
- 0.0%
- Est. flood insurance / yr
- $473 – $860
Fire risk 4/10 · Minor
- Est. fire insurance / yr
- $717 – $1,331
Heat risk 2/10 · Minimal
- Hot days now (above 102°F)
- 7 days/yr
- Hot days in 30 yrs
- 15 days/yr
Wind risk 2/10 · Minimal
- Chance of severe wind over 30 yrs
- —
Air-quality risk 4/10 · Minor
- Unhealthy air days now
- 5 days/yr
- Unhealthy air days in 30 yrs
- 6 days/yr
Risk factors via First Street. Map © Google.
Why this score? — see what drove the B+ grade
The composite is a weighted blend of 9 inputs, each scored 0–100. Each bar is that input's sub-score; the figure is the points it added to the 100-point composite (weight × sub-score).
- Cash flow +30.0/30.0
- ARV discount +15.0/15.0
- DSCR +10.0/10.0
- 1% rule +9.8/10.0
- Rent growth +3.9/5.0
- Livability +3.5/5.0
- Condition / age +2.5/5.0
- Schools +2.0/10.0
- Appreciation +0.0/10.0
$120,000
🖨 Deal sheet 📄 Offer letter ✓ Due diligence
Listing remarks MLS
Beautiful 1 acre fenced lot with 1.5 story 3 bedroom home in need of work/updating! Bring your cash buyers to check out this one - main level offers vestibule with French doors to large living room open to huge formal dining area with 9' ceilings & stained glass accent, kitchen with door to back deck, 1 bedroom with wood flooring & huge bath with wood laminate flooring. Upstairs you will find 2 additional bedrooms (1 has no closet) and the other has a nice closet and an 11x7 sitting area. Unfinished cellar type basement with door to back. Plaster walls and 1.5 car detached garage. This home is being sold as-is
Key facts
- Oversized driveway
- Low-traffic street
- Detached garage
Tags
Property features AI
Finance
- Other: Living area consists of above-grade and below-grade finished space (above grade finished area and below grade finished area recorded)
Exterior
- Parking: Detached garage; Driveway; Additional off-street parking; 1 garage space
- Security: Other security features
- Utilities: Electricity connected (100 amp service); Natural gas connected; Well water; Septic tank
- Home design: One and one-half story; Built in 1870
- Construction: Shingle roof; Other construction materials; Basement (other type)
- Exterior features: Rural view; Covered porch or patio; Chain link fencing; Garage(s) structure present
Interior
- Kitchen: Gas range; Refrigerator
- Bedrooms: Primary bedroom; Bedroom 2; Bedroom 3; Total rooms: 6; Basement present (finished area listed)
- Flooring: Hardwood; Other flooring types
- Bathrooms: 1 full bathroom
- Heating & cooling: Forced air heating (natural gas); Ceiling fan(s) for cooling
- Interior features: Ceiling fans
- Laundry & utility: Washer hookup; Gas dryer hookup; Washer and dryer included
Neighborhood map
What this means for you Summary
Snapshot
- This is a 3-bed/1.0-bath single-family listed at $120k.
Deal economics
- At list price, monthly cash flow is $559 ($7k/yr) — positive.
- The deal already cash-flows at list — no discount required.
- Meets the 1% rule at list price ($2k rent vs $120k).
- Cap rate 11.9% vs local median 4.2% in Hobart — top-decile yield for the area; either an underpriced asset or a hidden risk that comps aren't pricing in. Stress-test before assuming the spread holds.
Location & tenants
- Location reads 69/100 on livability (#196 in IN) — a middle-class / working-renter tenant base. Strengths: cost of living A+, housing A+, crime B; Watch: schools D, amenities F, commute F.
- River Forest Community School Corporation (suburban): math 17% / reading 30% proficiency, ranked #268 of 301 in IN (top 89%) — low school quality limits family demand, transient renter base, plan for 1-2y turnover; 72% free/reduced lunch — lower-income household profile, screen leases tightly.
- Market conditions: Rents rising fast (+5.6%/yr); 255 active listings in the ZIP; 6 comparable units currently listed for rent nearby; rentals leasing fast (median 13d on market — plan ~1-2 weeks tenant-placement turnaround); solid renter incomes; 1,642 units permitted in Lake County in 2024 (14 in 5+ unit buildings).
Forward outlook
- Local home prices are declining (-3.0%/yr); year-one equity from $830 of loan paydown is wiped out by about $4k of value loss. Plan a longer hold.
- Lake County population projected to shrink 7% by 2050 — rents likely to lag national; underwrite the cash flow, not the appreciation.
- At projected returns (-3.0% appreciation + 5.6% rent growth), your $34k cash investment doubles in ~6 years — after that, you're playing with house money.
Negotiation context
- Only 1 days on market — expect competitive offers; lowballing is unlikely to land.
- 3 sale attempts since 5y ago with the ask held roughly flat each time — persistent listings suggest the price (not the market) is what's stuck; bring a comps-based counter.
- Current owner paid $93k; 29% above their basis — modest negotiation headroom, anchor on the comps not their cost.
Risks & watch-outs
- Watch-outs: built in 1870 — expect roof / HVAC / electrical / plumbing capex.
Questions for the listing agent
- Built in 1870 — when were the roof, HVAC, electrical panel, plumbing, and water heater last replaced?
- Is there a deadline driving the sale (1031 exchange, divorce, estate, relocation)? That informs how much negotiation room exists.
- Schools are D-rated, which usually means shorter tenancies and higher turnover. Who's the typical renter profile here, and what's been the actual vacancy rate?
- What's the average days-on-market for RENTAL listings here right now (not sales)? A rising rental-DOM trend means longer vacancies and softer asking-rent achievability than the comps imply.
- What's the recent tenant-quality profile in this submarket — average credit score on applications, eviction rate, late-payment / NSF rate, and stable-employment percentage? A property-management company in the area should have these aggregated.
- How much new for-sale + rental construction is in the pipeline within 1–3 miles? Heavy new supply typically softens prices + rents 12–24 months out; constrained supply supports both.
Investment metrics
- 1% rule
- 1.48% ✓
- Cap rate
- 11.88%
- Cash-on-cash
- 19.95%
- DSCR
- 1.89
- GRM
- 5.6
CMA / ARV
- ARV (on-the-fly)
- $230,384
- Comps found
- 12
Show comp detail 12 sales within ~0.75 mi
| Address | Dist | Beds/Ba | Sqft | Sold | Price | $/sf | Match |
|---|---|---|---|---|---|---|---|
| 2737 Vermillion St | 0.26mi | 4/1.0 (+1) | 1,636 (-3%) | 4mo | $194,900 | $119 | 74 |
| 4265 E 28th Ave | 0.14mi | 3/2.0 | 1,840 (+9%) | 6mo | $155,000 | $84 | 70 |
| 2747 Vigo St | 0.29mi | 4/2.0 (+1) | 1,768 (+4%) | 9mo | $240,000 | $136 | 63 |
| 3092 Edgewood St | 0.58mi | 3/1.5 | 1,724 (+2%) | 8mo | $245,000 | $142 | 61 |
| 2868 Edgewood St | 0.62mi | 3/2.0 | 1,746 (+3%) | 1mo | $343,400 | $197 | 61 |
| 2850 Vermillion St | 0.13mi | 4/2.0 (+1) | 1,504 (-11%) | 8mo | $186,459 | $124 | 60 |
| 2669 Vigo St | 0.37mi | 2/1.0 (-1) | 1,840 (+9%) | 19mo | $150,000 | $82 | 48 |
| 3125 Old Hobart Rd | 0.71mi | 4/1.5 (+1) | 1,840 (+9%) | 5mo | $181,000 | $98 | 41 |
| 3550 Old Hobart Rd | 0.64mi | 3/1.5 | 1,900 (+12%) | 12mo | $237,555 | $125 | 37 |
| 3118 Edgewood St | 0.59mi | 4/1.5 (+1) | 1,496 (-12%) | 14mo | $218,000 | $146 | 34 |
| 3540 Old Hobart Rd | 0.62mi | 4/3.0 (+1) | 1,934 (+14%) | 10mo | $270,000 | $140 | 26 |
| 2435 Spencer St | 0.68mi | 3/3.0 | 1,456 (-14%) | 21mo | $239,000 | $164 | 20 |
Match score weights: distance 35% · size 25% · config 20% · recency 20%. Top-matched comps best support the ARV.
Projected returns pro-forma
-3.0% appreciation · 5.63% rent growth · sell at horizon
- IRR
- 15.1%
- Equity multiple
- 1.62×
- Total profit
- $20,995
- Equity at exit
- $17,892
- IRR
- 25.7%
- Equity multiple
- 3.53×
- Total profit
- $85,118
- Equity at exit
- $10,375
Cash invested: $33,600 (down + closing). Projections, not guarantees.
Landlord ↔ Tenant lean methodology
- Overall (STATE)
- 90 Strongly Landlord-Friendly
- State Indiana
- 90 Strongly Landlord-Friendly · R+11
- County
- — inherits STATE
- City
- — inherits STATE
ZIP-level market 46342
- Rents YoY
- 5.6%
- Active inventory
- 255
- Price-to-rent
- 5.6×
Monthly cashflow live
- Estimated rent
- $1,774 high interval (Pro) →
- Mortgage (P&I)
- −$629
- Tax from tax record
- −$164 /mo · $1,966/yr
- Insurance
- −$50
- HOA
- −$0
- Vacancy / Maint / Mgmt
- −$373
- Net cashflow
- $559
Break-even live
UW: 25.0% down · 7.5% · 30yr · 1.5% tax · 5.0% vac · 8.0% maint · 8.0% mgmt
Financing live
Cash to close
- Down payment
- $30,000
- Closing costs
- $3,600
- Reserves months
- —
- Total cash needed
- —
Loan-product check · same deal, 3 products live
Conventional
25% down · 7.5% · 30yr
- Down + closing
- —
- Monthly P&I
- —
- Monthly cashflow
- —
- DSCR
- —
- Eligible?
- —
Personal DTI + credit; lowest rate.
DSCR
20% down · 8.5% · 30yr
- Down + closing
- —
- Monthly P&I
- —
- Monthly cashflow
- —
- DSCR
- —
- Eligible?
- —
No personal income docs; deal must DSCR.
Hard money
10% down · 12.0% · 12mo
- Down + closing
- —
- Monthly P&I
- —
- Monthly cashflow
- —
- DSCR
- —
- Eligible?
- —
Short-term bridge; refi at stabilization.
Rent comps 6 comps
| Address | Beds | Baths | Sqft | Rent | $/sqft | DOM | Units | Dist |
|---|---|---|---|---|---|---|---|---|
| 2870 Vigo St Lake Station, IN | 3.0 | 2.0 | 1446 | $1,850 | $1.28 | 43d | 1 | 0.17mi |
| 2701 Union St Lake Station, IN | 3.0 | 2.0 | 1958 | $1,700 | $0.87 | 43d | 1 | 0.25mi |
| 3101 County Line Rd Portage, IN | 3.0 | 2.0 | 1177 | $1,900 | $1.61 | 1d | 1 | 0.54mi |
| 5091 Central Ave Portage, IN | 3.0 | 1.0 | 1644 | $2,000 | $1.22 | 1d | 1 | 0.93mi |
| 4546 Marquette Rd Lake Station, IN | 3.0 | 2.0 | 1621 | $1,800 | $1.11 | 1d | 1 | 0.98mi |
| 5423 Tulip Ave Portage, IN | 3.0 | 1.0 | 1872 | $2,000 | $1.07 | 12d | 1 | 1.42mi |
Listing history 2 events
-
2026-06-17remarks 699-char remark
-
2026-06-17$120,000 Active 1 DOM
ⓘ Source: listings_history table (triggers on properties + properties_extension) + one-shot
backfill from property_details.listing_events for pre-trigger history.
Tax reassessment forecast IN · Partial reset (capped growth)
- Current annual tax
- $1,966 · $164/mo
- Projected year-2 tax
- $1,966 · $164/mo
- Expected delta
- $0/yr ($0/mo · 0.0%)
ⓘ Screening estimate from a state-policy table — verify with the county assessor before closing.
Climate risk First Street
- Flood 1/10 Low FEMA zone X (unshaded) · 0% chance over 30 yrs
- Wildfire 4/10 Moderate
- Heat 2/10 Low 7 d/yr ≥102°F today · 15 d/yr by 30 yrs out
- Wind 2/10 Low
- Air quality 4/10 Moderate 5 unhealthy d/yr today · 6 by 30 yrs out
Nearby sold comps map
Loading sold comps map…
Walkable amenities ~0.75 mi
Loading nearby amenities…
Taxation est. · year 1
- Rental income
- $21,294
- − Mortgage interest
- −$6,722
- − Property taxes
- −$1,966
- − Insurance
- −$600
- − Repairs & maintenance
- −$1,704
- − Management
- −$1,704
- − Depreciation
- −$3,491
- Taxable income
- $5,108
- Est. tax owed @ 24.0%
- −$1,226
- After-tax cash flow
- $5,479/yr
For passive investors: Depreciation is non-cash, so a rental often shows a tax loss while cash-flowing — sheltering income. Rental losses are passive: they offset passive income freely, and up to $25,000/yr can offset ordinary (W-2) income if you actively participate and your MAGI is under $100k (phasing out to $0 by $150k); unused losses carry forward. On sale, claimed depreciation is recaptured at up to 25%, and gains may owe capital-gains tax (a 1031 exchange can defer both). Figures are a year-1 estimate at your 24.0% rate — not tax advice; consult a CPA.
Schools (NCES district)
- District
- River Forest Community School Corporation
- NCES district ID
- 1804620
- Math proficiency
- 17% ▼ -18.00%
- Reading proficiency
- 30% ▼ -6.00%
- Median HH income
- $38,317
- Composite
- 19.65/100
- National rank
- #8738
- State rank
- #268 of 301 in IN
Livability — Hobart
- Score
- 69/100
- State rank
- #196
- US rank
- #8834
Category grades
Schools grade is shown separately in the Schools card above.
Census & demographics
- Census place
- Hobart, IN
- County
- Lake County · 422,878 people
- City population
- 32,224
- Metro
- Chicago-Naperville-Elgin, IL-IN-WI
- Population (ZIP)
- 32,224
- Household income
- $75,521
- Rent vs Own
- Severe rent burden
- 1033.0
Population outlook (Lake County) Hauer SSP2
- Today (2025)
- 484,026 people
- By 2030
- 478,091 · -1.2%
- By 2040
- 462,974 · -4.3%
- By 2050
- 449,894 · -7.1%
- By 2075
- 436,169 · -9.9%
- By 2100
- 426,607 · -11.9%
Race, ethnicity, and origin ACS 2023
- Neighborhood character
- Predominantly White (66%)
- Race & ethnicity
- White 66% Hispanic / Latino 21% Two or more races 10% Black 10% Asian 1%
- Hispanic origin (detail)
- Mexican 15% Puerto Rican 5%
- Common ancestry
- Romanian 11% Iranian 2% Lithuanian 1%
- Foreign-born
- 5% · Canada, China
- Languages at home
- 87% English-only · Spanish 9% Russian/Polish/Slavic 2% Chinese 1%
Political lean MEDSL · Lake
- 2024 margin
- Lean D (+5.6) · D 52.1% · R 46.5% · Other 1.5%
- 2008→2024 swing
- -28.6pp toward R · 2008: 34.3pp · 2024: 5.6pp
- All cycles
- 2024: D+5.6 2020: D+15.1 2016: D+20.6 2012: D+31.0 2008: D+34.3
Not yet ingested
- Civics
- —
Market trends
- HPI YoY
- ▼ -167.01%
- Current HPI
- 260.2635
- Rent YoY
- ▲ 5.63%
- Metro
- Chicago-Naperville-Elgin, IL-IN-WI
- State GDP YoY
- ▲ 2.90%
- F500 in state
- 18
Industry mix (Fortune 500 HQ in IN)
| Industry | F500 HQs | Revenue |
|---|---|---|
| Industrial Machinery | 2 | $37B |
|
||
| Healthcare | 1 | $177B |
|
||
| Pharmaceuticals | 1 | $45B |
|
||
| Metals / Steel | 1 | $18B |
|
||
| Agriculture | 1 | $17B |
|
||
| Packaging | 1 | $12B |
|
||
Price history
+9.1% since first listed5 events — show timeline
- 2026-06-17 Listed $120,000 NIRA MLS as Distributed by MLS Grid
- 2021-10-27 Sold (MLS) $93,000 MRED as Distributed by MLS Grid
- 2021-10-27 Sold (MLS) $93,000 NIRA MLS as Distributed by MLS Grid
- 2021-08-23 Listed $110,000 MRED as Distributed by MLS Grid
- 2021-08-23 Listed $110,000 NIRA MLS as Distributed by MLS Grid
Property tax history
+2.7%/yrLatest (2024): $1,966 · +8.1% YoY. Source: county tax records.
Cash-flow waterfall
monthlySold comps — $/sqft
last 12 mo · ≤1 miLoading sold comps…