206 Main St · Queen City, MO
Flood risk No data
- FEMA flood zone
- —
- Chance of flooding over 30 yrs
- —
- Est. flood insurance / yr
- —
Fire risk No data
- Est. fire insurance / yr
- —
Heat risk No data
- Hot days now (above threshold)
- —
- Hot days in 30 yrs
- —
Wind risk No data
- Chance of severe wind over 30 yrs
- —
Air-quality risk No data
- Unhealthy air days now
- —
- Unhealthy air days in 30 yrs
- —
Risk factors via First Street. Map © Google.
Why this score? — see what drove the C+ grade
The composite is a weighted blend of 9 inputs, each scored 0–100. Each bar is that input's sub-score; the figure is the points it added to the 100-point composite (weight × sub-score).
- Cash flow +25.1/30.0
- DSCR +8.2/10.0
- ARV discount +7.5/15.0
- 1% rule +6.6/10.0
- Appreciation +5.0/10.0
- Schools +3.1/10.0
- Livability +3.1/5.0
- Rent growth +2.5/5.0
- Condition / age +2.2/5.0
$79,900
🖨 Deal sheet (PDF) 📄 Offer letter ✓ Due diligence
Listing remarks
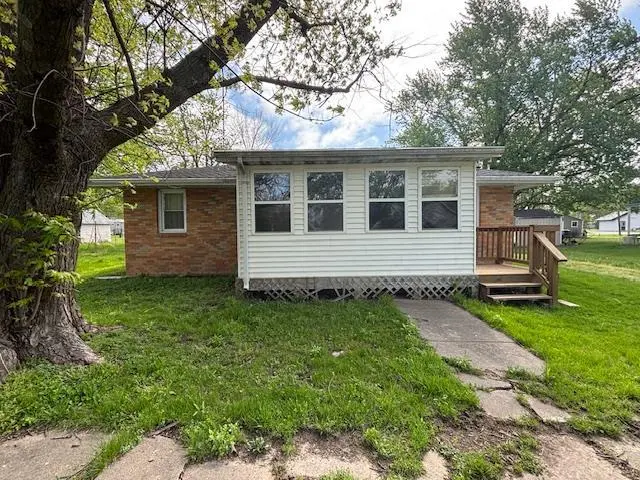
A solid 3-bedroom, 1-bath home full of potential and ready for your personal touch! This property features classic brick siding that adds timeless curb appeal and durability. Inside, you'll find a functional layout with plenty of opportunity to update and make it your own. The detached one-car garage provides convenient parking or extra storage space. Whether you're looking for a starter home or an investment opportunity, this property is a great canvas to bring your vision to life. Call Michael Chrisman @660.342.8685 for your personal showing!
Key facts
- Brick siding
- Detached garage
- Garage
Tags
Property features AI
Exterior
- Parking: Detached 1-car garage
- Utilities: Public water; Public sewer; Natural gas available
- Home design: Single-family residential property
- Construction: Brick and vinyl siding construction
- Exterior features: Storm door(s); Asphalt roof
Interior
- Kitchen: Microwave; Gas range and gas oven
- Bathrooms: One full bathroom
- Heating & cooling: Central air conditioning
- Interior features: Microwave; Gas range and gas oven; Dryer; Washer; Gas water heater; Crawl space basement
- Laundry & utility: Washer; Dryer; Gas water heater
Neighborhood map
What this means for you Summary
Snapshot
- This is a 3-bed/1.0-bath single-family listed at $80k. Condition is rated fair.
Deal economics
- At list price, monthly cash flow is $177 ($2k/yr) — positive.
- The deal already cash-flows at list — no discount required.
- Meets the 1% rule at list price ($923 rent vs $80k).
- Recommended offer: $78k (3.0% below list) — sets the bar for market timing.
Location & tenants
- Location reads 61/100 on livability (#437 in MO) — a middle-class / working-renter tenant base. Strengths: cost of living A+, housing A+; Watch: health & safety C-, employment D+, schools D-.
- Schuyler County R-I (rural): math 33% / reading 42% proficiency, ranked #199 of 324 in MO (top 61%) — families likely to look elsewhere, expect single-tenant / working-renter base with shorter leases.
- Market conditions: 6 active listings in the ZIP; 8 units permitted in Schuyler County in 2024 (0 in 5+ unit buildings).
Forward outlook
- In year one you build about $3k of equity ($552 loan paydown + $2k appreciation (3.0% local appreciation)).
- At projected returns (3.0% appreciation + 3.0% rent growth), your $22k cash investment doubles in ~4 years — after that, you're playing with house money.
Negotiation context
- It's been on market 40 days — a 3% lower offer ($78k) is reasonable based on typical stale-listing flexibility.
Questions for the listing agent
- It's been on market 40 days. Have you received any prior offers? Is the seller open to a 3% concession, seller financing, or rate buy-down credit?
- Have any recent inspections been done? Can we get a copy of the seller's disclosures and any deferred-maintenance estimates?
- Built in 1967 — when were the roof, HVAC, electrical panel, plumbing, and water heater last replaced?
- Is there a deadline driving the sale (1031 exchange, divorce, estate, relocation)? That informs how much negotiation room exists.
- Schools are D-rated, which usually means shorter tenancies and higher turnover. Who's the typical renter profile here, and what's been the actual vacancy rate?
- Crime grade is F in this area — have there been break-ins, vandalism, or insurance claims at this property in the last 3 years? What carrier currently insures it and at what premium?
- What's the average days-on-market for RENTAL listings here right now (not sales)? A rising rental-DOM trend means longer vacancies and softer asking-rent achievability than the comps imply.
- What's the recent tenant-quality profile in this submarket — average credit score on applications, eviction rate, late-payment / NSF rate, and stable-employment percentage? A property-management company in the area should have these aggregated.
- How much new for-sale + rental construction is in the pipeline within 1–3 miles? Heavy new supply typically softens prices + rents 12–24 months out; constrained supply supports both.
Investment metrics
- 1% rule
- 1.16% ✓
- Cap rate
- 8.96%
- Cash-on-cash
- 9.51%
- DSCR
- 1.42
- GRM
- 7.2
CMA / ARV
No comps found within radius.
Projected returns pro-forma
3.0% appreciation · 3.0% rent growth · sell at horizon
- IRR
- 16.4%
- Equity multiple
- 1.94×
- Total profit
- $20,929
- Equity at exit
- $35,926
- IRR
- 18.0%
- Equity multiple
- 3.62×
- Total profit
- $58,715
- Equity at exit
- $55,367
Cash invested: $22,372 (down + closing). Projections, not guarantees.
Landlord ↔ Tenant lean methodology
- Overall (STATE)
- 81 Strongly Landlord-Friendly
- State Missouri
- 81 Strongly Landlord-Friendly · R+10
- County
- — inherits STATE
- City
- — inherits STATE
ZIP-level market 63561
- Active inventory
- 6
- Price-to-rent
- 7.2×
Monthly cashflow live
- Estimated rent
- $923 medium interval (Pro) →
- Mortgage (P&I)
- −$419
- Tax est. 1.5%
- −$100 /mo · $1,198/yr
- Insurance
- −$33
- HOA
- −$0
- Vacancy / Maint / Mgmt
- −$194
- Net cashflow
- $177
Break-even live
Sensitivity live
| Price | -10% $232 | -5% $205 | +0% $177 | +5% $150 | +10% $122 |
|---|---|---|---|---|---|
| Rent | -10% $104 | -5% $141 | +0% $177 | +5% $214 | +10% $250 |
| Rate | -1.0pp $218 | -0.5pp $198 | base $177 | +0.5pp $157 | +1.0pp $136 |
UW: 25.0% down · 7.5% · 30yr · 1.5% tax · 5.0% vac · 8.0% maint · 8.0% mgmt
Financing live
Cash to close
- Down payment
- $19,975
- Closing costs
- $2,397
- Reserves months
- —
- Total cash needed
- —
Loan-product check · same deal, 3 products live
Conventional
25% down · 7.5% · 30yr
- Down + closing
- —
- Monthly P&I
- —
- Monthly cashflow
- —
- DSCR
- —
- Eligible?
- —
Personal DTI + credit; lowest rate.
DSCR
20% down · 8.5% · 30yr
- Down + closing
- —
- Monthly P&I
- —
- Monthly cashflow
- —
- DSCR
- —
- Eligible?
- —
No personal income docs; deal must DSCR.
Hard money
10% down · 12.0% · 12mo
- Down + closing
- —
- Monthly P&I
- —
- Monthly cashflow
- —
- DSCR
- —
- Eligible?
- —
Short-term bridge; refi at stabilization.
Listing history 4 events
-
2026-06-02statusdays on market $79,900 Pending 40 DOM
-
2026-06-01days on market $79,900 Active 39 DOM
-
2026-05-31days on market $79,900 Active 38 DOM
-
2026-04-23$79,900 Active 550-char remark
ⓘ Source: listings_history table (triggers on properties + properties_extension) + one-shot
backfill from property_details.listing_events for pre-trigger history.
Nearby sold comps map
Loading sold comps map…
Walkable amenities ~0.75 mi
Loading nearby amenities…
Taxation est. · year 1
- Rental income
- $11,080
- − Mortgage interest
- −$4,476
- − Property taxes
- −$1,198
- − Insurance
- −$400
- − Repairs & maintenance
- −$886
- − Management
- −$886
- − Depreciation
- −$2,324
- Taxable income
- $909
- Est. tax owed @ 24.0%
- −$218
- After-tax cash flow
- $1,909/yr
For passive investors: Depreciation is non-cash, so a rental often shows a tax loss while cash-flowing — sheltering income. Rental losses are passive: they offset passive income freely, and up to $25,000/yr can offset ordinary (W-2) income if you actively participate and your MAGI is under $100k (phasing out to $0 by $150k); unused losses carry forward. On sale, claimed depreciation is recaptured at up to 25%, and gains may owe capital-gains tax (a 1031 exchange can defer both). Figures are a year-1 estimate at your 24.0% rate — not tax advice; consult a CPA.
Condition & rehab AI · 13 photos
This 3-bedroom, 1-bath home requires moderate renovations to update the interior and improve curb appeal. The dated kitchen and bathroom need significant work, while the exterior and flooring are in fair condition. Painting and updating the interior walls, along with new flooring and kitchen cabinets, would significantly increase its value.
Repairs flagged
- Major kitchen cabinets — severely dated and worn
- Major bathroom fixtures — dated and worn
- Major flooring — dated and worn linoleum
- Major interior walls/paint — dated colors and peeling paint
Value-add opportunities
- Both painting and updating interior walls — refreshes the interior and improves curb appeal
- Both new flooring — updates the dated linoleum and improves functionality
- Both new kitchen cabinets and countertops — modernizes the kitchen and improves functionality
- Both new bathroom fixtures — modernizes the bathroom and improves functionality
Renovation cost estimate screening
| Repair item | Severity | Est. cost |
|---|---|---|
| kitchen cabinets · severely dated and worn | Major | $15,000–50,000 |
| bathroom fixtures · dated and worn | Major | $15,000–50,000 |
| flooring · dated and worn linoleum | Major | $15,000–50,000 |
| interior walls/paint · dated colors and peeling paint | Major | $15,000–50,000 |
| Total estimated repair cost · 4 items | $60,000–200,000 |
Value-add ROI direction
- Both painting and updating interior walls — refreshes the interior and improves curb appeal ↑
- Both new flooring — updates the dated linoleum and improves functionality ↑
- Both new kitchen cabinets and countertops — modernizes the kitchen and improves functionality ↑
- Both new bathroom fixtures — modernizes the bathroom and improves functionality ↑
ⓘ Cost ranges are severity-bucket heuristics (US national rule-of-thumb). Get contractor quotes + a written scope before underwriting a rehab budget.
Schools (NCES district)
- District
- Schuyler County R-I
- NCES district ID
- 2927660
- Math proficiency
- 33% ▼ -5.00%
- Reading proficiency
- 42% ▼ -4.00%
- Median HH income
- $34,527
- Composite
- 30.91/100
- National rank
- #6115
- State rank
- #199 of 324 in MO
Livability — Queen City
- Score
- 61/100
- State rank
- #437
- US rank
- #17900
Category grades
Schools grade is shown separately in the Schools card above.
Census & demographics
- Census place
- Queen City, MO
- Population (ZIP)
- 1,069
Population outlook (Schuyler County) Hauer SSP2
- Today (2025)
- 4,477 people
- By 2030
- 4,470 · -0.2%
- By 2040
- 4,519 · +0.9%
- By 2050
- 4,562 · +1.9%
- By 2075
- 4,251 · -5.0%
- By 2100
- 3,392 · -24.2%
Race, ethnicity, and origin ACS 2023
- Neighborhood character
- Predominantly White (93%)
- Race & ethnicity
- White 93% Two or more races 6% Asian 2%
- Common ancestry
- Iranian 4% Lithuanian 1% Slovak 1%
- Foreign-born
- 0%
- Languages at home
- 98% English-only · Vietnamese 2%
Political lean MEDSL · Schuyler
- 2024 margin
- Solid R (+64.5) · D 17.2% · R 81.7% · Other 1.2%
- 2008→2024 swing
- -46.1pp toward R · 2008: -18.4pp · 2024: -64.5pp
- All cycles
- 2024: R+64.5 2020: R+61.6 2016: R+59.5 2012: R+24.6 2008: R+18.4
Not yet ingested
- Civics
- —
Market trends
- HPI YoY
- —
- Current HPI
- —
- Rent YoY
- —
- Metro
- —
- State GDP YoY
- ▲ 1.84%
- F500 in state
- 20
Industry mix (Fortune 500 HQ in MO)
| Industry | F500 HQs | Revenue |
|---|---|---|
| Healthcare | 1 | $163B |
|
||
| Insurance | 1 | $21B |
|
||
| Industrial Technology | 1 | $17B |
|
||
| Retail | 1 | $16B |
|
||
| Industrial Distribution | 1 | $10B |
|
||
| Utilities | 1 | $9B |
|
||
Price history
2 events — show timeline
- 2026-06-02 Pending — NECAR
- 2026-04-23 Listed $79,900 NECAR
Cash-flow waterfall
monthlySold comps — $/sqft
last 12 mo · ≤1 miLoading sold comps…