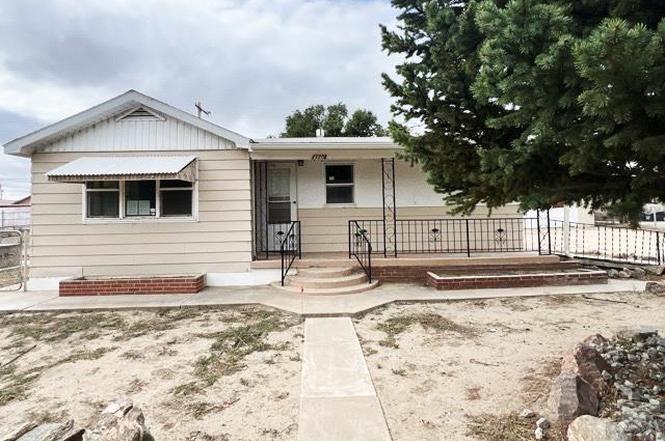
320 Nana Lou St · Avondale, CO
Flood risk 1/10 · Minimal
- FEMA flood zone
- X (unshaded)
- Chance of flooding over 30 yrs
- 0.0%
- Est. flood insurance / yr
- $473 – $860
Fire risk 4/10 · Minor
- Est. fire insurance / yr
- $939 – $1,743
Heat risk 4/10 · Minor
- Hot days now (above 97°F)
- 7 days/yr
- Hot days in 30 yrs
- 21 days/yr
Wind risk 2/10 · Minimal
- Chance of severe wind over 30 yrs
- —
Air-quality risk 1/10 · Minimal
- Unhealthy air days now
- 0 days/yr
- Unhealthy air days in 30 yrs
- 0 days/yr
Risk factors via First Street. Map © Google.
Why this score? — see what drove the B grade
The composite is a weighted blend of 9 inputs, each scored 0–100. Each bar is that input's sub-score; the figure is the points it added to the 100-point composite (weight × sub-score).
- Cash flow +30.0/30.0
- 1% rule +10.0/10.0
- DSCR +10.0/10.0
- ARV discount +7.5/15.0
- Appreciation +6.3/10.0
- Schools +3.0/10.0
- Livability +3.0/5.0
- Rent growth +2.5/5.0
- Condition / age +2.5/5.0
$81,450
🖨 Deal sheet (PDF) 📄 Offer letter ✓ Due diligence
Listing remarks MLS
Nice Avondale rancher ready to move in. This home features 4 bedrooms, a spacious living room and kitchen as well as a nice fully fenced yard. The detached garage is the perfect man cave. Lots of off road parking. An irrigation well can be used to water if desired. Come see this home today.
Key facts
- Open living room
- Metal siding
- Space to garden
Tags
Property features AI
Finance
- HOA & community: No association amenities
Exterior
- Parking: Detached garage; 2 garage spaces
- Utilities: Public water; Public sewer
- Home design: Single-family residence; Residential property
- Construction: Frame construction; Composition roof
- Exterior features: Shed(s) on the property; No patio or porch listed
Interior
- Kitchen: Range; Oven; Refrigerator
- Bedrooms: 4 bedrooms on the main level
- Flooring: Hardwood; Wood; Laminate
- Bathrooms: 1 full bathroom on the main level
- Heating & cooling: Forced air heating (natural gas); No cooling system
- Interior features: Master suite on the main level; Basement with storage space
- Laundry & utility: Laundry on the main level
Neighborhood map
What this means for you Summary
Snapshot
- This is a 4-bed/1.0-bath single-family listed at $81k.
Deal economics
- At list price, monthly cash flow is $511 ($6k/yr) — positive.
- The deal already cash-flows at list — no discount required.
- Meets the 1% rule at list price ($1k rent vs $81k).
- Recommended offer: $74k (9.0% below list) — sets the bar for market timing.
Location & tenants
- Location reads 60/100 on livability (#255 in CO) — a middle-class / working-renter tenant base. Strengths: employment A+, housing A+, cost of living B; Watch: health & safety C-, crime F, amenities F.
- Pueblo County School District 70 (suburban): math 24% / reading 43% proficiency, ranked #40 of 86 in CO (top 46%) — families likely to look elsewhere, expect single-tenant / working-renter base with shorter leases.
- Zoned schools: Prairie Winds Elementary School (math 24% / reading 27%, grade F, #594 of 966 statewide, top 62%, 500 students, 47% FRL); Sky View Middle School (math 22% / reading 47%, grade F, #106 of 270 statewide, top 42%, 577 students, 41% FRL); Pueblo West High School (math 23% / reading 52%, grade F, #192 of 381 statewide, top 51%, 1,484 students, 40% FRL).
- Market conditions: 25 active listings in the ZIP; 269 units permitted in Pueblo County in 2024 (0 in 5+ unit buildings).
Forward outlook
- In year one you build about $3k of equity ($564 loan paydown + $2k appreciation (2.6% local appreciation)).
- Pueblo County population projected at +10% by 2050 — modest demand growth; plan on rents tracking national, not racing it.
- At projected returns (2.6% appreciation + 3.0% rent growth), your $23k cash investment doubles in ~3 years — after that, you're playing with house money.
Negotiation context
- It's been on market 104 days — a 9% lower offer ($74k) is reasonable based on typical stale-listing flexibility.
- 7 sale attempts since 11y ago; this cycle's ask has dropped $31k (27%) from the opening price — seller is motivated, your offer sets the floor, not the list.
Questions for the listing agent
- It's been on market 104 days. Have you received any prior offers? Is the seller open to a 9% concession, seller financing, or rate buy-down credit?
- Built in 1964 — when were the roof, HVAC, electrical panel, plumbing, and water heater last replaced?
- Why hasn't it sold? Are there any deal-killer items the seller is aware of (foundation, flood, title, zoning, code violations)?
- Is there a deadline driving the sale (1031 exchange, divorce, estate, relocation)? That informs how much negotiation room exists.
- Schools are F-rated, which usually means shorter tenancies and higher turnover. Who's the typical renter profile here, and what's been the actual vacancy rate?
- Crime grade is F in this area — have there been break-ins, vandalism, or insurance claims at this property in the last 3 years? What carrier currently insures it and at what premium?
- What's the average days-on-market for RENTAL listings here right now (not sales)? A rising rental-DOM trend means longer vacancies and softer asking-rent achievability than the comps imply.
- What's the recent tenant-quality profile in this submarket — average credit score on applications, eviction rate, late-payment / NSF rate, and stable-employment percentage? A property-management company in the area should have these aggregated.
- How much new for-sale + rental construction is in the pipeline within 1–3 miles? Heavy new supply typically softens prices + rents 12–24 months out; constrained supply supports both.
Investment metrics
- 1% rule
- 1.69% ✓
- Cap rate
- 13.83%
- Cash-on-cash
- 26.90%
- DSCR
- 2.20
- GRM
- 4.9
CMA / ARV
No comps found within radius.
Projected returns pro-forma
2.58% appreciation · 3.0% rent growth · sell at horizon
- IRR
- 32.1%
- Equity multiple
- 2.78×
- Total profit
- $40,593
- Equity at exit
- $34,697
- IRR
- 32.9%
- Equity multiple
- 5.44×
- Total profit
- $101,213
- Equity at exit
- $52,020
Cash invested: $22,806 (down + closing). Projections, not guarantees.
Landlord ↔ Tenant lean methodology
- Overall (STATE)
- 38 Tenant-Leaning
- State Colorado
- 38 Tenant-Leaning · D+4
- County
- — inherits STATE
- City
- — inherits STATE
ZIP-level market 81022
- Home prices YoY
- 0.9%
- Active inventory
- 25
- Price-to-rent
- 4.9×
Monthly cashflow live
- Estimated rent
- $1,375 medium interval (Pro) →
- Mortgage (P&I)
- −$427
- Tax from tax record
- −$114 /mo · $1,368/yr
- Insurance
- −$34
- HOA
- −$0
- Vacancy / Maint / Mgmt
- −$289
- Net cashflow
- $511
Break-even live
Sensitivity live
| Price | -10% $557 | -5% $534 | +0% $511 | +5% $488 | +10% $465 |
|---|---|---|---|---|---|
| Rent | -10% $403 | -5% $457 | +0% $511 | +5% $566 | +10% $620 |
| Rate | -1.0pp $552 | -0.5pp $532 | base $511 | +0.5pp $490 | +1.0pp $469 |
UW: 25.0% down · 7.5% · 30yr · 1.5% tax · 5.0% vac · 8.0% maint · 8.0% mgmt
Financing live
Cash to close
- Down payment
- $20,362
- Closing costs
- $2,444
- Reserves months
- —
- Total cash needed
- —
Loan-product check · same deal, 3 products live
Conventional
25% down · 7.5% · 30yr
- Down + closing
- —
- Monthly P&I
- —
- Monthly cashflow
- —
- DSCR
- —
- Eligible?
- —
Personal DTI + credit; lowest rate.
DSCR
20% down · 8.5% · 30yr
- Down + closing
- —
- Monthly P&I
- —
- Monthly cashflow
- —
- DSCR
- —
- Eligible?
- —
No personal income docs; deal must DSCR.
Hard money
10% down · 12.0% · 12mo
- Down + closing
- —
- Monthly P&I
- —
- Monthly cashflow
- —
- DSCR
- —
- Eligible?
- —
Short-term bridge; refi at stabilization.
Listing history 18 events
-
2026-05-06status Pending
-
2026-05-02historical
-
2026-04-28price $81,450
-
2026-04-27status Active
-
2026-04-09status Active
-
2026-03-30historical
-
2026-02-18$112,000 Active
-
2026-02-01status Active
-
2026-01-08price $112,000
-
2025-12-08price $128,000
-
2025-10-22$160,000 Active
-
2021-01-08soldstatus $135,000
-
2021-01-06soldstatus $135,000 291-char remark
Show marketing remark (291 chars)
Nice Avondale rancher ready to move in. This home features 4 bedrooms, a spacious living room and kitchen as well as a nice fully fenced yard. The detached garage is the perfect man cave. Lots of off road parking. An irrigation well can be used to water if desired. Come see this home today.
-
2020-08-25$144,900 291-char remark
Show marketing remark (291 chars)
Nice Avondale rancher ready to move in. This home features 4 bedrooms, a spacious living room and kitchen as well as a nice fully fenced yard. The detached garage is the perfect man cave. Lots of off road parking. An irrigation well can be used to water if desired. Come see this home today.
-
2016-04-05soldstatus $87,900
-
2016-04-04soldstatus $87,900
-
2015-08-07$87,900
-
1993-12-22soldstatus $39,900
ⓘ Source: listings_history table (triggers on properties + properties_extension) + one-shot
backfill from property_details.listing_events for pre-trigger history.
Tax reassessment forecast CO · Resets to sale price
- Current annual tax
- $1,368 · $114/mo
- Projected year-2 tax
- $1,368 · $114/mo
- Expected delta
- $0/yr ($0/mo · 0.0%)
ⓘ Screening estimate from a state-policy table — verify with the county assessor before closing.
Climate risk First Street
- Flood 1/10 Low FEMA zone X (unshaded) · 0% chance over 30 yrs
- Wildfire 4/10 Moderate
- Heat 4/10 Moderate 7 d/yr ≥97°F today · 21 d/yr by 30 yrs out
- Wind 2/10 Low
- Air quality 1/10 Low 0 unhealthy d/yr today · 0 by 30 yrs out
Nearby sold comps map
Loading sold comps map…
Walkable amenities ~0.75 mi
Loading nearby amenities…
Taxation est. · year 1
- Rental income
- $16,502
- − Mortgage interest
- −$4,562
- − Property taxes
- −$1,368
- − Insurance
- −$407
- − Repairs & maintenance
- −$1,320
- − Management
- −$1,320
- − Depreciation
- −$2,369
- Taxable income
- $5,154
- Est. tax owed @ 24.0%
- −$1,237
- After-tax cash flow
- $4,898/yr
For passive investors: Depreciation is non-cash, so a rental often shows a tax loss while cash-flowing — sheltering income. Rental losses are passive: they offset passive income freely, and up to $25,000/yr can offset ordinary (W-2) income if you actively participate and your MAGI is under $100k (phasing out to $0 by $150k); unused losses carry forward. On sale, claimed depreciation is recaptured at up to 25%, and gains may owe capital-gains tax (a 1031 exchange can defer both). Figures are a year-1 estimate at your 24.0% rate — not tax advice; consult a CPA.
Schools (NCES district)
- District
- Pueblo County School District 70
- NCES district ID
- 0806150
- Math proficiency
- 24% ▼ -4.00%
- Reading proficiency
- 43% ▼ -2.00%
- Median HH income
- $59,438
- Composite
- 29.93/100
- National rank
- #6381
- State rank
- #40 of 86 in CO
Livability — Avondale
- Score
- 60/100
- State rank
- #255
- US rank
- #19405
Category grades
Schools grade is shown separately in the Schools card above.
Census & demographics
- Census place
- Avondale, CO
- Population (ZIP)
- 1,351
Population outlook (Pueblo County) Hauer SSP2
- Today (2025)
- 173,240 people
- By 2030
- 177,716 · +2.6%
- By 2040
- 185,125 · +6.9%
- By 2050
- 190,642 · +10.0%
- By 2075
- 201,611 · +16.4%
- By 2100
- 196,443 · +13.4%
Race, ethnicity, and origin ACS 2023
- Neighborhood character
- Majority White (53%)
- Race & ethnicity
- White 53% Hispanic / Latino 43% Two or more races 29%
- Hispanic origin (detail)
- Mexican 35%
- Common ancestry
- Romanian 5% Slovak 1% Italian 1%
- Foreign-born
- 8% · Canada
- Languages at home
- 74% English-only · Spanish 24% German/W. Germanic 2%
Political lean MEDSL · Pueblo
- 2024 margin
- Lean R (+5.1) · D 46.2% · R 51.3% · Other 2.5%
- 2008→2024 swing
- -20.1pp toward R · 2008: 15.0pp · 2024: -5.1pp
- All cycles
- 2024: R+5.1 2020: D+1.7 2016: D+0.3 2012: D+13.1 2008: D+15.0
Not yet ingested
- Civics
- —
Market trends
- HPI YoY
- ▲ 2.58%
- Current HPI
- 303.037
- Rent YoY
- —
- Metro
- —
- State GDP YoY
- ▲ 1.95%
- F500 in state
- 14
Industry mix (Fortune 500 HQ in CO)
| Industry | F500 HQs | Revenue |
|---|---|---|
| Technology Distribution | 1 | $31B |
|
||
| Food / Agriculture | 1 | $18B |
|
||
| Packaging | 1 | $14B |
|
||
| Healthcare | 1 | $13B |
|
||
| Energy | 1 | $10B |
|
||
| Technology | 1 | $4B |
|
||
Price history
+104.1% since first listed18 events — show timeline
- 2026-05-06 Pending — PARMLS
- 2026-05-02 Listing Removed — IRES
- 2026-04-28 Price Changed $81,450 PARMLS
- 2026-04-27 Relisted — PARMLS
- 2026-04-09 Relisted — IRES
- 2026-03-30 Listing Removed — IRES
- 2026-02-18 Listed $112,000 IRES
- 2026-02-01 Relisted — PARMLS
- 2026-01-08 Price Changed $112,000 PARMLS
- 2025-12-08 Price Changed $128,000 PARMLS
- 2025-10-22 Listed $160,000 PARMLS
- 2021-01-08 Sold (Public Records) $135,000 Public Records
- 2021-01-06 Sold (MLS) $135,000 PARMLS
- 2020-08-25 Listed $144,900 PARMLS
- 2016-04-05 Sold (Public Records) $87,900 Public Records
- 2016-04-04 Sold (MLS) $87,900 PARMLS
- 2015-08-07 Listed $87,900 PARMLS
- 1993-12-22 Sold (Public Records) $39,900 Public Records
Property tax history
+6.7%/yrLatest (2025): $1,368 · +28.1% YoY. Source: county tax records.
Cash-flow waterfall
monthlySold comps — $/sqft
last 12 mo · ≤1 miLoading sold comps…