 Fourplex
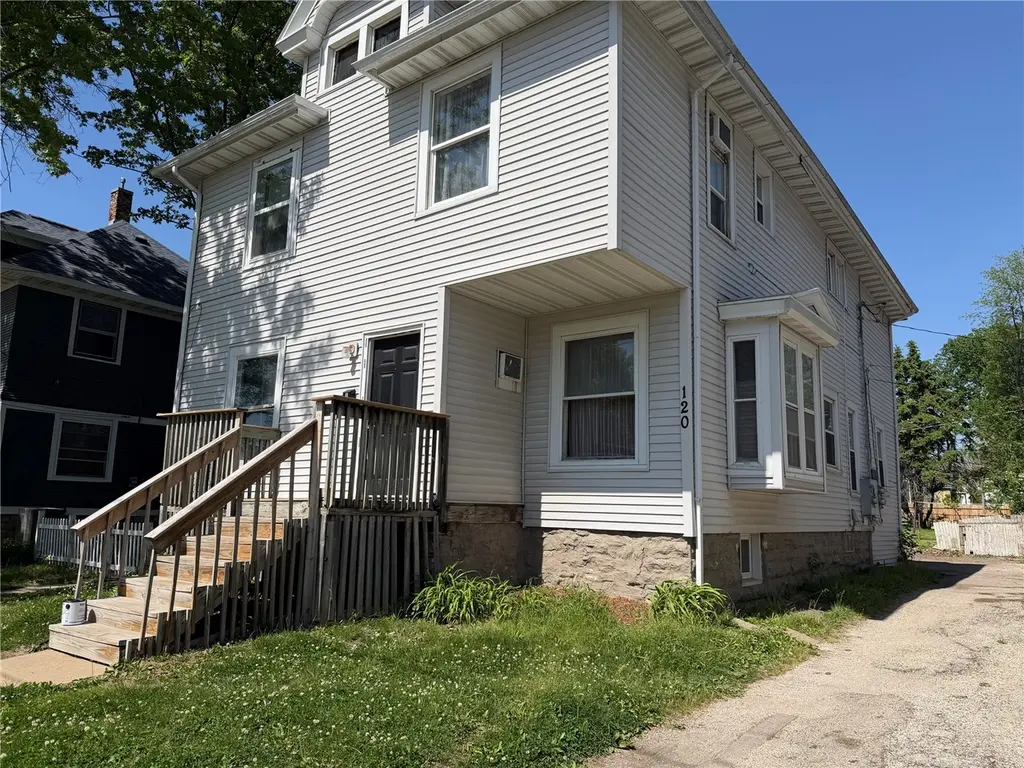
120 17th St NE · Cedar Rapids, IA
Flood risk 1/10 · Minimal
- FEMA flood zone
- X (unshaded)
- Chance of flooding over 30 yrs
- 0.0%
- Est. flood insurance / yr
- $473 – $860
Fire risk 1/10 · Minimal
- Est. fire insurance / yr
- $902 – $1,676
Heat risk 3/10 · Minor
- Hot days now (above 104°F)
- 7 days/yr
- Hot days in 30 yrs
- 15 days/yr
Wind risk 2/10 · Minimal
- Chance of severe wind over 30 yrs
- —
Air-quality risk 2/10 · Minimal
- Unhealthy air days now
- 1 days/yr
- Unhealthy air days in 30 yrs
- 2 days/yr
Risk factors via First Street. Map © Google.
Why this score? — see what drove the B grade
The composite is a weighted blend of 9 inputs, each scored 0–100. Each bar is that input's sub-score; the figure is the points it added to the 100-point composite (weight × sub-score).
- Cash flow +30.0/30.0
- 1% rule +10.0/10.0
- DSCR +10.0/10.0
- ARV discount +6.9/15.0
- Rent growth +5.0/5.0
- Schools +4.7/10.0
- Livability +3.9/5.0
- Condition / age +2.0/5.0
- Appreciation +0.0/10.0
$180,000
🖨 Deal sheet 📄 Offer letter ✓ Due diligence
Multi-family units
County records classify this as Multi-Family (2-4 Unit). Listing-text estimate: 4 units. confirmed
Listing remarks MLS
This 4 unit property brings in $27,300 (gross income) a year with the potential for more! There are 3 one bedroom units and 1 two bedroom unit. If you have thought about investing this is the one! Call for a private showing today
Key facts
- Recent updates
- Renovated kitchens
- Fresh paint
Tags
Property features AI
Finance
- Other: Listed by SKOGMAN REALTY
- Financial info: Annual tax approximately $2,385
Exterior
- Utilities: Public water service; Public sewer service
- Home design: Multi-family residential income property
- Construction: Frame construction with vinyl siding
- Exterior features: Lot approximately 50 x 100; Public water; Public sewer
Interior
- Heating & cooling: Natural gas heating; Window and wall/window cooling units
- Interior features: Full basement
Neighborhood map
What this means for you Summary
Snapshot
- This is a 3×1bd/1ba + 1×2bd/1ba units multifamily listed at $180k. Condition is rated fair.
Deal economics
- At list price, monthly cash flow is $2k ($21k/yr) — positive. Per door: $447/mo.
- The deal already cash-flows at list — no discount required.
- Meets the 1% rule at list price ($4k rent vs $180k).
- Cap rate 18.2% vs local median 3.5% in Cedar Rapids — top-decile yield for the area; either an underpriced asset or a hidden risk that comps aren't pricing in. Stress-test before assuming the spread holds.
Location & tenants
- Location reads 78/100 on livability (#134 in IA, #2,474 nationally) — a middle-class / working-renter tenant base. Strengths: cost of living A+, housing A+, health & safety A+; Watch: crime C-, commute F.
- Cedar Rapids Community School District (urban): math 50% / reading 59% proficiency, ranked #265 of 289 in IA (top 92%) — acceptable for families but not a draw, mixed tenant base, ~2y average lease.
- Zoned schools: Franklin Middle School (math 49% / reading 59%, grade B-, #206 of 246 statewide, top 84%, 537 students, 56% FRL); George Washington High School (math 44% / reading 62%, grade C-, #296 of 336 statewide, top 88%, 1,291 students, 49% FRL).
- Market conditions: Rents rising fast (+11.0%/yr); 286 active listings in the ZIP; 1,023 units permitted in Linn County in 2024 (456 in 5+ unit buildings).
- At $3,839/mo this rent would consume 63% of the median local household income ($73k/yr) (locally 971% of renters already pay >50% of income on rent) — very limited rent-growth headroom before tenants either downsize or default.
Forward outlook
- Local home prices are declining (-3.0%/yr); year-one equity from $1k of loan paydown is wiped out by about $5k of value loss. Plan a longer hold.
- Linn County population projected at +16% by 2050 — long-run rental-demand tailwind backs the buy-and-hold thesis.
- At projected returns (-3.0% appreciation + 8.0% rent growth), your $50k cash investment doubles in ~3 years — after that, you're playing with house money.
Negotiation context
- Only 13 days on market — expect competitive offers; lowballing is unlikely to land.
- 2 sale attempts since 6y ago with the ask held roughly flat each time — persistent listings suggest the price (not the market) is what's stuck; bring a comps-based counter.
- Current owner paid $105k; list at $180k implies a 71% gain — meaningful room to come down on a strong offer.
Risks & watch-outs
- Watch-outs: built in 1900 — expect roof / HVAC / electrical / plumbing capex.
Questions for the listing agent
- Can we see the unit-by-unit rent roll, current vacancy, and any below-market leases? What's the average tenancy length?
- What capital expenditures (roof, boiler, parking lot, exteriors) have been made in the last 5 years, and what's planned in the next 2?
- Have any recent inspections been done? Can we get a copy of the seller's disclosures and any deferred-maintenance estimates?
- Built in 1900 — when were the roof, HVAC, electrical panel, plumbing, and water heater last replaced?
- Is there a deadline driving the sale (1031 exchange, divorce, estate, relocation)? That informs how much negotiation room exists.
- Schools are B-rated — typically a magnet for longer-tenancy family renters. What's the average tenant stay here, and is there a school-zone premium baked into asking?
- What's the average days-on-market for RENTAL listings here right now (not sales)? A rising rental-DOM trend means longer vacancies and softer asking-rent achievability than the comps imply.
- What's the recent tenant-quality profile in this submarket — average credit score on applications, eviction rate, late-payment / NSF rate, and stable-employment percentage? A property-management company in the area should have these aggregated.
- How much new apartment / multifamily construction is in the pipeline within 1–3 miles? Heavy new supply (>2% of stock underway) typically softens rents 12–24 months out; light construction supports rent growth.
Investment metrics
- 1% rule
- 2.13% ✓
- Cap rate
- 18.22%
- Cash-on-cash
- 42.59%
- DSCR
- 2.90
- GRM
- 3.9
CMA / ARV
- ARV (on-the-fly)
- $177,448
- Comps found
- 7
Show comp detail 7 sales within ~0.75 mi
| Address | Dist | Beds/Ba | Sqft | Sold | Price | $/sf | Match |
|---|---|---|---|---|---|---|---|
| 1638 B Ave Ave NE | 0.12mi | —/3.0 | 2,251 (+4%) | 9mo | $195,000 | $87 | 80 |
| 116 17th St NE | 0.01mi | —/— | 2,438 (+13%) | 6mo | $200,000 | $82 | 74 |
| 1735 C Ave NE | 0.17mi | —/— | 2,368 (+9%) | 7mo | $240,000 | $101 | 71 |
| 1534 3rd Ave SE | 0.27mi | —/— | 2,080 (-4%) | 19mo | $135,000 | $65 | 65 |
| 302 14th St NE | 0.37mi | —/— | 2,235 (+3%) | 18mo | $57,500 | $26 | 62 |
| 118 16th St NE | 0.12mi | —/— | 1,970 (-9%) | 22mo | $120,000 | $61 | 61 |
| 1211 5th Ave SE | 0.69mi | —/— | 1,856 (-14%) | 21mo | $160,000 | $86 | 27 |
Match score weights: distance 35% · size 25% · config 20% · recency 20%. Top-matched comps best support the ARV.
Projected returns pro-forma
-3.0% appreciation · 8.0% rent growth · sell at horizon
- IRR
- 44.9%
- Equity multiple
- 3.09×
- Total profit
- $105,113
- Equity at exit
- $26,839
- IRR
- 53.0%
- Equity multiple
- 7.56×
- Total profit
- $330,814
- Equity at exit
- $15,563
Cash invested: $50,400 (down + closing). Projections, not guarantees.
Landlord ↔ Tenant lean methodology
- Overall (STATE)
- 83 Strongly Landlord-Friendly
- State Iowa
- 83 Strongly Landlord-Friendly · R+6
- County
- — inherits STATE
- City
- — inherits STATE
ZIP-level market 52402
- Rents YoY
- 11.0%
- Active inventory
- 286
- Price-to-rent
- 16.4×
Monthly cashflow live
- Estimated rent
- $3,839 medium interval (Pro) →
- Mortgage (P&I)
- −$944
- Tax est. 1.5%
- −$225 /mo · $2,700/yr
- Insurance
- −$75
- HOA
- −$0
- Vacancy / Maint / Mgmt
- −$806
- Net cashflow
- $1,789
Break-even live
4-unit breakdown (identical units grouped — click to expand)
| Units | Beds | Baths | Est. rent |
|---|---|---|---|
| 3× units | 1 | 1 | $2,751 |
| #1 | 1 | 1 | $917 |
| #2 | 1 | 1 | $917 |
| #3 | 1 | 1 | $917 |
| 1× unit | 2 | 1 | $1,088 |
| Total (4 units) | $3,839 | ||
UW: 25.0% down · 7.5% · 30yr · 1.5% tax · 5.0% vac · 8.0% maint · 8.0% mgmt
Financing live
Cash to close
- Down payment
- $45,000
- Closing costs
- $5,400
- Reserves months
- —
- Total cash needed
- —
Loan-product check · same deal, 3 products live
Conventional
25% down · 7.5% · 30yr
- Down + closing
- —
- Monthly P&I
- —
- Monthly cashflow
- —
- DSCR
- —
- Eligible?
- —
Personal DTI + credit; lowest rate.
DSCR
20% down · 8.5% · 30yr
- Down + closing
- —
- Monthly P&I
- —
- Monthly cashflow
- —
- DSCR
- —
- Eligible?
- —
No personal income docs; deal must DSCR.
Hard money
10% down · 12.0% · 12mo
- Down + closing
- —
- Monthly P&I
- —
- Monthly cashflow
- —
- DSCR
- —
- Eligible?
- —
Short-term bridge; refi at stabilization.
Listing history 6 events
-
2026-05-31status $180,000 Pending 13 DOM
-
2026-05-31days on market $180,000 Active 13 DOM
-
2026-05-30days on market $180,000 Active 12 DOM
-
2026-05-15$180,000 Active
-
2021-01-11soldstatus $105,000 229-char remark
Show marketing remark (229 chars)
This 4 unit property brings in $27,300 (gross income) a year with the potential for more! There are 3 one bedroom units and 1 two bedroom unit. If you have thought about investing this is the one! Call for a private showing today
-
2020-08-24$114,000 229-char remark
Show marketing remark (229 chars)
This 4 unit property brings in $27,300 (gross income) a year with the potential for more! There are 3 one bedroom units and 1 two bedroom unit. If you have thought about investing this is the one! Call for a private showing today
ⓘ Source: listings_history table (triggers on properties + properties_extension) + one-shot
backfill from property_details.listing_events for pre-trigger history.
Climate risk First Street
- Flood 1/10 Low FEMA zone X (unshaded) · 0% chance over 30 yrs
- Wildfire 1/10 Low
- Heat 3/10 Moderate 7 d/yr ≥104°F today · 15 d/yr by 30 yrs out
- Wind 2/10 Low
- Air quality 2/10 Low 1 unhealthy d/yr today · 2 by 30 yrs out
Nearby sold comps map
Loading sold comps map…
Walkable amenities ~0.75 mi
Loading nearby amenities…
Taxation est. · year 1
- Rental income
- $46,068
- − Mortgage interest
- −$10,083
- − Property taxes
- −$2,700
- − Insurance
- −$900
- − Repairs & maintenance
- −$3,685
- − Management
- −$3,685
- − Depreciation
- −$5,236
- Taxable income
- $19,778
- Est. tax owed @ 24.0%
- −$4,747
- After-tax cash flow
- $16,720/yr
For passive investors: Depreciation is non-cash, so a rental often shows a tax loss while cash-flowing — sheltering income. Rental losses are passive: they offset passive income freely, and up to $25,000/yr can offset ordinary (W-2) income if you actively participate and your MAGI is under $100k (phasing out to $0 by $150k); unused losses carry forward. On sale, claimed depreciation is recaptured at up to 25%, and gains may owe capital-gains tax (a 1031 exchange can defer both). Figures are a year-1 estimate at your 24.0% rate — not tax advice; consult a CPA.
Condition & rehab AI · 1 photo
This fourplex requires significant exterior and interior repairs to improve its condition and value. Immediate updates to the exterior siding, flooring, and interior walls would significantly enhance its appeal and marketability.
Repairs flagged
- Major exterior siding — Significant wear and tear
- Major flooring — Worn and uneven
- Major interior walls/paint — Painted but appears old and dull
Value-add opportunities
- Both paint exterior — Enhances curb appeal and value
- Both repair flooring — Improves living conditions and rental appeal
- Both paint interior walls — Freshens the interior and enhances rental appeal
Renovation cost estimate screening
| Repair item | Severity | Est. cost |
|---|---|---|
| exterior siding · Significant wear and tear | Major | $15,000–50,000 |
| flooring · Worn and uneven | Major | $15,000–50,000 |
| interior walls/paint · Painted but appears old and dull | Major | $15,000–50,000 |
| Total estimated repair cost · 3 items | $45,000–150,000 |
Value-add ROI direction
- Both paint exterior — Enhances curb appeal and value ↑
- Both repair flooring — Improves living conditions and rental appeal ↑
- Both paint interior walls — Freshens the interior and enhances rental appeal ↑
ⓘ Cost ranges are severity-bucket heuristics (US national rule-of-thumb). Get contractor quotes + a written scope before underwriting a rehab budget.
Schools (NCES district)
- District
- Cedar Rapids Community School District
- NCES district ID
- 1906540
- Math proficiency
- 50% ▼ -12.00%
- Reading proficiency
- 59% ▼ -6.00%
- Median HH income
- $53,568
- Composite
- 46.82/100
- National rank
- #2378
- State rank
- #265 of 289 in IA
Livability — Cedar Rapids
- Score
- 78/100
- State rank
- #134
- US rank
- #2474
Category grades
Schools grade is shown separately in the Schools card above.
Census & demographics
- Census place
- Cedar Rapids, IA
- County
- Linn County · 179,860 people
- City population
- 137,154
- Metro
- Cedar Rapids, IA
- Population (ZIP)
- 42,938
- Household income
- $73,439
- Rent vs Own
- Severe rent burden
- 971.0
Population outlook (Linn County) Hauer SSP2
- Today (2025)
- 239,589 people
- By 2030
- 248,587 · +3.8%
- By 2040
- 264,817 · +10.5%
- By 2050
- 278,685 · +16.3%
- By 2075
- 311,754 · +30.1%
- By 2100
- 336,773 · +40.6%
Race, ethnicity, and origin ACS 2023
- Neighborhood character
- Predominantly White (77%)
- Race & ethnicity
- White 77% Two or more races 7% Black 6% Asian 6% Hispanic / Latino 4%
- Common ancestry
- Portuguese 4% Lithuanian 2% Iranian 2%
- Foreign-born
- 8% · Canada, Philippines, China
- Languages at home
- 89% English-only · Spanish 3% Other Indo-European 3% Other Asian/Pacific 2%
Political lean MEDSL · Linn
- 2024 margin
- Lean D (+9.9) · D 54.2% · R 44.3% · Other 1.4%
- 2008→2024 swing
- -11.6pp toward R · 2008: 21.5pp · 2024: 9.9pp
- All cycles
- 2024: D+9.9 2020: D+13.7 2016: D+9.0 2012: D+17.6 2008: D+21.5
Not yet ingested
- Civics
- —
Market trends
- HPI YoY
- ▼ -133.31%
- Current HPI
- 201.7061
- Rent YoY
- ▲ 10.97%
- Metro
- Cedar Rapids, IA
- State GDP YoY
- ▲ 2.48%
- F500 in state
- 4
Industry mix (Fortune 500 HQ in IA)
| Industry | F500 HQs | Revenue |
|---|---|---|
| Financial Services | 1 | $16B |
|
||
| Retail / Convenience | 1 | $15B |
|
||
Price history
+57.9% since first listed3 events — show timeline
- 2026-05-15 Listed $180,000 CRAAR, CDRMLS
- 2021-01-11 Sold (MLS) $105,000 CRAAR, CDRMLS
- 2020-08-24 Listed $114,000 CRAAR, CDRMLS
Cash-flow waterfall
monthlySold comps — $/sqft
last 12 mo · ≤1 miLoading sold comps…