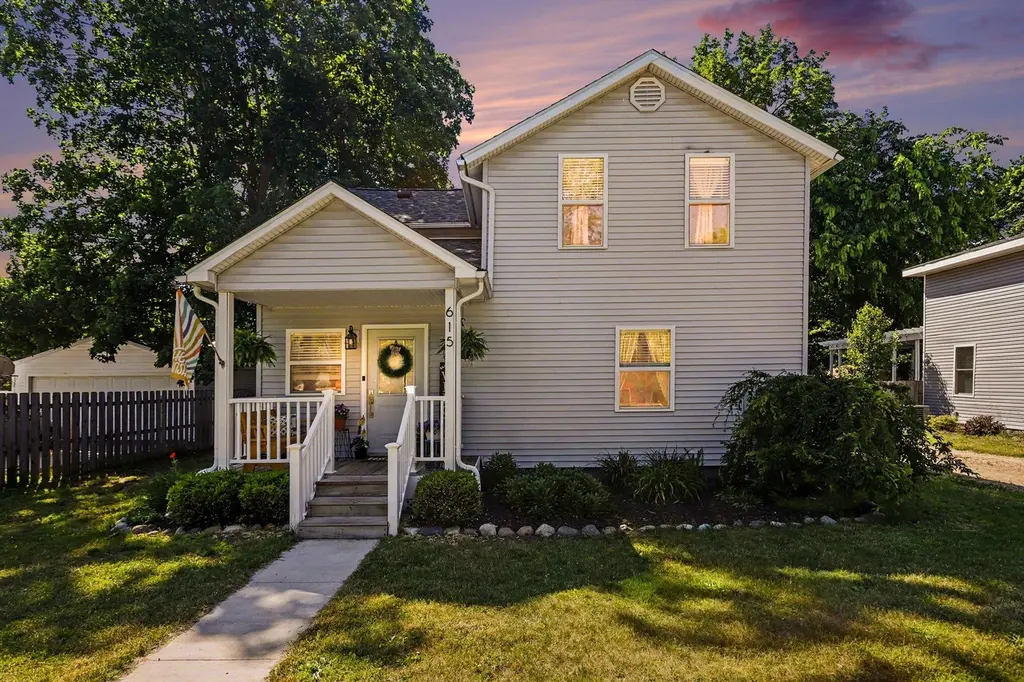
615 N Main St · Allegan, MI
Flood risk 1/10 · Minimal
- FEMA flood zone
- X (unshaded)
- Chance of flooding over 30 yrs
- 0.0%
- Est. flood insurance / yr
- $473 – $860
Fire risk 3/10 · Minor
- Est. fire insurance / yr
- $784 – $1,456
Heat risk 2/10 · Minimal
- Hot days now (above 97°F)
- 7 days/yr
- Hot days in 30 yrs
- 16 days/yr
Wind risk 2/10 · Minimal
- Chance of severe wind over 30 yrs
- —
Air-quality risk 2/10 · Minimal
- Unhealthy air days now
- 1 days/yr
- Unhealthy air days in 30 yrs
- 2 days/yr
Risk factors via First Street. Map © Google.
Why this score? — see what drove the D+ grade
The composite is a weighted blend of 9 inputs, each scored 0–100. Each bar is that input's sub-score; the figure is the points it added to the 100-point composite (weight × sub-score).
- Cash flow +16.7/30.0
- ARV discount +8.8/15.0
- DSCR +5.2/10.0
- 1% rule +4.5/10.0
- Livability +3.5/5.0
- Schools +2.7/10.0
- Rent growth +2.5/5.0
- Condition / age +2.5/5.0
- Appreciation +0.0/10.0
$224,900
🖨 Deal sheet (PDF) 📄 Offer letter ✓ Due diligence
Listing remarks MLS
Welcome home to this beautifully maintained 3-bedroom, 2.5-bath traditional two-story home offering 1,412 square feet of thoughtfully designed living space. The desirable main-floor primary suite provides comfort and convenience with a private full bath and spacious closet. The heart of the home is the open-concept kitchen featuring granite countertops, stainless steel appliances, a center island, and abundant cabinet space. The kitchen flows seamlessly into the dining and living areas, creating the perfect setting for both everyday living and entertaining. Upstairs, you'll find two additional bedrooms and a full bath, providing plenty of space for family, guests, or a home office. Step outside and enjoy the inviting covered front porch, expansive deck, and fenced backyard--ideal for relaxing, gardening, entertaining, or enjoying Michigan summers. From the charming outdoor spaces to the warm and welcoming interior, this home offers the perfect blend of comfort,
Key facts
- Covered front porch
- Open-concept kitchen
- Fenced backyard
Tags
Property features AI
Exterior
- Utilities: Public water; Natural gas available and connected; Electricity available
- Home design: Traditional-style single family residence; One or more stories (Traditional design)
- Construction: Built in 1900; Vinyl siding; Composition roof; Partial Michigan basement
- Exterior features: Paved road access; Yard with shed(s)
Interior
- Kitchen: Dishwasher; Microwave; Range; Refrigerator
- Bedrooms: Primary bedroom; Two additional bedrooms
- Bathrooms: Two full bathrooms; One half bathroom
- Heating & cooling: Forced air heating; Central cooling
- Interior features: Total of 9 rooms; Michigan-style partial basement
- Laundry & utility: Washer; Dryer; Dedicated laundry room
Neighborhood map
What this means for you Summary
Snapshot
- This is a 3-bed/2.5-bath single-family listed at $225k.
Deal economics
- At list price, monthly cash flow is $142 ($2k/yr) — positive.
- The deal already cash-flows at list — no discount required.
- To meet the 1% rule (rent ≥ 1% of price), the offer needs to be $215k (4.5% below list).
- Recommended offer: $215k (4.5% below list) — sets the bar for 1% rule.
- Cap rate 7.1% vs local median 4.8% in Allegan — top-decile yield for the area; either an underpriced asset or a hidden risk that comps aren't pricing in. Stress-test before assuming the spread holds.
Location & tenants
- Location reads 70/100 on livability (#318 in MI) — a middle-class / working-renter tenant base. Strengths: crime A+, cost of living A+, housing A+; Watch: employment D+, amenities F, commute F.
- Allegan Public Schools (town): math 26% / reading 37% proficiency, ranked #338 of 540 in MI (top 63%) — families likely to look elsewhere, expect single-tenant / working-renter base with shorter leases.
- Zoned schools: North Ward Elementary School (34 students, 53% FRL); Le White Middle School (math 23% / reading 37%, grade F, #337 of 493 statewide, top 69%, 447 students, 69% FRL); Allegan High School (math 22% / reading 42%, grade F, #405 of 713 statewide, top 59%, 648 students, 55% FRL).
- Market conditions: 185 active listings in the ZIP; 5 comparable units currently listed for rent nearby; rentals lingering (median 46d on market — plan ~5-8 weeks vacancy on turnover, expect pricing pressure); 60% of comp listings sitting > 30 days — soft ceiling on asking rent; 419 units permitted in Allegan County in 2024 (0 in 5+ unit buildings).
Forward outlook
- Local home prices are declining (-3.0%/yr); year-one equity from $2k of loan paydown is wiped out by about $7k of value loss. Plan a longer hold.
Negotiation context
- Only 2 days on market — expect competitive offers; lowballing is unlikely to land.
- 9 sale attempts since 9y ago with the ask held roughly flat each time — persistent listings suggest the price (not the market) is what's stuck; bring a comps-based counter.
- Current owner paid $173k; 30% above their basis — modest negotiation headroom, anchor on the comps not their cost.
Risks & watch-outs
- Watch-outs: built in 1900 — expect roof / HVAC / electrical / plumbing capex.
Questions for the listing agent
- Built in 1900 — when were the roof, HVAC, electrical panel, plumbing, and water heater last replaced?
- Is there a deadline driving the sale (1031 exchange, divorce, estate, relocation)? That informs how much negotiation room exists.
- Schools are D-rated, which usually means shorter tenancies and higher turnover. Who's the typical renter profile here, and what's been the actual vacancy rate?
- The area grade is low — what's the realistic commute time and amenity access for the typical tenant pool here? Any planned neighborhood developments (good or bad) we should know about?
- What's the average days-on-market for RENTAL listings here right now (not sales)? A rising rental-DOM trend means longer vacancies and softer asking-rent achievability than the comps imply.
- What's the recent tenant-quality profile in this submarket — average credit score on applications, eviction rate, late-payment / NSF rate, and stable-employment percentage? A property-management company in the area should have these aggregated.
- How much new for-sale + rental construction is in the pipeline within 1–3 miles? Heavy new supply typically softens prices + rents 12–24 months out; constrained supply supports both.
Investment metrics
- 1% rule
- 0.95% ✗
- Cap rate
- 7.05%
- Cash-on-cash
- 2.70%
- DSCR
- 1.12
- GRM
- 8.7
CMA / ARV
- ARV (on-the-fly)
- $231,568
- Comps found
- 12
Show comp detail 12 sales within ~0.75 mi
| Address | Dist | Beds/Ba | Sqft | Sold | Price | $/sf | Match |
|---|---|---|---|---|---|---|---|
| 234 N Eastern Ave | 0.38mi | 3/1.0 | 1,400 (-1%) | 2mo | $229,900 | $164 | 73 |
| 301 Grand St | 0.40mi | 3/2.0 | 1,366 (-3%) | 2mo | $290,000 | $212 | 72 |
| 124 Briggs St | 0.11mi | 3/1.5 | 1,510 (+7%) | 13mo | $211,500 | $140 | 68 |
| 223 North St | 0.41mi | 3/1.5 | 1,512 (+7%) | 2mo | $158,000 | $104 | 63 |
| 151 Park Ave | 0.51mi | 3/2.0 | 1,440 (+2%) | 12mo | $245,000 | $170 | 61 |
| 159 Park Ave | 0.49mi | 3/2.0 | 1,391 (-2%) | 18mo | $239,900 | $172 | 58 |
| 104 Grand St | 0.53mi | 3/3.0 | 1,328 (-6%) | 7mo | $149,000 | $112 | 58 |
| 420 N Main St | 0.23mi | 3/2.0 | 1,268 (-10%) | 16mo | $208,000 | $164 | 57 |
| 225 Ida St | 0.19mi | 4/2.0 (+1) | 1,620 (+15%) | 7mo | $225,000 | $139 | 54 |
| 228 River St | 0.40mi | 2/2.0 (-1) | 1,300 (-8%) | 11mo | $215,000 | $165 | 52 |
| 124 Park Ave | 0.56mi | 3/1.0 | 1,320 (-6%) | 6mo | $106,000 | $80 | 52 |
| 161 North St | 0.34mi | 2/1.0 (-1) | 1,230 (-13%) | 1mo | $179,900 | $146 | 51 |
Match score weights: distance 35% · size 25% · config 20% · recency 20%. Top-matched comps best support the ARV.
Projected returns pro-forma
-3.0% appreciation · 3.0% rent growth · sell at horizon
- IRR
- -12.0%
- Equity multiple
- 0.57×
- Total profit
- $-27,374
- Equity at exit
- $33,533
- IRR
- -2.8%
- Equity multiple
- 0.81×
- Total profit
- $-12,068
- Equity at exit
- $19,445
Cash invested: $62,972 (down + closing). Projections, not guarantees.
Landlord ↔ Tenant lean methodology
- Overall (STATE)
- 62 Landlord-Friendly
- State Michigan
- 62 Landlord-Friendly · EVEN
- County
- — inherits STATE
- City
- — inherits STATE
ZIP-level market 49010
- Home prices YoY
- -34.3%
- Active inventory
- 185
- Price-to-rent
- 8.7×
Monthly cashflow live
- Estimated rent
- $2,147 high interval (Pro) →
- Mortgage (P&I)
- −$1,179
- Tax est. 1.5%
- −$281 /mo · $3,374/yr
- Insurance
- −$94
- HOA
- −$0
- Vacancy / Maint / Mgmt
- −$451
- Net cashflow
- $142
Break-even live
Sensitivity live
| Price | -10% $297 | -5% $220 | +0% $142 | +5% $64 | +10% $-14 |
|---|---|---|---|---|---|
| Rent | -10% $-28 | -5% $57 | +0% $142 | +5% $227 | +10% $312 |
| Rate | -1.0pp $255 | -0.5pp $199 | base $142 | +0.5pp $84 | +1.0pp $24 |
UW: 25.0% down · 7.5% · 30yr · 1.5% tax · 5.0% vac · 8.0% maint · 8.0% mgmt
Financing live
Cash to close
- Down payment
- $56,225
- Closing costs
- $6,747
- Reserves months
- —
- Total cash needed
- —
Loan-product check · same deal, 3 products live
Conventional
25% down · 7.5% · 30yr
- Down + closing
- —
- Monthly P&I
- —
- Monthly cashflow
- —
- DSCR
- —
- Eligible?
- —
Personal DTI + credit; lowest rate.
DSCR
20% down · 8.5% · 30yr
- Down + closing
- —
- Monthly P&I
- —
- Monthly cashflow
- —
- DSCR
- —
- Eligible?
- —
No personal income docs; deal must DSCR.
Hard money
10% down · 12.0% · 12mo
- Down + closing
- —
- Monthly P&I
- —
- Monthly cashflow
- —
- DSCR
- —
- Eligible?
- —
Short-term bridge; refi at stabilization.
Rent comps 5 comps
| Address | Beds | Baths | Sqft | Rent | $/sqft | DOM | Units | Dist |
|---|---|---|---|---|---|---|---|---|
| 201 Monroe St Unit 1 Allegan, MI | 3.0 | 2.0 | 1700 | $2,000 | $1.18 | 23d | 1 | 0.67mi |
| 3228 Babylon Rd Allegan, MI | 2.0 | 1.0 | 1200 | $1,750 | $1.46 | 45d | 1 | 1.15mi |
| 364 Sherman St Allegan, MI | 3.0 | 2.5 | 1800 | $2,795 | $1.55 | 45d | 1 | 1.21mi |
| 364 Sherman St Allegan, MI | 3.0 | 2.5 | 1800 | $2,495 | $1.39 | 23d | 1 | 1.21mi |
| 3240 Babylon Rd Allegan, MI | 4.0 | 1.0 | 1700 | $1,900 | $1.12 | 45d | 1 | 1.22mi |
Listing history 2 events
-
2026-06-07remarks 699-char remark
-
2026-06-07$224,900 Pending 2 DOM
ⓘ Source: listings_history table (triggers on properties + properties_extension) + one-shot
backfill from property_details.listing_events for pre-trigger history.
Climate risk First Street
- Flood 1/10 Low FEMA zone X (unshaded) · 0% chance over 30 yrs
- Wildfire 3/10 Moderate
- Heat 2/10 Low 7 d/yr ≥97°F today · 16 d/yr by 30 yrs out
- Wind 2/10 Low
- Air quality 2/10 Low 1 unhealthy d/yr today · 2 by 30 yrs out
Nearby sold comps map
Loading sold comps map…
Walkable amenities ~0.75 mi
Loading nearby amenities…
Taxation est. · year 1
- Rental income
- $25,764
- − Mortgage interest
- −$12,598
- − Property taxes
- −$3,374
- − Insurance
- −$1,124
- − Repairs & maintenance
- −$2,061
- − Management
- −$2,061
- − Depreciation
- −$6,543
- Taxable loss
- −$1,997
- Est. tax savings @ 24.0%
- +$479
- After-tax cash flow
- $2,182/yr
For passive investors: Depreciation is non-cash, so a rental often shows a tax loss while cash-flowing — sheltering income. Rental losses are passive: they offset passive income freely, and up to $25,000/yr can offset ordinary (W-2) income if you actively participate and your MAGI is under $100k (phasing out to $0 by $150k); unused losses carry forward. On sale, claimed depreciation is recaptured at up to 25%, and gains may owe capital-gains tax (a 1031 exchange can defer both). Figures are a year-1 estimate at your 24.0% rate — not tax advice; consult a CPA.
Schools (NCES district)
- District
- Allegan Public Schools
- NCES district ID
- 2602220
- Math proficiency
- 26% ▼ -8.00%
- Reading proficiency
- 37% ▼ -7.00%
- Median HH income
- $48,602
- Composite
- 27.27/100
- National rank
- #7008
- State rank
- #338 of 540 in MI
Livability — Allegan
- Score
- 70/100
- State rank
- #318
- US rank
- #7767
Category grades
Schools grade is shown separately in the Schools card above.
Census & demographics
- Census place
- Allegan, MI
- Population (ZIP)
- 18,394
Population outlook (Allegan County) Hauer SSP2
- Today (2025)
- 120,251 people
- By 2030
- 122,204 · +1.6%
- By 2040
- 123,979 · +3.1%
- By 2050
- 122,340 · +1.7%
- By 2075
- 116,088 · -3.5%
- By 2100
- 98,461 · -18.1%
Race, ethnicity, and origin ACS 2023
- Neighborhood character
- Predominantly White (87%)
- Race & ethnicity
- White 87% Two or more races 8% Hispanic / Latino 5% Black 1%
- Common ancestry
- Iranian 10% Romanian 4% Italian 2%
- Foreign-born
- 2% · Canada, China
- Languages at home
- 98% English-only · Spanish 2%
Political lean MEDSL · Allegan
- 2024 margin
- Strong R (+27.2) · D 35.7% · R 62.9% · Other 1.5%
- 2008→2024 swing
- -16.5pp toward R · 2008: -10.7pp · 2024: -27.2pp
- All cycles
- 2024: R+27.2 2020: R+25.2 2016: R+28.8 2012: R+19.2 2008: R+10.7
Not yet ingested
- Civics
- —
Market trends
- HPI YoY
- ▼ -136.08%
- Current HPI
- 260.4976
- Rent YoY
- —
- Metro
- —
- State GDP YoY
- ▲ 1.37%
- F500 in state
- 28
Industry mix (Fortune 500 HQ in MI)
| Industry | F500 HQs | Revenue |
|---|---|---|
| Automotive Parts | 3 | $48B |
|
||
| Automotive | 2 | $372B |
|
||
| Chemicals | 1 | $45B |
|
||
| Automotive Retail | 1 | $29B |
|
||
| Healthcare / Medical Devices | 1 | $23B |
|
||
| Automotive Technology | 1 | $20B |
|
||
Price history
+1030.2% since first listed22 events — show timeline
- 2026-06-06 Pending — MiRealSource-MiMLS
- 2026-06-06 Pending — REALCOMP
- 2026-06-06 Pending — SW Michigan MLS
- 2026-06-04 Listed $224,900 SW Michigan MLS
- 2026-06-04 Listed $224,900 REALCOMP
- 2026-06-04 Listed $224,900 MiRealSource-MiMLS
- 2020-09-08 Sold (Public Records) $173,100 Public Records
- 2020-07-30 Sold (MLS) $173,100 SW Michigan MLS
- 2020-07-30 Sold (MLS) $173,100 REALCOMP
- 2020-06-24 Pending — SW Michigan MLS
- 2020-06-19 Listed $169,900 MiRealSource-MiMLS
- 2020-06-19 Listed $169,900 SW Michigan MLS
- 2020-06-19 Listed $169,900 REALCOMP
- 2017-03-29 Sold (MLS) $18,000 SW Michigan MLS
- 2017-03-29 Sold (MLS) $18,000 REALCOMP
- 2017-03-07 Pending — SW Michigan MLS
- 2017-03-06 Contingent — SW Michigan MLS
- 2017-03-03 Relisted — SW Michigan MLS
- 2017-03-02 Pending — SW Michigan MLS
- 2017-03-02 Price Changed $19,900 SW Michigan MLS
- 2017-01-31 Listed $23,900 SW Michigan MLS
- 2017-01-30 Listed $19,900 REALCOMP
Cash-flow waterfall
monthlySold comps — $/sqft
last 12 mo · ≤1 miLoading sold comps…