 Duplex
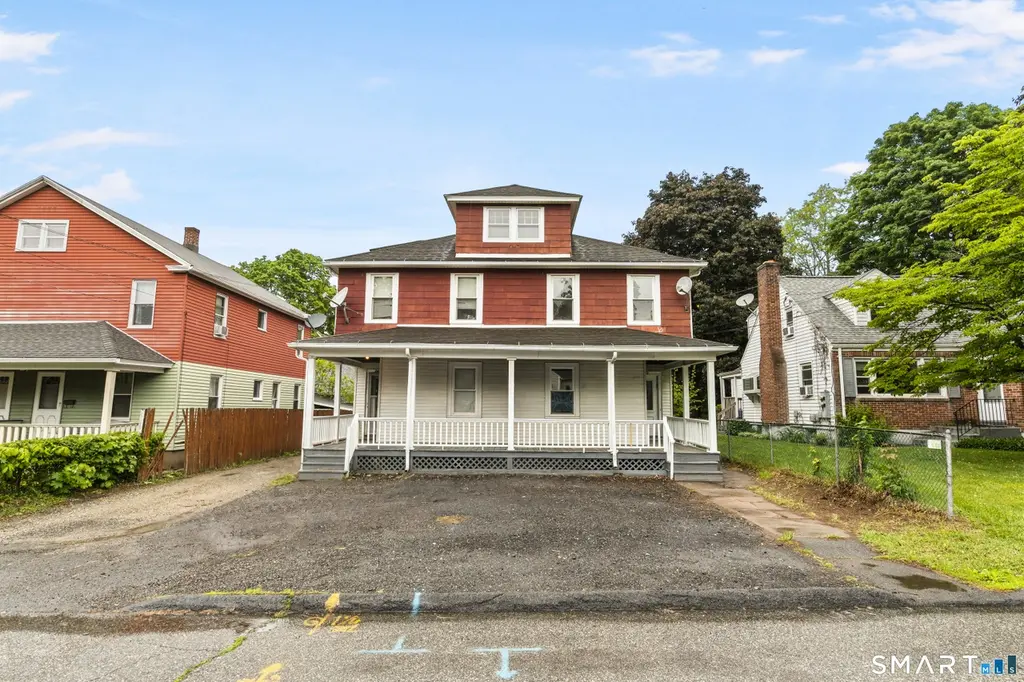
241 Oak St · Manchester, CT
Flood risk 1/10 · Minimal
- FEMA flood zone
- X (unshaded)
- Chance of flooding over 30 yrs
- 0.0%
- Est. flood insurance / yr
- $507 – $1,088
Fire risk 1/10 · Minimal
- Est. fire insurance / yr
- $829 – $1,539
Heat risk 5/10 · Moderate
- Hot days now (above 93°F)
- 8 days/yr
- Hot days in 30 yrs
- 18 days/yr
Wind risk 6/10 · Moderate
- Chance of severe wind over 30 yrs
- 27.0%
Air-quality risk 3/10 · Minor
- Unhealthy air days now
- 3 days/yr
- Unhealthy air days in 30 yrs
- 4 days/yr
Risk factors via First Street. Map © Google.
Why this score? — see what drove the D grade
The composite is a weighted blend of 9 inputs, each scored 0–100. Each bar is that input's sub-score; the figure is the points it added to the 100-point composite (weight × sub-score).
- Cash flow +16.0/30.0
- ARV discount +6.2/15.0
- DSCR +4.9/10.0
- 1% rule +4.4/10.0
- Livability +3.8/5.0
- Rent growth +3.0/5.0
- Schools +2.5/10.0
- Condition / age +2.5/5.0
- Appreciation +0.0/10.0
$450,000
🖨 Deal sheet (PDF) 📄 Offer letter ✓ Due diligence
Multi-family units
County records classify this as Multi-Family (2-4 Unit). Listing-text estimate: 2 units. confirmed
Listing remarks
Turnkey renovated duplex offering the perfect opportunity for investors or owner-occupants seeking immediate income potential and low-maintenance living. feature updated kitchens and baths, modern finishes, fresh paint, updated flooring, and spacious layouts with plenty of natural light. Separate utilities, ample parking, and strong rental appeal make this move-in-ready property a rare find in today's market. Don't miss your chance to own a cash-flow-ready multifamily property with lasting value.
Key facts
- Spacious layouts
- Updated baths
- Fresh paint
Tags
Property features AI
Exterior
- Utilities: Public water connected; Public sewer connected
- Home design: Multi-family property (2-family)
- Construction: Frame construction; Block foundation; Built as a two-family multi-unit building
- Exterior features: Aluminum siding; Asphalt shingle roof
Interior
- Bedrooms: 6 bedrooms (total across the property)
- Bathrooms: 2 full bathrooms
- Heating & cooling: Steam heating; Natural gas fuel; 40-gallon hot water tank
- Interior features: 12 total rooms; Full basement; Walk-up attic
- Laundry & utility: All units have laundry hook-ups
Neighborhood map
What this means for you Summary
Snapshot
- This is a 2 × 3-bed/1.0-bath units multifamily listed at $450k.
Deal economics
- At list price, monthly cash flow is $222 ($3k/yr) — positive. Per door: $111/mo.
- The deal already cash-flows at list — no discount required.
- To meet the 1% rule (rent ≥ 1% of price), the offer needs to be $423k (6.0% below list).
- Recommended offer: $423k (6.0% below list) — sets the bar for 1% rule.
- Cap rate 6.9% vs local median 3.7% in Manchester — top-decile yield for the area; either an underpriced asset or a hidden risk that comps aren't pricing in. Stress-test before assuming the spread holds.
Location & tenants
- Location reads 76/100 on livability (#59 in CT, #3,580 nationally) — a middle-class / working-renter tenant base. Strengths: housing A+, health & safety A+, cost of living A-; Watch: amenities D, commute F.
- Manchester School District (suburban): math 21% / reading 32% proficiency, ranked #130 of 153 in CT (top 85%) — low school quality limits family demand, transient renter base, plan for 1-2y turnover.
- Zoned schools: Highland Park School (math 27% / reading 27%, grade F, #401 of 553 statewide, top 74%, 318 students, 47% FRL); Illing Middle School (math 18% / reading 35%, grade F, #151 of 175 statewide, top 87%, 846 students, 58% FRL); Manchester High School (math 26% / reading 47%, grade F, #118 of 194 statewide, top 61%, 1,673 students, 52% FRL).
- Market conditions: Rents rising (+2.0%/yr); 107 active listings in the ZIP; solid renter incomes; 1,867 units permitted in Capitol Planning Region in 2024 (1,399 in 5+ unit buildings).
- At $4,230/mo this rent would consume 61% of the median local household income ($83k/yr) (locally 1839% of renters already pay >50% of income on rent) — very limited rent-growth headroom before tenants either downsize or default.
Forward outlook
- Local home prices are declining (-3.0%/yr); year-one equity from $3k of loan paydown is wiped out by about $14k of value loss. Plan a longer hold.
Negotiation context
- Only 8 days on market — expect competitive offers; lowballing is unlikely to land.
- Current owner paid $270k; list at $450k implies a 67% gain — meaningful room to come down on a strong offer.
Risks & watch-outs
- Watch-outs: built in 1925 — expect roof / HVAC / electrical / plumbing capex.
- Climate carrying-cost: major wind risk, 27% chance of damaging wind over 30y; extreme-heat days projected 8→18/yr by 2055 (HVAC capex compounding) — expect insurance premiums to compound above CPI over the hold.
Questions for the listing agent
- Can we see the unit-by-unit rent roll, current vacancy, and any below-market leases? What's the average tenancy length?
- What capital expenditures (roof, boiler, parking lot, exteriors) have been made in the last 5 years, and what's planned in the next 2?
- Built in 1925 — when were the roof, HVAC, electrical panel, plumbing, and water heater last replaced?
- Is there a deadline driving the sale (1031 exchange, divorce, estate, relocation)? That informs how much negotiation room exists.
- Schools are B-rated — typically a magnet for longer-tenancy family renters. What's the average tenant stay here, and is there a school-zone premium baked into asking?
- The area grade is low — what's the realistic commute time and amenity access for the typical tenant pool here? Any planned neighborhood developments (good or bad) we should know about?
- What's the average days-on-market for RENTAL listings here right now (not sales)? A rising rental-DOM trend means longer vacancies and softer asking-rent achievability than the comps imply.
- What's the recent tenant-quality profile in this submarket — average credit score on applications, eviction rate, late-payment / NSF rate, and stable-employment percentage? A property-management company in the area should have these aggregated.
- How much new apartment / multifamily construction is in the pipeline within 1–3 miles? Heavy new supply (>2% of stock underway) typically softens rents 12–24 months out; light construction supports rent growth.
Investment metrics
- 1% rule
- 0.94% ✗
- Cap rate
- 6.89%
- Cash-on-cash
- 2.12%
- DSCR
- 1.09
- GRM
- 8.9
CMA / ARV
- ARV (on-the-fly)
- $437,276
- Comps found
- 12
Show comp detail 12 sales within ~0.75 mi
| Address | Dist | Beds/Ba | Sqft | Sold | Price | $/sf | Match |
|---|---|---|---|---|---|---|---|
| 231 School St | 0.20mi | 7/2.0 (+1) | 2,752 (+1%) | 5mo | $360,000 | $131 | 78 |
| 45 Eldridge St | 0.52mi | 6/2.0 | 2,720 (+0%) | 4mo | $310,000 | $114 | 70 |
| 23 Knighton St | 0.33mi | 6/2.5 | 2,615 (-4%) | 12mo | $420,000 | $161 | 68 |
| 160 Eldridge St | 0.28mi | 6/3.0 | 2,778 (+2%) | 16mo | $462,500 | $166 | 68 |
| 69 Foster St | 0.50mi | 6/3.0 | 2,792 (+3%) | 7mo | $450,000 | $161 | 65 |
| 91 Foster St | 0.47mi | 6/3.0 | 2,774 (+2%) | 11mo | $435,000 | $157 | 63 |
| 73 Foster St | 0.49mi | 6/3.0 | 2,750 (+1%) | 12mo | $464,300 | $169 | 63 |
| 47 Holl St | 0.42mi | 6/2.5 | 2,847 (+5%) | 11mo | $400,000 | $140 | 63 |
| 43-45 Birch St | 0.51mi | 7/2.5 (+1) | 2,690 (-1%) | 14mo | $500,000 | $186 | 58 |
| 82 Maple St | 0.42mi | 6/2.0 | 2,404 (-12%) | 4mo | $432,500 | $180 | 56 |
| 179 Spruce St | 0.35mi | 6/2.0 | 2,352 (-13%) | 9mo | $405,000 | $172 | 51 |
| 17 Holl St | 0.49mi | 6/2.0 | 3,062 (+13%) | 11mo | $410,000 | $134 | 45 |
Match score weights: distance 35% · size 25% · config 20% · recency 20%. Top-matched comps best support the ARV.
Projected returns pro-forma
-3.0% appreciation · 1.97% rent growth · sell at horizon
- IRR
- -14.1%
- Equity multiple
- 0.50×
- Total profit
- $-63,033
- Equity at exit
- $67,096
- IRR
- -7.0%
- Equity multiple
- 0.57×
- Total profit
- $-53,817
- Equity at exit
- $38,908
Cash invested: $126,000 (down + closing). Projections, not guarantees.
Landlord ↔ Tenant lean methodology
- Overall (STATE)
- 27 Tenant-Leaning
- State Connecticut
- 27 Tenant-Leaning · D+7
- County
- — inherits STATE
- City
- — inherits STATE
ZIP-level market 06040
- Rents YoY
- 2.0%
- Active inventory
- 107
- Price-to-rent
- 17.7×
Monthly cashflow live
- Estimated rent
- $4,230 high interval (Pro) →
- Mortgage (P&I)
- −$2,360
- Tax from tax record
- −$572 /mo · $6,865/yr
- Insurance
- −$188
- HOA
- −$0
- Vacancy / Maint / Mgmt
- −$888
- Net cashflow
- $222
Break-even live
Sensitivity live
| Price | -10% $477 | -5% $350 | +0% $222 | +5% $95 | +10% $-32 |
|---|---|---|---|---|---|
| Rent | -10% $-112 | -5% $55 | +0% $222 | +5% $389 | +10% $556 |
| Rate | -1.0pp $449 | -0.5pp $337 | base $222 | +0.5pp $106 | +1.0pp $-13 |
2-unit breakdown (identical units grouped — click to expand)
| Units | Beds | Baths | Est. rent |
|---|---|---|---|
| 2× units | 3 | 1 | $4,230 |
| #1 | 3 | 1 | $2,115 |
| #2 | 3 | 1 | $2,115 |
| Total (2 units) | $4,230 | ||
UW: 25.0% down · 7.5% · 30yr · 1.5% tax · 5.0% vac · 8.0% maint · 8.0% mgmt
Financing live
Cash to close
- Down payment
- $112,500
- Closing costs
- $13,500
- Reserves months
- —
- Total cash needed
- —
Loan-product check · same deal, 3 products live
Conventional
25% down · 7.5% · 30yr
- Down + closing
- —
- Monthly P&I
- —
- Monthly cashflow
- —
- DSCR
- —
- Eligible?
- —
Personal DTI + credit; lowest rate.
DSCR
20% down · 8.5% · 30yr
- Down + closing
- —
- Monthly P&I
- —
- Monthly cashflow
- —
- DSCR
- —
- Eligible?
- —
No personal income docs; deal must DSCR.
Hard money
10% down · 12.0% · 12mo
- Down + closing
- —
- Monthly P&I
- —
- Monthly cashflow
- —
- DSCR
- —
- Eligible?
- —
Short-term bridge; refi at stabilization.
Listing history 7 events
-
2026-06-07status $450,000 Under Contract 8 DOM
-
2026-06-03days on market $450,000 Active 8 DOM
-
2026-06-02days on market $450,000 Active 7 DOM
-
2026-06-01days on market $450,000 Active 6 DOM
-
2026-05-31days on market $450,000 Active 5 DOM
-
2026-05-26$450,000 Active
-
2025-11-20soldstatus $270,000
ⓘ Source: listings_history table (triggers on properties + properties_extension) + one-shot
backfill from property_details.listing_events for pre-trigger history.
Tax reassessment forecast CT · Partial reset (capped growth)
- Current annual tax
- $6,865 · $572/mo
- Projected year-2 tax
- $8,248 · $687/mo
- Expected delta
- +$1,382/yr (+$115/mo · 20.1%)
ⓘ Screening estimate from a state-policy table — verify with the county assessor before closing.
Climate risk First Street
- Flood 1/10 Low FEMA zone X (unshaded) · 0% chance over 30 yrs
- Wildfire 1/10 Low
- Heat 5/10 Major 8 d/yr ≥93°F today · 18 d/yr by 30 yrs out
- Wind 6/10 Major 27% chance of damaging wind over 30 yrs
- Air quality 3/10 Moderate 3 unhealthy d/yr today · 4 by 30 yrs out
Nearby sold comps map
Loading sold comps map…
Walkable amenities ~0.75 mi
Loading nearby amenities…
Taxation est. · year 1
- Rental income
- $50,760
- − Mortgage interest
- −$25,207
- − Property taxes
- −$6,865
- − Insurance
- −$2,250
- − Repairs & maintenance
- −$4,061
- − Management
- −$4,061
- − Depreciation
- −$13,091
- Taxable loss
- −$4,775
- Est. tax savings @ 24.0%
- +$1,146
- After-tax cash flow
- $3,813/yr
For passive investors: Depreciation is non-cash, so a rental often shows a tax loss while cash-flowing — sheltering income. Rental losses are passive: they offset passive income freely, and up to $25,000/yr can offset ordinary (W-2) income if you actively participate and your MAGI is under $100k (phasing out to $0 by $150k); unused losses carry forward. On sale, claimed depreciation is recaptured at up to 25%, and gains may owe capital-gains tax (a 1031 exchange can defer both). Figures are a year-1 estimate at your 24.0% rate — not tax advice; consult a CPA.
Schools (NCES district)
- District
- Manchester School District
- NCES district ID
- 0902310
- Math proficiency
- 21% ▼ -8.00%
- Reading proficiency
- 32% ▼ -5.00%
- Median HH income
- $63,391
- Composite
- 24.54/100
- National rank
- #7643
- State rank
- #130 of 153 in CT
Livability — Manchester
- Score
- 76/100
- State rank
- #59
- US rank
- #3580
Category grades
Schools grade is shown separately in the Schools card above.
Census & demographics
- Census place
- Manchester, CT
- County
- Hartford County · 754,208 people
- City population
- 59,635
- Metro
- Hartford-East Hartford-Middletown, CT
- Population (ZIP)
- 35,813
- Household income
- $83,422
- Rent vs Own
- Severe rent burden
- 1839.0
Population outlook (Capitol County) Hauer SSP2
- By 2040
- 1,063,519
Race, ethnicity, and origin ACS 2023
- Neighborhood character
- Diverse neighborhood (Simpson 0.65)
- Race & ethnicity
- White 53% Hispanic / Latino 18% Black 15% Asian 9% Two or more races 8%
- Hispanic origin (detail)
- Puerto Rican 14%
- Common ancestry
- Romanian 5% Lithuanian 4% Slovak 1%
- Foreign-born
- 15% · Canada, Jamaica, China
- Languages at home
- 81% English-only · Spanish 8% Other Indo-European 5% Other Asian/Pacific 2%
Political lean MEDSL · Capitol
- 2024 margin
- Strong D (+21.9) · D 60.1% · R 38.2% · Other 1.7%
- All cycles
- 2024: D+21.9
Not yet ingested
- Civics
- —
Market trends
- HPI YoY
- ▼ -197.69%
- Current HPI
- 190.4204
- Rent YoY
- ▲ 1.97%
- Metro
- Hartford-East Hartford-Middletown, CT
- State GDP YoY
- ▲ 1.06%
- F500 in state
- 38
Industry mix (Fortune 500 HQ in CT)
| Industry | F500 HQs | Revenue |
|---|---|---|
| Industrial Machinery | 4 | $38B |
|
||
| Insurance | 3 | $71B |
|
||
| Financial Services | 2 | $25B |
|
||
| Transportation / Logistics | 2 | $18B |
|
||
| Healthcare | 1 | $247B |
|
||
| Telecommunications | 1 | $55B |
|
||
Price history
+66.7% since first listed2 events — show timeline
- 2026-05-26 Listed $450,000 Smart MLS
- 2025-11-20 Sold (Public Records) $270,000 Public Records
Property tax history
+2.8%/yrLatest (2025): $6,865 · +3.0% YoY. Source: county tax records.
Cash-flow waterfall
monthlySold comps — $/sqft
last 12 mo · ≤1 miLoading sold comps…