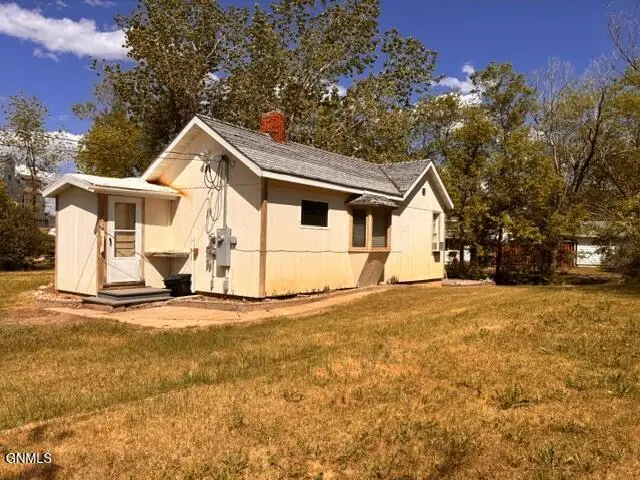
201 Montana St · Westby, MT
Flood risk 3/10 · Minor
- FEMA flood zone
- —
- Chance of flooding over 30 yrs
- 0.1%
- Est. flood insurance / yr
- —
Fire risk 4/10 · Minor
- Est. fire insurance / yr
- $918 – $1,706
Heat risk 1/10 · Minimal
- Hot days now (above 94°F)
- 7 days/yr
- Hot days in 30 yrs
- 13 days/yr
Wind risk 1/10 · Minimal
- Chance of severe wind over 30 yrs
- —
Air-quality risk 5/10 · Moderate
- Unhealthy air days now
- 8 days/yr
- Unhealthy air days in 30 yrs
- 8 days/yr
Risk factors via First Street. Map © Google.
Why this score? — see what drove the B grade
The composite is a weighted blend of 9 inputs, each scored 0–100. Each bar is that input's sub-score; the figure is the points it added to the 100-point composite (weight × sub-score).
- Cash flow +30.0/30.0
- DSCR +10.0/10.0
- 1% rule +8.7/10.0
- ARV discount +7.5/15.0
- Appreciation +5.3/10.0
- Schools +3.6/10.0
- Livability +3.4/5.0
- Rent growth +2.5/5.0
- Condition / age +2.5/5.0
$60,000
🖨 Deal sheet 📄 Offer letter ✓ Due diligence
Listing remarks MLS
This fully furnished, move in ready house is the perfect solution for employee housing, hunting accommodation, rental opportunity, or just move in and enjoy it yourself! The main floor contains 704 square feet of well planned space, including one bedroom, one bath, kitchen, dining, living room, and entry. The partially finished basement accommodates the laundry and a bonus room. Outside, enjoy a private, well established yard with mature trees, a front deck, storage shed, and plenty of room to park. SOO much bang for the buck. Make an appointment today to see this charming, well maintained property!
Key facts
- Front deck
- Bonus room
- Private yard
Tags
Property features AI
Exterior
- Parking: Oversized private parking; Outside parking; On-street parking; Off-street parking
- Utilities: Propane available; Phone available; Water connected; Electricity connected; Public sewer
- Home design: Single family residence; Two levels
- Construction: Frame and Masonite exterior; Shingle roof; Has basement
- Exterior features: Private yard; Private entrance; Patio; Shed(s)
Interior
- Kitchen: Electric range; Refrigerator
- Flooring: Carpet; Linoleum
- Bathrooms: 1 full bathroom
- Heating & cooling: Central air conditioning; Forced air heating (propane)
- Interior features: Window treatments; Partially finished basement with concrete floor and interior entry
- Laundry & utility: Washer; Dryer
Neighborhood map
What this means for you Summary
Snapshot
- This is a 1-bed/1.0-bath single-family listed at $60k.
Deal economics
- At list price, monthly cash flow is $269 ($3k/yr) — positive.
- The deal already cash-flows at list — no discount required.
- Meets the 1% rule at list price ($823 rent vs $60k).
Location & tenants
- Location reads 68/100 on livability (#97 in MT) — a middle-class / working-renter tenant base. Strengths: cost of living A+, housing A+, employment B; Watch: health & safety D, crime D-, amenities F.
- Westby K-12 Schools (rural): math 40% / reading 40% proficiency, ranked #144 of 339 in MT (top 42%) — families likely to look elsewhere, expect single-tenant / working-renter base with shorter leases; only 19% free/reduced lunch — higher-income household profile.
- Market conditions: 3 active listings in the ZIP; 5 units permitted in Sheridan County in 2024 (0 in 5+ unit buildings).
Forward outlook
- In year one you build about $733 of equity ($415 loan paydown + $318 appreciation (0.5% local appreciation)).
- Sheridan County population projected at +62% by 2050 — long-run rental-demand tailwind backs the buy-and-hold thesis.
- At projected returns (0.5% appreciation + 3.0% rent growth), your $17k cash investment doubles in ~4 years — after that, you're playing with house money.
Negotiation context
- Only 9 days on market — expect competitive offers; lowballing is unlikely to land.
- 3 sale attempts since 3y ago with the ask held roughly flat each time — persistent listings suggest the price (not the market) is what's stuck; bring a comps-based counter.
Risks & watch-outs
- Watch-outs: built in 1915 — expect roof / HVAC / electrical / plumbing capex.
Questions for the listing agent
- Built in 1915 — when were the roof, HVAC, electrical panel, plumbing, and water heater last replaced?
- Is there a deadline driving the sale (1031 exchange, divorce, estate, relocation)? That informs how much negotiation room exists.
- Schools are B-rated — typically a magnet for longer-tenancy family renters. What's the average tenant stay here, and is there a school-zone premium baked into asking?
- Crime grade is D in this area — have there been break-ins, vandalism, or insurance claims at this property in the last 3 years? What carrier currently insures it and at what premium?
- What's the average days-on-market for RENTAL listings here right now (not sales)? A rising rental-DOM trend means longer vacancies and softer asking-rent achievability than the comps imply.
- What's the recent tenant-quality profile in this submarket — average credit score on applications, eviction rate, late-payment / NSF rate, and stable-employment percentage? A property-management company in the area should have these aggregated.
- How much new for-sale + rental construction is in the pipeline within 1–3 miles? Heavy new supply typically softens prices + rents 12–24 months out; constrained supply supports both.
Investment metrics
- 1% rule
- 1.37% ✓
- Cap rate
- 11.67%
- Cash-on-cash
- 19.22%
- DSCR
- 1.86
- GRM
- 6.1
CMA / ARV
No comps found within radius.
Projected returns pro-forma
0.53% appreciation · 3.0% rent growth · sell at horizon
- IRR
- 20.2%
- Equity multiple
- 2.01×
- Total profit
- $16,885
- Equity at exit
- $19,030
- IRR
- 23.8%
- Equity multiple
- 3.76×
- Total profit
- $46,355
- Equity at exit
- $24,201
Cash invested: $16,800 (down + closing). Projections, not guarantees.
Landlord ↔ Tenant lean methodology
- Overall (STATE)
- 82 Strongly Landlord-Friendly
- State Montana
- 82 Strongly Landlord-Friendly · R+11
- County
- — inherits STATE
- City
- — inherits STATE
ZIP-level market 59275
- Home prices YoY
- 0.3%
- Active inventory
- 3
- Price-to-rent
- 6.1×
Monthly cashflow live
- Estimated rent
- $823 medium interval (Pro) →
- Mortgage (P&I)
- −$315
- Tax from tax record
- −$41 /mo · $493/yr
- Insurance
- −$25
- HOA
- −$0
- Vacancy / Maint / Mgmt
- −$173
- Net cashflow
- $269
Break-even live
UW: 25.0% down · 7.5% · 30yr · 1.5% tax · 5.0% vac · 8.0% maint · 8.0% mgmt
Financing live
Cash to close
- Down payment
- $15,000
- Closing costs
- $1,800
- Reserves months
- —
- Total cash needed
- —
Loan-product check · same deal, 3 products live
Conventional
25% down · 7.5% · 30yr
- Down + closing
- —
- Monthly P&I
- —
- Monthly cashflow
- —
- DSCR
- —
- Eligible?
- —
Personal DTI + credit; lowest rate.
DSCR
20% down · 8.5% · 30yr
- Down + closing
- —
- Monthly P&I
- —
- Monthly cashflow
- —
- DSCR
- —
- Eligible?
- —
No personal income docs; deal must DSCR.
Hard money
10% down · 12.0% · 12mo
- Down + closing
- —
- Monthly P&I
- —
- Monthly cashflow
- —
- DSCR
- —
- Eligible?
- —
Short-term bridge; refi at stabilization.
Listing history 7 events
-
2026-06-18days on market $60,000 Active 9 DOM
-
2026-06-17days on market $60,000 Active 8 DOM
-
2026-06-16days on market $60,000 Active 7 DOM
-
2026-06-15days on market $60,000 Active 6 DOM
-
2026-06-13days on market $60,000 Active 4 DOM
-
2026-06-12days on market $60,000 Active 3 DOM
-
2026-06-09$60,000 Active 1 DOM
ⓘ Source: listings_history table (triggers on properties + properties_extension) + one-shot
backfill from property_details.listing_events for pre-trigger history.
Tax reassessment forecast MT · Resets to sale price
- Current annual tax
- $493 · $41/mo
- Projected year-2 tax
- $504 · $42/mo
- Expected delta
- +$11/yr (+$1/mo · 2.3%)
ⓘ Screening estimate from a state-policy table — verify with the county assessor before closing.
Climate risk First Street
- Flood 3/10 Moderate 10% chance over 30 yrs
- Wildfire 4/10 Moderate
- Heat 1/10 Low 7 d/yr ≥94°F today · 13 d/yr by 30 yrs out
- Wind 1/10 Low
- Air quality 5/10 Major 8 unhealthy d/yr today · 8 by 30 yrs out
Nearby sold comps map
Loading sold comps map…
Walkable amenities ~0.75 mi
Loading nearby amenities…
Taxation est. · year 1
- Rental income
- $9,870
- − Mortgage interest
- −$3,361
- − Property taxes
- −$493
- − Insurance
- −$300
- − Repairs & maintenance
- −$790
- − Management
- −$790
- − Depreciation
- −$1,745
- Taxable income
- $2,392
- Est. tax owed @ 24.0%
- −$574
- After-tax cash flow
- $2,655/yr
For passive investors: Depreciation is non-cash, so a rental often shows a tax loss while cash-flowing — sheltering income. Rental losses are passive: they offset passive income freely, and up to $25,000/yr can offset ordinary (W-2) income if you actively participate and your MAGI is under $100k (phasing out to $0 by $150k); unused losses carry forward. On sale, claimed depreciation is recaptured at up to 25%, and gains may owe capital-gains tax (a 1031 exchange can defer both). Figures are a year-1 estimate at your 24.0% rate — not tax advice; consult a CPA.
Schools (NCES district)
- District
- Westby K-12 Schools
- NCES district ID
- 3027730
- Math proficiency
- 40% ▲ 10.00%
- Reading proficiency
- 40% ▼ -20.00%
- Median HH income
- $45,043
- Composite
- 36.45/100
- National rank
- #9332
- State rank
- #144 of 339 in MT
Livability — Westby
- Score
- 68/100
- State rank
- #97
- US rank
- #9986
Category grades
Schools grade is shown separately in the Schools card above.
Census & demographics
- Census place
- Westby, MT
- Population (ZIP)
- 567
Population outlook (Sheridan County) Hauer SSP2
- Today (2025)
- 4,481 people
- By 2030
- 4,951 · +10.5%
- By 2040
- 6,013 · +34.2%
- By 2050
- 7,266 · +62.2%
- By 2075
- 10,842 · +142.0%
- By 2100
- 13,272 · +196.2%
Race, ethnicity, and origin ACS 2023
- Neighborhood character
- Predominantly White (99%)
- Race & ethnicity
- White 99%
- Common ancestry
- Portuguese 24% Scottish 7% Slovak 6%
- Foreign-born
- 1%
Political lean MEDSL · Sheridan
- 2024 margin
- Solid R (+42.5) · D 26.6% · R 69.1% · Other 4.3%
- 2008→2024 swing
- -40.8pp toward R · 2008: -1.7pp · 2024: -42.5pp
- All cycles
- 2024: R+42.5 2020: R+40.8 2016: R+41.7 2012: R+28.2 2008: R+1.7
Not yet ingested
- Civics
- —
Market trends
- HPI YoY
- ▲ 0.53%
- Current HPI
- 160.6487
- Rent YoY
- —
- Metro
- —
- State GDP YoY
- ▲ 3.41%
- F500 in state
- 2
Industry mix (Fortune 500 HQ in MT)
| Industry | F500 HQs | Revenue |
|---|---|---|
| Technology / Analytics | 1 | $2B |
|
||
Price history
+20.0% since first listed7 events — show timeline
- 2026-06-09 Listed $60,000 GNMLS
- 2024-04-12 Sold (MLS) — GNMLS
- 2024-04-08 Pending — GNMLS
- 2023-12-04 Relisted — GNMLS
- 2023-10-16 Pending — GNMLS
- 2023-10-05 Listed $50,000 GNMLS
- 2006-11-27 Sold (Public Records) — Public Records
Property tax history
+8.8%/yrLatest (2025): $493 · -11.1% YoY. Source: county tax records.
Cash-flow waterfall
monthlySold comps — $/sqft
last 12 mo · ≤1 miLoading sold comps…