 Duplex
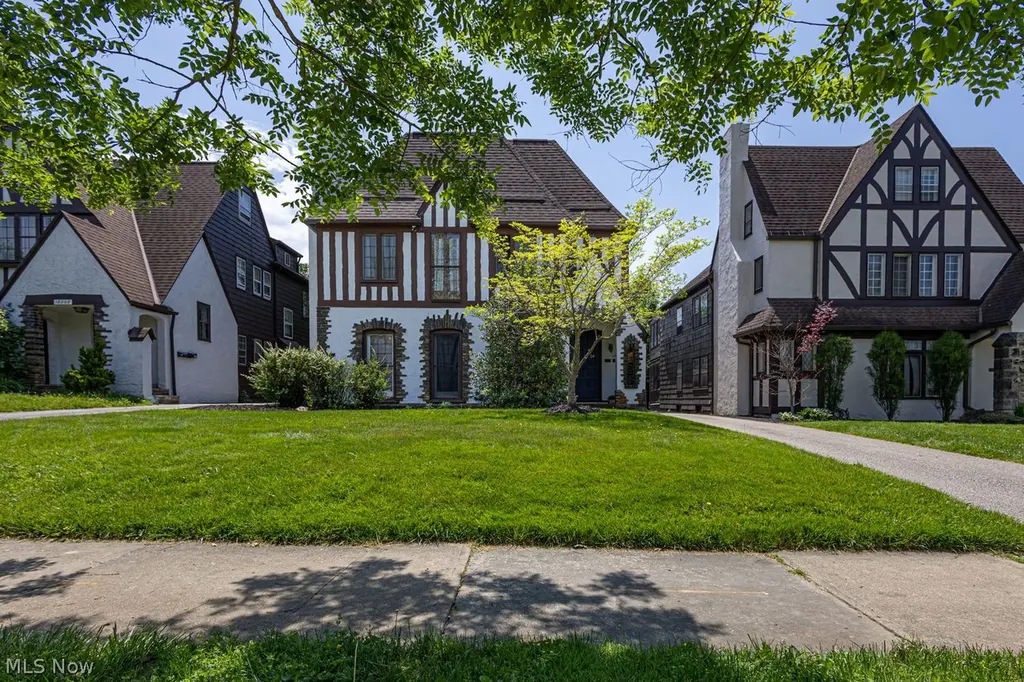
18004 Winslow Rd · Shaker Heights, OH
Flood risk 1/10 · Minimal
- FEMA flood zone
- X (unshaded)
- Chance of flooding over 30 yrs
- 0.0%
- Est. flood insurance / yr
- $507 – $1,088
Fire risk 1/10 · Minimal
- Est. fire insurance / yr
- $713 – $1,323
Heat risk 2/10 · Minimal
- Hot days now (above 95°F)
- 7 days/yr
- Hot days in 30 yrs
- 17 days/yr
Wind risk 1/10 · Minimal
- Chance of severe wind over 30 yrs
- —
Air-quality risk 3/10 · Minor
- Unhealthy air days now
- 3 days/yr
- Unhealthy air days in 30 yrs
- 5 days/yr
Risk factors via First Street. Map © Google.
Why this score? — see what drove the C- grade
The composite is a weighted blend of 9 inputs, each scored 0–100. Each bar is that input's sub-score; the figure is the points it added to the 100-point composite (weight × sub-score).
- Cash flow +22.2/30.0
- 1% rule +7.7/10.0
- DSCR +7.1/10.0
- Schools +5.0/10.0
- Livability +4.5/5.0
- Rent growth +2.8/5.0
- Condition / age +2.5/5.0
- ARV discount +0.0/15.0
- Appreciation +0.0/10.0
$300,000
🖨 Deal sheet 📄 Offer letter ✓ Due diligence
Multi-family units
County records classify this as Multi-Family (2-4 Unit). Listing-text estimate: 2 units. confirmed
Listing remarks MLS
Adorable two-family home in Shaker Heights across from a children's playground. This home has spacious living rooms with a fireplace in each and beautiful hardwood floors throughout with some carpeted bedrooms. The back of the home has two wooden decks for the upper and lower quadrants that look out over a beautifully landscaped back yard. Home includes a detached three car garage. At this price you can renovate to your heart desires!
Key facts
- New boiler
- New garage doors
- New deck
Tags
Neighborhood map
What this means for you Summary
Snapshot
- This is a 2 × 3-bed/1.5-bath units multifamily listed at $300k.
Deal economics
- At list price, monthly cash flow is $488 ($6k/yr) — positive. Per door: $244/mo.
- The deal already cash-flows at list — no discount required.
- Meets the 1% rule at list price ($4k rent vs $300k).
- Cap rate 8.2% vs local median 2.5% in Shaker Heights — top-decile yield for the area; either an underpriced asset or a hidden risk that comps aren't pricing in. Stress-test before assuming the spread holds.
Location & tenants
- Location reads 89/100 on livability (#15 in OH, #134 nationally) — a professional / high-income tenant draw. Strengths: schools A+, crime A+, commute A+; Watch: amenities F.
- Shaker Heights City (suburban): math 50% / reading 63% proficiency, ranked #309 of 656 in OH (top 47%) — acceptable for families but not a draw, mixed tenant base, ~2y average lease.
- Market conditions: Rents rising (+1.1%/yr); 177 active listings in the ZIP; 11 comparable units currently listed for rent nearby; rentals leasing fast (median 11d on market — plan ~1-2 weeks tenant-placement turnaround); solid renter incomes; 1,441 units permitted in Cuyahoga County in 2024 (700 in 5+ unit buildings).
- At $3,799/mo this rent would consume 45% of the median local household income ($101k/yr) (locally 1294% of renters already pay >50% of income on rent) — very limited rent-growth headroom before tenants either downsize or default.
Forward outlook
- Local home prices are declining (-3.0%/yr); year-one equity from $2k of loan paydown is wiped out by about $9k of value loss. Plan a longer hold.
- Cuyahoga County population projected to shrink 8% by 2050 — rents likely to lag national; underwrite the cash flow, not the appreciation.
Negotiation context
- Only 7 days on market — expect competitive offers; lowballing is unlikely to land.
- 2 sale attempts since 10y ago with the ask held roughly flat each time — persistent listings suggest the price (not the market) is what's stuck; bring a comps-based counter.
- Current owner paid $72k; list at $300k implies a 320% gain — meaningful room to come down on a strong offer.
Risks & watch-outs
- Watch-outs: property tax is 3.3% of price; built in 1928 — expect roof / HVAC / electrical / plumbing capex.
Questions for the listing agent
- Can we see the unit-by-unit rent roll, current vacancy, and any below-market leases? What's the average tenancy length?
- What capital expenditures (roof, boiler, parking lot, exteriors) have been made in the last 5 years, and what's planned in the next 2?
- Built in 1928 — when were the roof, HVAC, electrical panel, plumbing, and water heater last replaced?
- Property tax is high relative to price — has the assessment been appealed recently, and will the sale trigger a re-assessment?
- Is there a deadline driving the sale (1031 exchange, divorce, estate, relocation)? That informs how much negotiation room exists.
- Schools are A-rated — typically a magnet for longer-tenancy family renters. What's the average tenant stay here, and is there a school-zone premium baked into asking?
- What's the average days-on-market for RENTAL listings here right now (not sales)? A rising rental-DOM trend means longer vacancies and softer asking-rent achievability than the comps imply.
- What's the recent tenant-quality profile in this submarket — average credit score on applications, eviction rate, late-payment / NSF rate, and stable-employment percentage? A property-management company in the area should have these aggregated.
- How much new apartment / multifamily construction is in the pipeline within 1–3 miles? Heavy new supply (>2% of stock underway) typically softens rents 12–24 months out; light construction supports rent growth.
Investment metrics
- 1% rule
- 1.27% ✓
- Cap rate
- 8.25%
- Cash-on-cash
- 6.98%
- DSCR
- 1.31
- GRM
- 6.6
CMA / ARV
- ARV (on-the-fly)
- $236,880
- Comps found
- 10
Show comp detail 10 sales within ~0.75 mi
| Address | Dist | Beds/Ba | Sqft | Sold | Price | $/sf | Match |
|---|---|---|---|---|---|---|---|
| 17624 Winslow Rd | 0.15mi | 4/3.0 | 2,268 (-10%) | 11mo | $270,000 | $119 | 67 |
| 3560 Avalon Rd | 0.36mi | 5/3.0 (+1) | 2,618 (+4%) | 6mo | $194,587 | $74 | 67 |
| 3550 Daleford Rd | 0.30mi | 4/3.0 | 2,268 (-10%) | 4mo | $342,500 | $151 | 66 |
| 3541 Daleford Rd | 0.27mi | 4/2.0 | 2,608 (+4%) | 14mo | $205,000 | $79 | 66 |
| 18705 Newell Rd | 0.29mi | 4/3.5 | 2,472 (-2%) | 21mo | $252,500 | $102 | 64 |
| 3643 Lindholm Rd | 0.62mi | 4/3.0 | 2,368 (-6%) | 8mo | $100,000 | $42 | 55 |
| 3625 Ingleside Rd | 0.31mi | 4/2.0 | 2,377 (-6%) | 22mo | $217,500 | $92 | 54 |
| 3566 Daleford Rd | 0.32mi | 4/2.0 | 2,268 (-10%) | 19mo | $187,000 | $82 | 48 |
| 3619 Strathavon Rd | 0.49mi | 4/3.5 | 2,280 (-10%) | 22mo | $220,000 | $96 | 41 |
| 3654 3654 Avalon Road Rd #2 | 0.47mi | 5/3.0 (+1) | 2,236 (-11%) | 23mo | $210,000 | $94 | 35 |
Match score weights: distance 35% · size 25% · config 20% · recency 20%. Top-matched comps best support the ARV.
Projected returns pro-forma
-3.0% appreciation · 1.15% rent growth · sell at horizon
- IRR
- -8.0%
- Equity multiple
- 0.71×
- Total profit
- $-24,132
- Equity at exit
- $44,731
- IRR
- -1.4%
- Equity multiple
- 0.92×
- Total profit
- $-7,094
- Equity at exit
- $25,939
Cash invested: $84,000 (down + closing). Projections, not guarantees.
Landlord ↔ Tenant lean methodology
- Overall (STATE)
- 73 Landlord-Friendly
- State Ohio
- 73 Landlord-Friendly · R+6
- County
- — inherits STATE
- City
- — inherits STATE
ZIP-level market 44122
- Rents YoY
- 1.1%
- Active inventory
- 177
- Price-to-rent
- 13.2×
Monthly cashflow live
- Estimated rent
- $3,799 high interval (Pro) →
- Mortgage (P&I)
- −$1,573
- Tax from tax record
- −$815 /mo · $9,777/yr
- Insurance
- −$125
- HOA
- −$0
- Vacancy / Maint / Mgmt
- −$798
- Net cashflow
- $488
Break-even live
2-unit breakdown (identical units grouped — click to expand)
| Units | Beds | Baths | Est. rent |
|---|---|---|---|
| 2× units | 3 | 1.5 | $3,798 |
| #1 | 3 | 1.5 | $1,899 |
| #2 | 3 | 1.5 | $1,899 |
| Total (2 units) | $3,799 | ||
UW: 25.0% down · 7.5% · 30yr · 1.5% tax · 5.0% vac · 8.0% maint · 8.0% mgmt
Financing live
Cash to close
- Down payment
- $75,000
- Closing costs
- $9,000
- Reserves months
- —
- Total cash needed
- —
Loan-product check · same deal, 3 products live
Conventional
25% down · 7.5% · 30yr
- Down + closing
- —
- Monthly P&I
- —
- Monthly cashflow
- —
- DSCR
- —
- Eligible?
- —
Personal DTI + credit; lowest rate.
DSCR
20% down · 8.5% · 30yr
- Down + closing
- —
- Monthly P&I
- —
- Monthly cashflow
- —
- DSCR
- —
- Eligible?
- —
No personal income docs; deal must DSCR.
Hard money
10% down · 12.0% · 12mo
- Down + closing
- —
- Monthly P&I
- —
- Monthly cashflow
- —
- DSCR
- —
- Eligible?
- —
Short-term bridge; refi at stabilization.
Rent comps 11 comps
| Address | Beds | Baths | Sqft | Rent | $/sqft | DOM | Units | Dist |
|---|---|---|---|---|---|---|---|---|
| 17424 Winslow Rd Cleveland, OH | 4.0 | 2.0 | 1995 | $2,200 | $1.10 | 16d | 1 | 0.21mi |
| 3601 Glencairn Rd Shaker Heights, OH | 3.0 | 1.5 | 1890 | $1,500 | $0.79 | 43d | 1 | 0.24mi |
| 3578 Latimore Rd Shaker Heights, OH | 3.0 | 1.5 | 2113 | $2,200 | $1.04 | 2d | 1 | 0.25mi |
| 3653 Winchell Rd Unit 2 Shaker Heights, OH | 5.0 | 3.0 | 1775 | $2,350 | $1.32 | 43d | 1 | 0.43mi |
| 16818 Kenyon Rd Unit 2 Shaker Heights, OH | 4.0 | 1.0 | 1900 | $1,900 | $1.00 | 4d | 1 | 0.47mi |
| 19601 Van Aken Blvd Shaker Heights, OH | 1.0–4.0 | 1.0–4.0 | 1977 | $4,400 | $2.23 | 21d | 1 | 0.62mi |
| 18801 Invermere Ave Cleveland, OH | 3.0 | 2.5 | 2134 | $2,200 | $1.03 | 1d | 1 | 0.64mi |
| 2975 Claremont Rd Shaker Heights, OH | 5.0 | 3.0 | 3241 | $3,200 | $0.99 | 11d | 1 | 0.76mi |
| 20005 Farnsleigh Rd Shaker Heights, OH | 1.0–3.0 | 1.0–3.5 | 1407 | $7,815 | $5.55 | 1d | 8 | 0.77mi |
| 19406 Wickfield Ave Warrensville Heights, OH | 3.0 | 1.5 | 1934 | $2,650 | $1.37 | 1d | 1 | 0.78mi |
| 2868 Lee Rd Cleveland, OH | 4.0 | 2.5 | 3390 | $4,100 | $1.21 | 43d | 1 | 1.19mi |
Listing history 5 events
-
2026-06-09days on market $300,000 Active 7 DOM
-
2026-06-08days on market $300,000 Active 6 DOM
-
2026-06-07days on market $300,000 Active 5 DOM
-
2026-06-02remarks 695-char remark
-
2026-06-02$300,000 Active 1 DOM
ⓘ Source: listings_history table (triggers on properties + properties_extension) + one-shot
backfill from property_details.listing_events for pre-trigger history.
Tax reassessment forecast OH · Partial reset (capped growth)
- Current annual tax
- $9,777 · $815/mo
- Projected year-2 tax
- $9,777 · $815/mo
- Expected delta
- $0/yr ($0/mo · 0.0%)
ⓘ Screening estimate from a state-policy table — verify with the county assessor before closing.
Climate risk First Street
- Flood 1/10 Low FEMA zone X (unshaded) · 0% chance over 30 yrs
- Wildfire 1/10 Low
- Heat 2/10 Low 7 d/yr ≥95°F today · 17 d/yr by 30 yrs out
- Wind 1/10 Low
- Air quality 3/10 Moderate 3 unhealthy d/yr today · 5 by 30 yrs out
Nearby sold comps map
Loading sold comps map…
Walkable amenities ~0.75 mi
Loading nearby amenities…
Taxation est. · year 1
- Rental income
- $45,588
- − Mortgage interest
- −$16,805
- − Property taxes
- −$9,777
- − Insurance
- −$1,500
- − Repairs & maintenance
- −$3,647
- − Management
- −$3,647
- − Depreciation
- −$8,727
- Taxable income
- $1,485
- Est. tax owed @ 24.0%
- −$356
- After-tax cash flow
- $5,503/yr
For passive investors: Depreciation is non-cash, so a rental often shows a tax loss while cash-flowing — sheltering income. Rental losses are passive: they offset passive income freely, and up to $25,000/yr can offset ordinary (W-2) income if you actively participate and your MAGI is under $100k (phasing out to $0 by $150k); unused losses carry forward. On sale, claimed depreciation is recaptured at up to 25%, and gains may owe capital-gains tax (a 1031 exchange can defer both). Figures are a year-1 estimate at your 24.0% rate — not tax advice; consult a CPA.
Schools (NCES district)
- District
- Shaker Heights City
- NCES district ID
- 3904475
- Math proficiency
- 50% ▼ -16.00%
- Reading proficiency
- 63% ▼ -6.00%
- Median HH income
- $69,421
- Composite
- 49.98/100
- National rank
- #1928
- State rank
- #309 of 656 in OH
Livability — Shaker Heights
- Score
- 89/100
- State rank
- #15
- US rank
- #134
Category grades
Schools grade is shown separately in the Schools card above.
Census & demographics
- Census place
- Shaker Heights, OH
- County
- Cuyahoga County · 1,090,369 people
- City population
- 69,880
- Metro
- Cleveland-Elyria, OH
- Population (ZIP)
- 36,678
- Household income
- $101,230
- Rent vs Own
- Severe rent burden
- 1294.0
Population outlook (Cuyahoga County) Hauer SSP2
- Today (2025)
- 1,244,621 people
- By 2030
- 1,230,093 · -1.2%
- By 2040
- 1,189,108 · -4.5%
- By 2050
- 1,145,706 · -7.9%
- By 2075
- 1,076,557 · -13.5%
- By 2100
- 978,987 · -21.3%
Race, ethnicity, and origin ACS 2023
- Neighborhood character
- Diverse neighborhood (Simpson 0.59)
- Race & ethnicity
- White 56% Black 29% Asian 6% Two or more races 6% Hispanic / Latino 3%
- Common ancestry
- Romanian 6% Scotch-Irish 5% Italian 2%
- Foreign-born
- 12% · Canada, China
- Languages at home
- 85% English-only · Spanish 3% Other Indo-European 3% Chinese 2%
Political lean MEDSL · Cuyahoga
- 2024 margin
- Solid D (+31.5) · D 65.4% · R 33.9%
- 2008→2024 swing
- -7.4pp toward R · 2008: 38.9pp · 2024: 31.5pp
- All cycles
- 2024: D+31.5 2020: D+34.1 2016: D+35.0 2012: D+38.7 2008: D+38.9
Not yet ingested
- Civics
- —
Market trends
- HPI YoY
- ▼ -268.81%
- Current HPI
- 200.5087
- Rent YoY
- ▲ 1.15%
- Metro
- Cleveland-Elyria, OH
- State GDP YoY
- ▲ 1.98%
- F500 in state
- 48
Industry mix (Fortune 500 HQ in OH)
| Industry | F500 HQs | Revenue |
|---|---|---|
| Insurance | 3 | $145B |
|
||
| Industrial Machinery | 3 | $49B |
|
||
| Financial Services | 3 | $24B |
|
||
| Consumer Goods | 2 | $93B |
|
||
| Aerospace / Defense | 2 | $47B |
|
||
| Utilities | 2 | $33B |
|
||
Price history
+206.1% since first listed12 events — show timeline
- 2026-06-01 Listed $300,000 MLSNOW
- 2017-01-25 Pending — MLSNOW
- 2017-01-20 Sold (MLS) $71,500 MLSNOW
- 2017-01-18 Sold (Public Records) $71,500 Public Records
- 2016-12-21 Contingent — MLSNOW
- 2016-11-19 Price Changed $89,000 MLSNOW
- 2016-10-18 Price Changed $94,000 MLSNOW
- 2016-09-03 Price Changed $104,000 MLSNOW
- 2016-08-12 Price Changed $109,000 MLSNOW
- 2016-07-29 Price Changed $124,000 MLSNOW
- 2016-06-17 Listed $134,000 MLSNOW
- 1987-07-24 Sold (Public Records) $98,000 Public Records
Property tax history
+3.1%/yrLatest (2025): $9,777 · +13.3% YoY. Source: county tax records.
Cash-flow waterfall
monthlySold comps — $/sqft
last 12 mo · ≤1 miLoading sold comps…