 5-Plex
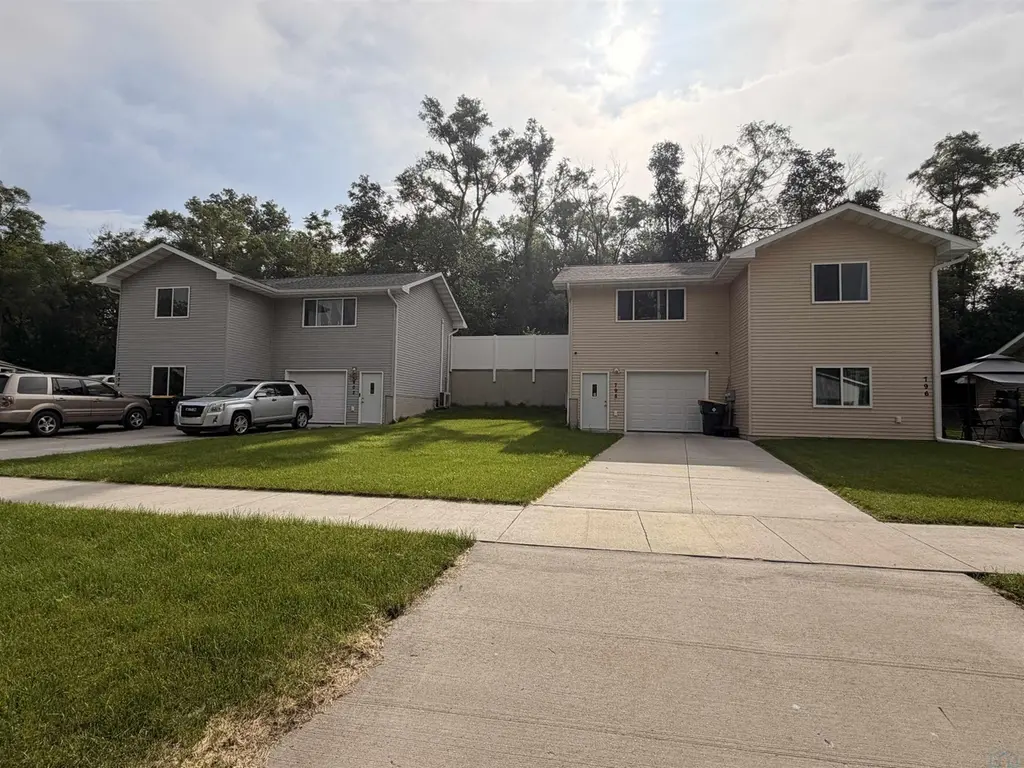
796-804 Logan St · Sioux City, IA
Flood risk 1/10 · Minimal
- FEMA flood zone
- X (unshaded)
- Chance of flooding over 30 yrs
- 0.0%
- Est. flood insurance / yr
- $507 – $1,088
Fire risk 5/10 · Moderate
- Est. fire insurance / yr
- $902 – $1,676
Heat risk 3/10 · Minor
- Hot days now (above 101°F)
- 7 days/yr
- Hot days in 30 yrs
- 14 days/yr
Wind risk 2/10 · Minimal
- Chance of severe wind over 30 yrs
- —
Air-quality risk 1/10 · Minimal
- Unhealthy air days now
- 0 days/yr
- Unhealthy air days in 30 yrs
- 0 days/yr
Risk factors via First Street. Map © Google.
Why this score? — see what drove the D grade
The composite is a weighted blend of 9 inputs, each scored 0–100. Each bar is that input's sub-score; the figure is the points it added to the 100-point composite (weight × sub-score).
- Cash flow +11.4/30.0
- ARV discount +7.5/15.0
- Appreciation +6.9/10.0
- Schools +4.7/10.0
- Livability +3.9/5.0
- DSCR +3.3/10.0
- Rent growth +2.5/5.0
- Condition / age +2.5/5.0
- 1% rule +2.0/10.0
$625,000
🖨 Deal sheet 📄 Offer letter ✓ Due diligence
Multi-family units
County records classify this as Multi-Family (2-4 Unit). Listing-text estimate: 5 units. estimate disagrees with records
Listing remarks
Investor Opportunity! Rare chance to purchase two newer duplexes being sold together at 796-798 Logan Street and 802-804 Logan Street in Sioux City. Built by Moos Construction less than seven years ago, these well-maintained properties offer a turnkey investment opportunity with four total rental units and a strong rental history. The portfolio consists of two upper-level 2-bedroom, 1-bath units (798 and 802) and two lower-level 1-bedroom, 1-bath units (796 and 804). Each unit features its own in-unit laundry, durable luxury vinyl plank flooring, and individual mini-split heating and cooling systems. Three of the four units have been repainted within the past year, helping minimize future m
Key facts
- In-unit laundry
- Modern windows
- Newer construction
Tags
Property features AI
Finance
- Financial info: Income-producing property with unit rents: two 2-bedroom units at $1,200 and $1,100; two 1-bedroom units at $800 each
Exterior
- Parking: Attached concrete garage with 2 parking spaces
- Utilities: Public water; Public sewer
- Home design: Residential income, multi-family property (multi-unit)
- Exterior features: 0.34-acre lot; Zoned residential
Interior
- Bedrooms: Two 2-bedroom units; Two 1-bedroom units
- Bathrooms: Four full bathrooms (total)
- Heating & cooling: Heat pump heating; Electric heating
- Interior features: Below-grade finished area included
Neighborhood map
What this means for you Summary
Snapshot
- This is a 5 × 2-bed/1.0-bath units multifamily listed at $625k.
Deal economics
- At list price, monthly cash flow is $-220 ($-3k/yr) — negative. Per door: $-44/mo.
- To cash-flow at today's rent, offer at most $586k (6.2% below list).
- To meet the 1% rule (rent ≥ 1% of price), the offer needs to be $437k (30.0% below list).
- Recommended offer: $437k (30.0% below list) — sets the bar for 1% rule.
- Cap rate 5.9% vs local median 3.7% in Sioux City — top-decile yield for the area; either an underpriced asset or a hidden risk that comps aren't pricing in. Stress-test before assuming the spread holds.
Location & tenants
- Location reads 78/100 on livability (#138 in IA, #2,544 nationally) — a middle-class / working-renter tenant base. Strengths: cost of living A+, housing A+, health & safety A+; Watch: crime F, commute F.
- Sioux City Community School District (urban): math 54% / reading 57% proficiency, ranked #264 of 289 in IA (top 91%) — acceptable for families but not a draw, mixed tenant base, ~2y average lease.
- Zoned schools: Unity Elementary School (math 50% / reading 52%, grade C-, #510 of 616 statewide, top 83%, 521 students, 74% FRL); East Middle School (math 60% / reading 67%, grade B+, #169 of 246 statewide, top 69%, 1,067 students, 65% FRL); East High School (math 53% / reading 63%, grade C, #275 of 336 statewide, top 83%, 1,495 students, 54% FRL).
- Market conditions: 31 active listings in the ZIP; 1 comparable units currently listed for rent nearby; 170 units permitted in Woodbury County in 2024 (90 in 5+ unit buildings).
Forward outlook
- In year one you build about $28k of equity ($4k loan paydown + $24k appreciation (3.8% local appreciation)).
- By year 2, paydown + projected appreciation supports a ~$45k cash-out refi (75% LTV) — recoverable capital for the next deal without selling this one.
Negotiation context
- Only 14 days on market — expect competitive offers; lowballing is unlikely to land.
Risks & watch-outs
- Climate carrying-cost: moderate wildfire risk — expect insurance premiums to compound above CPI over the hold.
Questions for the listing agent
- What do current leases actually rent for vs. the listed asking? Can we see a recent rent roll and the last 12 months of T-12 income?
- Can we see the unit-by-unit rent roll, current vacancy, and any below-market leases? What's the average tenancy length?
- What capital expenditures (roof, boiler, parking lot, exteriors) have been made in the last 5 years, and what's planned in the next 2?
- Is there a deadline driving the sale (1031 exchange, divorce, estate, relocation)? That informs how much negotiation room exists.
- Crime grade is F in this area — have there been break-ins, vandalism, or insurance claims at this property in the last 3 years? What carrier currently insures it and at what premium?
- The area grade is low — what's the realistic commute time and amenity access for the typical tenant pool here? Any planned neighborhood developments (good or bad) we should know about?
- What's the average days-on-market for RENTAL listings here right now (not sales)? A rising rental-DOM trend means longer vacancies and softer asking-rent achievability than the comps imply.
- What's the recent tenant-quality profile in this submarket — average credit score on applications, eviction rate, late-payment / NSF rate, and stable-employment percentage? A property-management company in the area should have these aggregated.
- How much new apartment / multifamily construction is in the pipeline within 1–3 miles? Heavy new supply (>2% of stock underway) typically softens rents 12–24 months out; light construction supports rent growth.
Investment metrics
- 1% rule
- 0.70% ✗
- Cap rate
- 5.87%
- Cash-on-cash
- -1.51%
- DSCR
- 0.93
- GRM
- 11.9
CMA / ARV
No comps found within radius.
Projected returns pro-forma
3.78% appreciation · 3.0% rent growth · sell at horizon
- IRR
- 8.3%
- Equity multiple
- 1.50×
- Total profit
- $87,146
- Equity at exit
- $308,909
- IRR
- 10.5%
- Equity multiple
- 2.70×
- Total profit
- $298,164
- Equity at exit
- $498,986
Cash invested: $175,000 (down + closing). Projections, not guarantees.
Landlord ↔ Tenant lean methodology
- Overall (STATE)
- 83 Strongly Landlord-Friendly
- State Iowa
- 83 Strongly Landlord-Friendly · R+6
- County
- — inherits STATE
- City
- — inherits STATE
ZIP-level market 51105
- Home prices YoY
- 1.7%
- Active inventory
- 31
- Price-to-rent
- 59.5×
Monthly cashflow live
- Estimated rent
- $4,374 medium interval (Pro) →
- Mortgage (P&I)
- −$3,278
- Tax from tax record
- −$138 /mo · $1,652/yr
- Insurance
- −$260
- HOA
- −$0
- Vacancy / Maint / Mgmt
- −$919
- Net cashflow
- $-220
Break-even live
5-unit breakdown (identical units grouped — click to expand)
| Units | Beds | Baths | Est. rent |
|---|---|---|---|
| 5× units | 2 | 1 | $4,375 |
| #1 | 2 | 1 | $875 |
| #2 | 2 | 1 | $875 |
| #3 | 2 | 1 | $875 |
| #4 | 2 | 1 | $875 |
| #5 | 2 | 1 | $875 |
| Total (5 units) | $4,374 | ||
UW: 25.0% down · 7.5% · 30yr · 1.5% tax · 5.0% vac · 8.0% maint · 8.0% mgmt
Financing live
Cash to close
- Down payment
- $156,250
- Closing costs
- $18,750
- Reserves months
- —
- Total cash needed
- —
Loan-product check · same deal, 3 products live
Conventional
25% down · 7.5% · 30yr
- Down + closing
- —
- Monthly P&I
- —
- Monthly cashflow
- —
- DSCR
- —
- Eligible?
- —
Personal DTI + credit; lowest rate.
DSCR
20% down · 8.5% · 30yr
- Down + closing
- —
- Monthly P&I
- —
- Monthly cashflow
- —
- DSCR
- —
- Eligible?
- —
No personal income docs; deal must DSCR.
Hard money
10% down · 12.0% · 12mo
- Down + closing
- —
- Monthly P&I
- —
- Monthly cashflow
- —
- DSCR
- —
- Eligible?
- —
Short-term bridge; refi at stabilization.
Rent comps 1 comps
| Address | Beds | Baths | Sqft | Rent | $/sqft | DOM | Units | Dist |
|---|---|---|---|---|---|---|---|---|
| 2622 Ridge Ave Sioux City, IA | 3.0 | 2.0 | 2219 | $2,600 | $1.17 | 43d | 1 | 1.49mi |
Listing history 11 events
-
2026-06-19days on market $625,000 Active 14 DOM
-
2026-06-18days on market $625,000 Active 13 DOM
-
2026-06-17days on market $625,000 Active 12 DOM
-
2026-06-16days on market $625,000 Active 11 DOM
-
2026-06-15days on market $625,000 Active 10 DOM
-
2026-06-14days on market $625,000 Active 8 DOM
-
2026-06-12days on market $625,000 Active 7 DOM
-
2026-06-09days on market $625,000 Active 4 DOM
-
2026-06-08days on market $625,000 Active 3 DOM
-
2026-06-07remarks 699-char remark
-
2026-06-07$625,000 Active 2 DOM
ⓘ Source: listings_history table (triggers on properties + properties_extension) + one-shot
backfill from property_details.listing_events for pre-trigger history.
Tax reassessment forecast IA · Partial reset (capped growth)
- Current annual tax
- $1,652 · $138/mo
- Projected year-2 tax
- $5,732 · $478/mo
- Expected delta
- +$4,080/yr (+$340/mo · 247.0%)
ⓘ Screening estimate from a state-policy table — verify with the county assessor before closing.
Climate risk First Street
- Flood 1/10 Low FEMA zone X (unshaded) · 0% chance over 30 yrs
- Wildfire 5/10 Major
- Heat 3/10 Moderate 7 d/yr ≥101°F today · 14 d/yr by 30 yrs out
- Wind 2/10 Low
- Air quality 1/10 Low 0 unhealthy d/yr today · 0 by 30 yrs out
Nearby sold comps map
Loading sold comps map…
Walkable amenities ~0.75 mi
Loading nearby amenities…
Taxation est. · year 1
- Rental income
- $52,488
- − Mortgage interest
- −$35,010
- − Property taxes
- −$1,652
- − Insurance
- −$3,125
- − Repairs & maintenance
- −$4,199
- − Management
- −$4,199
- − Depreciation
- −$18,182
- Taxable loss
- −$13,879
- Est. tax savings @ 24.0%
- +$3,331
- After-tax cash flow
- $689/yr
For passive investors: Depreciation is non-cash, so a rental often shows a tax loss while cash-flowing — sheltering income. Rental losses are passive: they offset passive income freely, and up to $25,000/yr can offset ordinary (W-2) income if you actively participate and your MAGI is under $100k (phasing out to $0 by $150k); unused losses carry forward. On sale, claimed depreciation is recaptured at up to 25%, and gains may owe capital-gains tax (a 1031 exchange can defer both). Figures are a year-1 estimate at your 24.0% rate — not tax advice; consult a CPA.
Schools (NCES district)
- District
- Sioux City Community School District
- NCES district ID
- 1926400
- Math proficiency
- 54% ▼ -7.00%
- Reading proficiency
- 57% ▼ -2.00%
- Median HH income
- $44,967
- Composite
- 46.86/100
- National rank
- #2371
- State rank
- #264 of 289 in IA
Livability — Sioux City
- Score
- 78/100
- State rank
- #138
- US rank
- #2544
Category grades
Schools grade is shown separately in the Schools card above.
Census & demographics
- Census place
- Sioux City, IA
- City population
- 51,789
- Population (ZIP)
- 10,726
Population outlook (Woodbury County) Hauer SSP2
- Today (2025)
- 103,226 people
- By 2030
- 103,060 · -0.2%
- By 2040
- 102,533 · -0.7%
- By 2050
- 102,788 · -0.4%
- By 2075
- 107,227 · +3.9%
- By 2100
- 113,980 · +10.4%
Race, ethnicity, and origin ACS 2023
- Neighborhood character
- Diverse neighborhood (Simpson 0.69)
- Race & ethnicity
- Hispanic / Latino 40% White 38% Two or more races 29% Black 10% Native American 3% Asian 2%
- Hispanic origin (detail)
- Mexican 24% Puerto Rican 1%
- Common ancestry
- Portuguese 2% Iranian 1% Romanian 1%
- Foreign-born
- 25% · Canada, Vietnam
- Languages at home
- 55% English-only · Spanish 36% Vietnamese 2% Other Asian/Pacific 1%
Political lean MEDSL · Woodbury
- 2024 margin
- Strong R (+23.0) · D 37.8% · R 60.9% · Other 1.3%
- 2008→2024 swing
- -22.5pp toward R · 2008: -0.5pp · 2024: -23.0pp
- All cycles
- 2024: R+23.0 2020: R+15.5 2016: R+19.9 2012: R+0.2 2008: R+0.5
Not yet ingested
- Civics
- —
Market trends
- HPI YoY
- ▲ 3.78%
- Current HPI
- 226.3786
- Rent YoY
- —
- Metro
- —
- State GDP YoY
- ▲ 2.48%
- F500 in state
- 4
Industry mix (Fortune 500 HQ in IA)
| Industry | F500 HQs | Revenue |
|---|---|---|
| Financial Services | 1 | $16B |
|
||
| Retail / Convenience | 1 | $15B |
|
||
Price history
1 event — show timeline
- 2026-06-05 Listed $625,000 NWIA
Property tax history
+103.7%/yrLatest (2025): $1,652 · +20.6% YoY. Source: county tax records.
Cash-flow waterfall
monthlySold comps — $/sqft
last 12 mo · ≤1 miLoading sold comps…