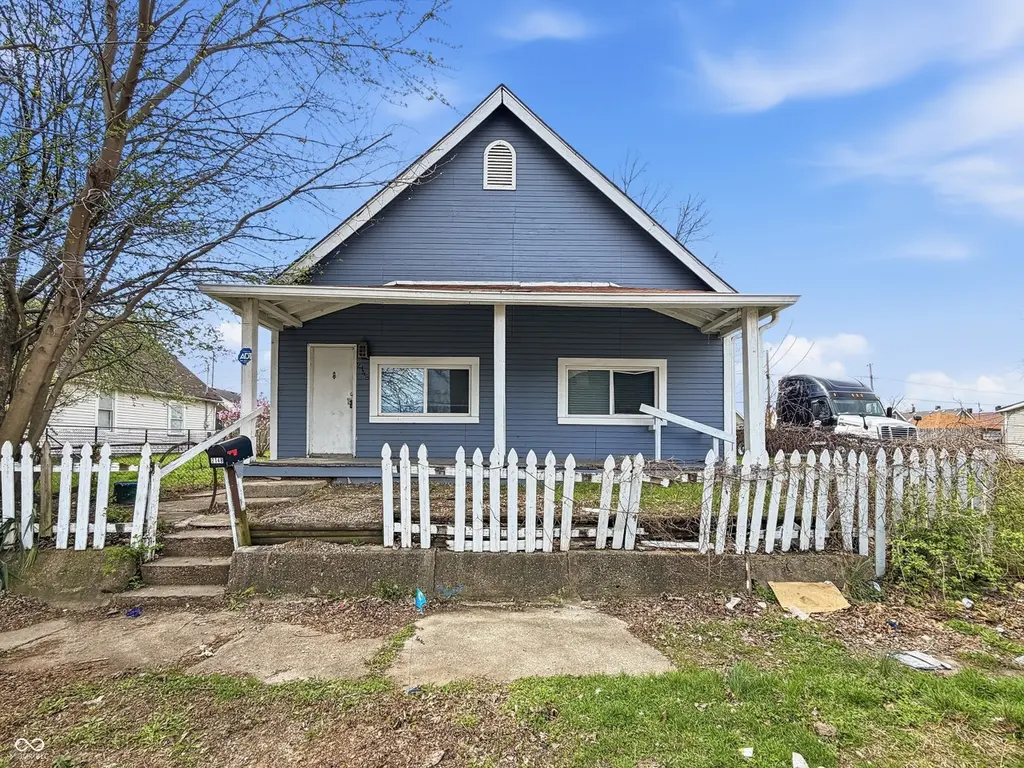
2148 Ransdell St · Indianapolis city (balance), IN
Flood risk 1/10 · Minimal
- FEMA flood zone
- X (unshaded)
- Chance of flooding over 30 yrs
- 0.0%
- Est. flood insurance / yr
- $473 – $860
Fire risk 1/10 · Minimal
- Est. fire insurance / yr
- $717 – $1,331
Heat risk 4/10 · Minor
- Hot days now (above 101°F)
- 7 days/yr
- Hot days in 30 yrs
- 19 days/yr
Wind risk 2/10 · Minimal
- Chance of severe wind over 30 yrs
- 0.0%
Air-quality risk 3/10 · Minor
- Unhealthy air days now
- 2 days/yr
- Unhealthy air days in 30 yrs
- 3 days/yr
Risk factors via First Street. Map © Google.
Why this score? — see what drove the B- grade
The composite is a weighted blend of 9 inputs, each scored 0–100. Each bar is that input's sub-score; the figure is the points it added to the 100-point composite (weight × sub-score).
- Cash flow +30.0/30.0
- DSCR +10.0/10.0
- 1% rule +9.6/10.0
- ARV discount +7.5/15.0
- Rent growth +5.0/5.0
- Livability +2.5/5.0
- Condition / age +2.5/5.0
- Schools +1.4/10.0
- Appreciation +0.0/10.0
$129,900
🖨 Deal sheet (PDF) 📄 Offer letter ✓ Due diligence
Listing remarks
Opportunity awaits with this spacious ranch-style home offering plenty of room and potential for the right buyer. With 4 bedrooms, 2 bathrooms, and over 1,500 square feet, this property could be transformed into something truly special. If you're looking for your next investment project or renovation opportunity, this is one you'll want to see in person. Built in 1906, this single-level home offers 1,568 square feet of living space with a functional layout and vinyl windows already in place. The property features a wood exterior that currently has significant damage, including rotting, splintering, and decaying areas, and will require substantial repairs and updates. There are also open hea
Key facts
- 8,160 sq ft lot
- Built 1906
- Listed 26 days
Property features AI
Finance
- Other: Finished lower-level/basement area (392); Total building area 3,136; living area 1,960; main-level finished area 1,568
Exterior
- Utilities: Public water; Municipal sewer connection; Solid waste service available
- Home design: Single-family residence; One level; Residential property
- Construction: Vinyl and wood siding; Partial block foundation
- Exterior features: Approximately 0.19-acre lot
Interior
- Kitchen: Electric oven; Refrigerator
- Bedrooms: Four bedrooms on the main level
- Bathrooms: Two full bathrooms on the main level
- Heating & cooling: Forced-air heating (natural gas); Central air conditioning
- Interior features: Woodwork stained or painted
- Laundry & utility: Washer; Main-level laundry room (7x4)
Neighborhood map
What this means for you Summary
Snapshot
- This is a 4-bed/2.0-bath single-family listed at $130k.
Deal economics
- At list price, monthly cash flow is $541 ($6k/yr) — positive.
- The deal already cash-flows at list — no discount required.
- Meets the 1% rule at list price ($2k rent vs $130k).
- Recommended offer: $128k (1.5% below list) — sets the bar for market timing.
- Cap rate 11.3% vs local median 4.4% in Indianapolis city (balance) — top-decile yield for the area; either an underpriced asset or a hidden risk that comps aren't pricing in. Stress-test before assuming the spread holds.
Location & tenants
- Location reads: area grade B — affects rentability + tenant quality, not the cash-flow math above.
- Indianapolis Public Schools (urban): math 14% / reading 20% proficiency, ranked #286 of 301 in IN (top 95%) — low school quality limits family demand, transient renter base, plan for 1-2y turnover; 77% free/reduced lunch — lower-income household profile, screen leases tightly.
- Zoned schools: Frederick Douglass School 19 (math 9% / reading 13%, grade F, #909 of 994 statewide, top 92%, 444 students, 81% FRL); H L Harshman Middle School (math 3% / reading 16%, grade F, #316 of 330 statewide, top 96%, 549 students, 84% FRL).
- Market conditions: Rents rising fast (+11.0%/yr); 131 active listings in the ZIP; 40 comparable units currently listed for rent nearby; rentals at typical pace (median 25d on market — plan ~3-4 weeks tenant-placement turnaround); 1,906 units permitted in Marion County in 2024 (621 in 5+ unit buildings).
- This rent runs 41% of the median local income ($55k/yr) — at the standard rent-burdened threshold; future hikes will face affordability resistance.
Forward outlook
- Local home prices are declining (-3.0%/yr); year-one equity from $898 of loan paydown is wiped out by about $4k of value loss. Plan a longer hold.
- Marion County population projected at +18% by 2050 — long-run rental-demand tailwind backs the buy-and-hold thesis.
- At projected returns (-3.0% appreciation + 8.0% rent growth), your $36k cash investment doubles in ~6 years — after that, you're playing with house money.
Negotiation context
- It's been on market 26 days — a 2% lower offer ($128k) is reasonable based on typical stale-listing flexibility.
- 6 sale attempts since 9y ago with the ask held roughly flat each time — persistent listings suggest the price (not the market) is what's stuck; bring a comps-based counter.
- Current owner paid $59k; list at $130k implies a 120% gain — meaningful room to come down on a strong offer.
Risks & watch-outs
- Watch-outs: built in 1906 — expect roof / HVAC / electrical / plumbing capex.
Questions for the listing agent
- Built in 1906 — when were the roof, HVAC, electrical panel, plumbing, and water heater last replaced?
- Is there a deadline driving the sale (1031 exchange, divorce, estate, relocation)? That informs how much negotiation room exists.
- What's the average days-on-market for RENTAL listings here right now (not sales)? A rising rental-DOM trend means longer vacancies and softer asking-rent achievability than the comps imply.
- What's the recent tenant-quality profile in this submarket — average credit score on applications, eviction rate, late-payment / NSF rate, and stable-employment percentage? A property-management company in the area should have these aggregated.
- How much new for-sale + rental construction is in the pipeline within 1–3 miles? Heavy new supply typically softens prices + rents 12–24 months out; constrained supply supports both.
Investment metrics
- 1% rule
- 1.46% ✓
- Cap rate
- 11.29%
- Cash-on-cash
- 17.86%
- DSCR
- 1.79
- GRM
- 5.7
CMA / ARV
- ARV (on-the-fly)
- $268,128
- Comps found
- 12
Show comp detail 12 sales within ~0.75 mi
| Address | Dist | Beds/Ba | Sqft | Sold | Price | $/sf | Match |
|---|---|---|---|---|---|---|---|
| 2142 Webb St | 0.06mi | 3/2.0 (-1) | 1,496 (-5%) | 3mo | $128,000 | $86 | 82 |
| 2302 S Pennsylvania St | 0.33mi | 3/3.0 (-1) | 1,590 (+1%) | 2mo | $275,000 | $173 | 71 |
| 2134 S Delaware St | 0.19mi | 3/3.0 (-1) | 1,680 (+7%) | 2mo | $195,000 | $116 | 68 |
| 14 E Regent St | 0.33mi | 3/2.5 (-1) | 1,496 (-5%) | 2mo | $270,000 | $180 | 68 |
| 1750 Union St | 0.45mi | 4/2.0 | 1,641 (+5%) | 4mo | $229,000 | $140 | 68 |
| 2165 Napoleon St | 0.48mi | 3/2.0 (-1) | 1,465 (-7%) | 1mo | $140,000 | $96 | 60 |
| 706 E Minnesota St | 0.57mi | 3/3.5 (-1) | 1,589 (+1%) | 3mo | $202,000 | $127 | 58 |
| 255 Iowa St | 0.37mi | 3/1.0 (-1) | 1,452 (-7%) | 6mo | $105,000 | $72 | 56 |
| 1036 E Tabor St | 0.61mi | 3/1.5 (-1) | 1,596 (+2%) | 8mo | $330,000 | $207 | 55 |
| 35 Iowa St | 0.49mi | 3/2.5 (-1) | 1,400 (-11%) | 2mo | $239,000 | $171 | 51 |
| 337 E Minnesota St | 0.44mi | 3/2.0 (-1) | 1,371 (-13%) | 8mo | $265,000 | $193 | 47 |
| 701 Weghorst St | 0.65mi | 3/3.0 (-1) | 1,761 (+12%) | 5mo | $370,000 | $210 | 36 |
Match score weights: distance 35% · size 25% · config 20% · recency 20%. Top-matched comps best support the ARV.
Projected returns pro-forma
-3.0% appreciation · 8.0% rent growth · sell at horizon
- IRR
- 15.1%
- Equity multiple
- 1.65×
- Total profit
- $23,505
- Equity at exit
- $19,369
- IRR
- 27.4%
- Equity multiple
- 4.04×
- Total profit
- $110,692
- Equity at exit
- $11,231
Cash invested: $36,372 (down + closing). Projections, not guarantees.
Landlord ↔ Tenant lean methodology
- Overall (STATE)
- 90 Strongly Landlord-Friendly
- State Indiana
- 90 Strongly Landlord-Friendly · R+11
- County
- — inherits STATE
- City
- — inherits STATE
ZIP-level market 46225
- Home prices YoY
- -8.2%
- Rents YoY
- 11.0%
- Active inventory
- 131
- Price-to-rent
- 5.7×
Monthly cashflow live
- Estimated rent
- $1,894 high interval (Pro) →
- Mortgage (P&I)
- −$681
- Tax from tax record
- −$220 /mo · $2,639/yr
- Insurance
- −$54
- HOA
- −$0
- Vacancy / Maint / Mgmt
- −$398
- Net cashflow
- $541
Break-even live
Sensitivity live
| Price | -10% $615 | -5% $578 | +0% $541 | +5% $505 | +10% $468 |
|---|---|---|---|---|---|
| Rent | -10% $392 | -5% $467 | +0% $541 | +5% $616 | +10% $691 |
| Rate | -1.0pp $607 | -0.5pp $574 | base $541 | +0.5pp $508 | +1.0pp $473 |
UW: 25.0% down · 7.5% · 30yr · 1.5% tax · 5.0% vac · 8.0% maint · 8.0% mgmt
Financing live
Cash to close
- Down payment
- $32,475
- Closing costs
- $3,897
- Reserves months
- —
- Total cash needed
- —
Loan-product check · same deal, 3 products live
Conventional
25% down · 7.5% · 30yr
- Down + closing
- —
- Monthly P&I
- —
- Monthly cashflow
- —
- DSCR
- —
- Eligible?
- —
Personal DTI + credit; lowest rate.
DSCR
20% down · 8.5% · 30yr
- Down + closing
- —
- Monthly P&I
- —
- Monthly cashflow
- —
- DSCR
- —
- Eligible?
- —
No personal income docs; deal must DSCR.
Hard money
10% down · 12.0% · 12mo
- Down + closing
- —
- Monthly P&I
- —
- Monthly cashflow
- —
- DSCR
- —
- Eligible?
- —
Short-term bridge; refi at stabilization.
Rent comps 40 comps
| Address | Beds | Baths | Sqft | Rent | $/sqft | DOM | Units | Dist |
|---|---|---|---|---|---|---|---|---|
| 2109 Singleton St Indianapolis, IN | 3.0 | 2.0 | 1340 | $2,100 | $1.57 | 9d | 1 | 0.23mi |
| 438 E Beecher St Indianapolis, IN | 3.0 | 2.5 | 1500 | $1,450 | $0.97 | 25d | 1 | 0.30mi |
| 620 E Beecher St Indianapolis, IN | 3.0 | 2.0 | 1072 | $1,639 | $1.53 | 21d | 1 | 0.35mi |
| 2283 Union St Indianapolis, IN | 3.0 | 2.0 | 1824 | $1,820 | $1.00 | 25d | 1 | 0.36mi |
| 224 Iowa St Indianapolis, IN | 3.0 | 1.0 | 1254 | $1,450 | $1.16 | 25d | 1 | 0.40mi |
| 1830 Orleans St Indianapolis, IN | 3.0 | 2.5 | 1586 | $1,995 | $1.26 | 45d | 1 | 0.43mi |
| 1833 Orleans St Unit 1 Indianapolis, IN | 3.0 | 1.0 | 1260 | $1,350 | $1.07 | 45d | 1 | 0.44mi |
| 1835 Applegate St Indianapolis, IN | 4.0 | 3.0 | 2024 | $2,300 | $1.14 | 45d | 1 | 0.48mi |
| 1436 S New Jersey St Unit A Indianapolis, IN | 3.0 | 2.5 | 1300 | $2,100 | $1.62 | 25d | 1 | 0.63mi |
| 110 Pennsylvania Ct Indianapolis, IN | 3.0 | 2.0 | 1202 | $1,700 | $1.41 | 6d | 1 | 0.67mi |
| 243 Terrace Ave Indianapolis, IN | 4.0 | 2.0 | 1669 | $2,700 | $1.62 | 19d | 1 | 0.69mi |
| 1703 Ringgold Ave Indianapolis, IN | 3.0 | 2.0 | 1712 | $1,700 | $0.99 | 0d | 1 | 0.71mi |
| 835 Weghorst St Unit 837 Indianapolis, IN | 3.0 | 1.5 | 1500 | $1,399 | $0.93 | 25d | 1 | 0.71mi |
| 743 Cottage Ave Indianapolis, IN | 5.0 | 2.0 | 2233 | $1,995 | $0.89 | 45d | 1 | 0.72mi |
| 728 Cottage Ave Indianapolis, IN | 3.0 | 2.5 | 1831 | $2,550 | $1.39 | 25d | 1 | 0.73mi |
| 752 Cottage Ave Indianapolis, IN | 3.0 | 2.0 | 1548 | $1,750 | $1.13 | 16d | 1 | 0.75mi |
| 614 Parkway Ave Indianapolis, IN | 3.0 | 2.0 | 1360 | $1,850 | $1.36 | 0d | 1 | 0.80mi |
| 2760 S East St Indianapolis, IN | 2.0–3.0 | 2.0 | 1072 | $1,045 | $0.97 | 5d | 3 | 0.82mi |
| 726 Parkway Ave Indianapolis, IN | 3.0 | 2.0 | 1150 | $2,195 | $1.91 | 19d | 1 | 0.82mi |
| 2770 S East St Apt 103 Indianapolis, IN | 3.0 | 2.0 | 1190 | $1,045 | $0.88 | 16d | 1 | 0.82mi |
| 1514 Ringgold Ave Indianapolis, IN | 3.0 | 1.0 | 1064 | $1,295 | $1.22 | 45d | 1 | 0.82mi |
| 2770 South East St Unit 302 Indianapolis, IN | 3.0 | 2.0 | 1158 | $1,015 | $0.88 | 4d | 1 | 0.82mi |
| 734 Parkway Ave Indianapolis, IN | 3.0 | 2.0 | 2110 | $2,299 | $1.09 | 25d | 1 | 0.83mi |
| 406 Orange St Indianapolis, IN | 3.0 | 2.5 | 1820 | $2,250 | $1.24 | 45d | 1 | 0.83mi |
| 1258 E Naomi St Indianapolis, IN | 3.0 | 2.0 | 1608 | $1,450 | $0.90 | 9d | 1 | 0.88mi |
| 2020 Boyd Ave Indianapolis, IN | 3.0 | 1.5 | 1160 | $1,450 | $1.25 | 25d | 1 | 0.90mi |
| 2018 Boyd Ave Indianapolis, IN | 3.0 | 1.5 | 1160 | $1,350 | $1.16 | 45d | 1 | 0.90mi |
| 1247 Wright St Indianapolis, IN | 3.0 | 1.5 | 1809 | $1,750 | $0.97 | 45d | 1 | 0.90mi |
| 1247 Wright St Indianapolis, IN | 3.0 | 1.5 | 1247 | $1,750 | $1.40 | 19d | 1 | 0.90mi |
| 1399 Hoefgen St Indianapolis, IN | 5.0 | 3.0 | 2122 | $2,100 | $0.99 | 0d | 1 | 0.95mi |
| 1528 E Tabor St Indianapolis, IN | 3.0 | 1.5 | 2200 | $1,550 | $0.70 | 16d | 1 | 0.98mi |
| 1742 Thaddeus St Unit 1742-A Indianapolis, IN | 3.0 | 2.0 | 1350 | $1,600 | $1.19 | 15d | 1 | 1.00mi |
| 518 Prospect St Unit 1353834P Indianapolis, IN | 3.0 | 2.0 | 1603 | $2,442 | $1.52 | 16d | 1 | 1.02mi |
| 518 Prospect St Unit 1357365P Indianapolis, IN | 3.0 | 2.0 | 1614 | $2,594 | $1.61 | 9d | 1 | 1.02mi |
| 1729 Thaddeus St Unit 1729-B Indianapolis, IN | 3.0 | 2.0 | 1350 | $1,600 | $1.19 | 15d | 1 | 1.03mi |
| 907 Prospect St Unit 907 Prospect NO AMI Indianapolis, IN | 3.0 | 1.5 | 1121 | $1,400 | $1.25 | 25d | 1 | 1.08mi |
| 1012 Prospect St Unit 512 State 120% AMI Indianapolis, IN | 3.0 | 1.0 | 1200 | $1,400 | $1.17 | 45d | 1 | 1.15mi |
| 1012 Prospect St Unit 907 Prospect NO AMI Indianapolis, IN | 3.0 | 1.5 | 1121 | $1,400 | $1.25 | 45d | 1 | 1.15mi |
| 1012 Prospect St Unit 1527 Indianapolis, IN | 3.0 | 1.5 | 1150 | $1,200 | $1.04 | 45d | 1 | 1.15mi |
| 1330 Laurel St Indianapolis, IN | 3.0 | 2.0 | 1911 | $2,250 | $1.18 | 22d | 1 | 1.16mi |
Listing history 29 events
-
2026-06-21days on market $129,900 Active 26 DOM
-
2026-06-18days on market $129,900 Active 23 DOM
-
2026-06-17days on market $129,900 Active 22 DOM
-
2026-06-16days on market $129,900 Active 21 DOM
-
2026-06-15days on market $129,900 Active 20 DOM
-
2026-06-13days on market $129,900 Active 18 DOM
-
2026-06-13days on market $129,900 Active 17 DOM
-
2026-06-09days on market $129,900 Active 14 DOM
-
2026-06-08days on market $129,900 Active 13 DOM
-
2026-06-07days on market $129,900 Active 12 DOM
-
2026-06-03days on market $129,900 Active 8 DOM
-
2026-06-02days on market $129,900 Active 7 DOM
-
2026-06-01days on market $129,900 Active 6 DOM
-
2026-05-31days on market $129,900 Active 5 DOM
-
2026-05-26$129,900 Active
-
2023-01-26historical
-
2023-01-03$125,000 Active
-
2020-01-03historical
-
2019-12-11price $109,900
-
2019-11-22$114,900 Active
-
2018-07-02soldstatus $58,999 Sold
-
2018-05-10status Pending
-
2018-05-09status Active
-
2018-03-29historical
-
2018-03-09$58,999 Active
-
2017-10-27soldstatus $27,000 Sold
-
2017-10-09status Pending
-
2017-10-07price $29,900
-
2017-09-08$31,500 Active
ⓘ Source: listings_history table (triggers on properties + properties_extension) + one-shot
backfill from property_details.listing_events for pre-trigger history.
Tax reassessment forecast IN · Partial reset (capped growth)
- Current annual tax
- $2,639 · $220/mo
- Projected year-2 tax
- $2,639 · $220/mo
- Expected delta
- $0/yr ($0/mo · 0.0%)
ⓘ Screening estimate from a state-policy table — verify with the county assessor before closing.
Climate risk First Street
- Flood 1/10 Low FEMA zone X (unshaded) · 0% chance over 30 yrs
- Wildfire 1/10 Low
- Heat 4/10 Moderate 7 d/yr ≥101°F today · 19 d/yr by 30 yrs out
- Wind 2/10 Low 0% chance of damaging wind over 30 yrs
- Air quality 3/10 Moderate 2 unhealthy d/yr today · 3 by 30 yrs out
Nearby sold comps map
Loading sold comps map…
Walkable amenities ~0.75 mi
Loading nearby amenities…
Taxation est. · year 1
- Rental income
- $22,734
- − Mortgage interest
- −$7,276
- − Property taxes
- −$2,639
- − Insurance
- −$650
- − Repairs & maintenance
- −$1,819
- − Management
- −$1,819
- − Depreciation
- −$3,779
- Taxable income
- $4,752
- Est. tax owed @ 24.0%
- −$1,140
- After-tax cash flow
- $5,356/yr
For passive investors: Depreciation is non-cash, so a rental often shows a tax loss while cash-flowing — sheltering income. Rental losses are passive: they offset passive income freely, and up to $25,000/yr can offset ordinary (W-2) income if you actively participate and your MAGI is under $100k (phasing out to $0 by $150k); unused losses carry forward. On sale, claimed depreciation is recaptured at up to 25%, and gains may owe capital-gains tax (a 1031 exchange can defer both). Figures are a year-1 estimate at your 24.0% rate — not tax advice; consult a CPA.
Schools (NCES district)
- District
- Indianapolis Public Schools
- NCES district ID
- 1804770
- Math proficiency
- 14% ▼ -7.00%
- Reading proficiency
- 20% ▼ -3.00%
- Median HH income
- $32,034
- Composite
- 13.69/100
- National rank
- #9499
- State rank
- #286 of 301 in IN
Livability — Indianapolis city (balance)
No livability data for this city. (Only ~50 U.S. cities are tracked.)
Census & demographics
- Census place
- Indianapolis city (balance), IN
- County
- Marion County · 998,460 people
- City population
- 881,119
- Metro
- Indianapolis-Carmel-Anderson, IN
- Population (ZIP)
- 6,037
- Household income
- $55,190
- Rent vs Own
- Severe rent burden
- 311.0
Population outlook (Marion County) Hauer SSP2
- Today (2025)
- 1,025,572 people
- By 2030
- 1,065,727 · +3.9%
- By 2040
- 1,141,577 · +11.3%
- By 2050
- 1,208,920 · +17.9%
- By 2075
- 1,367,288 · +33.3%
- By 2100
- 1,438,201 · +40.2%
Race, ethnicity, and origin ACS 2023
- Neighborhood character
- Predominantly White (68%)
- Race & ethnicity
- White 68% Two or more races 12% Black 11% Hispanic / Latino 10% Asian 2%
- Hispanic origin (detail)
- Mexican 6%
- Common ancestry
- Romanian 2% Italian 2% Slovak 1%
- Foreign-born
- 9% · Canada
- Languages at home
- 88% English-only · Spanish 10% German/W. Germanic 1%
Political lean MEDSL · Marion
- 2024 margin
- Strong D (+27.7) · D 63.0% · R 35.3% · Other 1.7%
- 2008→2024 swing
- -0.7pp no change · 2008: 28.4pp · 2024: 27.7pp
- All cycles
- 2024: D+27.7 2020: D+29.1 2016: D+22.8 2012: D+22.2 2008: D+28.4
Not yet ingested
- Civics
- —
Market trends
- HPI YoY
- ▼ -36.19%
- Current HPI
- 403.9271
- Rent YoY
- ▲ 10.98%
- Metro
- Indianapolis-Carmel-Anderson, IN
- State GDP YoY
- ▲ 2.90%
- F500 in state
- 18
Industry mix (Fortune 500 HQ in IN)
| Industry | F500 HQs | Revenue |
|---|---|---|
| Industrial Machinery | 2 | $37B |
|
||
| Healthcare | 1 | $177B |
|
||
| Pharmaceuticals | 1 | $45B |
|
||
| Metals / Steel | 1 | $18B |
|
||
| Agriculture | 1 | $17B |
|
||
| Packaging | 1 | $12B |
|
||
Price history
+312.4% since first listed15 events — show timeline
- 2026-05-26 Listed $129,900 MIBOR as Distributed by MLS Grid
- 2023-01-26 Listing Removed — MIBOR as Distributed by MLS Grid
- 2023-01-03 Listed $125,000 MIBOR as Distributed by MLS Grid
- 2020-01-03 Listing Removed — MIBOR as Distributed by MLS Grid
- 2019-12-11 Price Changed $109,900 MIBOR as Distributed by MLS Grid
- 2019-11-22 Listed $114,900 MIBOR as Distributed by MLS Grid
- 2018-07-02 Sold (MLS) $58,999 MIBOR as Distributed by MLS Grid
- 2018-05-10 Pending — MIBOR as Distributed by MLS Grid
- 2018-05-09 Relisted — MIBOR as Distributed by MLS Grid
- 2018-03-29 Listing Removed — MIBOR as Distributed by MLS Grid
- 2018-03-09 Listed $58,999 MIBOR as Distributed by MLS Grid
- 2017-10-27 Sold (MLS) $27,000 MIBOR as Distributed by MLS Grid
- 2017-10-09 Pending — MIBOR as Distributed by MLS Grid
- 2017-10-07 Price Changed $29,900 MIBOR as Distributed by MLS Grid
- 2017-09-08 Listed $31,500 MIBOR as Distributed by MLS Grid
Property tax history
+9.0%/yrLatest (2025): $2,639 · +3.7% YoY. Source: county tax records.
Cash-flow waterfall
monthlySold comps — $/sqft
last 12 mo · ≤1 miLoading sold comps…