3771 Highway 311 · Green Forest, AR
Flood risk 1/10 · Minimal
- FEMA flood zone
- X (unshaded)
- Chance of flooding over 30 yrs
- 0.0%
- Est. flood insurance / yr
- $507 – $1,088
Fire risk 5/10 · Moderate
- Est. fire insurance / yr
- $1,499 – $2,785
Heat risk 4/10 · Minor
- Hot days now (above 104°F)
- 7 days/yr
- Hot days in 30 yrs
- 21 days/yr
Wind risk 2/10 · Minimal
- Chance of severe wind over 30 yrs
- 2.0%
Air-quality risk 2/10 · Minimal
- Unhealthy air days now
- 0 days/yr
- Unhealthy air days in 30 yrs
- 1 days/yr
Risk factors via First Street. Map © Google.
Why this score? — see what drove the D grade
The composite is a weighted blend of 9 inputs, each scored 0–100. Each bar is that input's sub-score; the figure is the points it added to the 100-point composite (weight × sub-score).
- Cash flow +12.0/30.0
- Appreciation +7.6/10.0
- ARV discount +7.5/15.0
- DSCR +3.6/10.0
- Livability +3.2/5.0
- Schools +2.6/10.0
- Rent growth +2.5/5.0
- Condition / age +2.5/5.0
- 1% rule +2.3/10.0
$165,000
🖨 Deal sheet (PDF) 📄 Offer letter ✓ Due diligence
Listing remarks
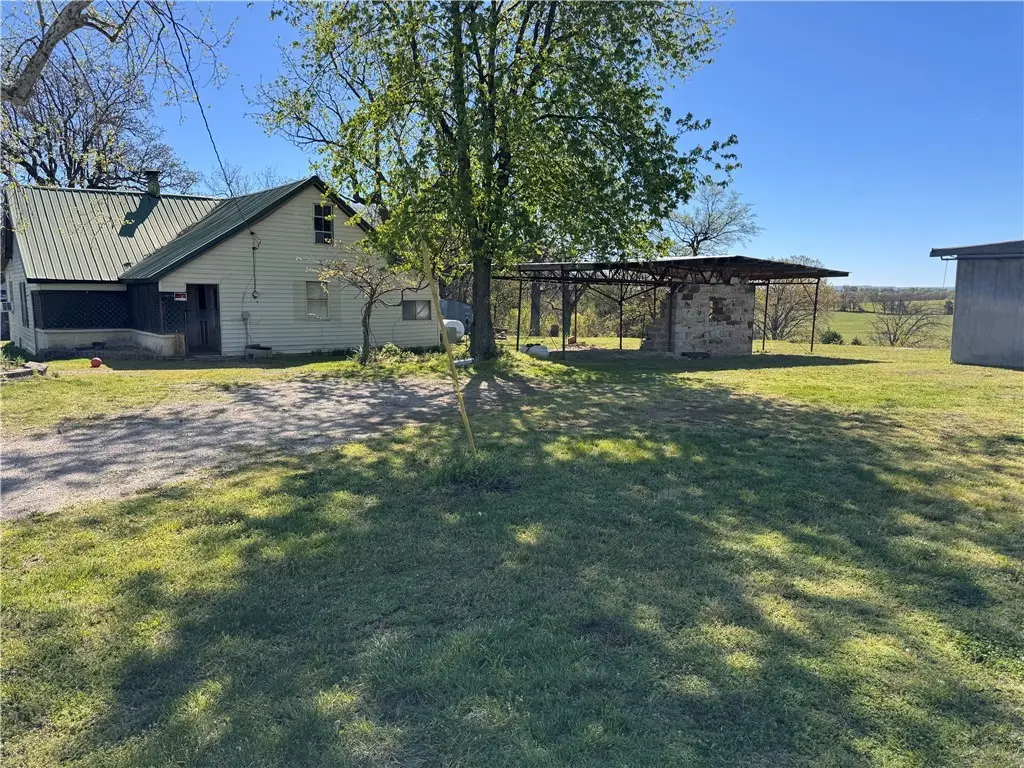
Opportunity awaits with this 6-acre tract located on Hwy 311 near Green Forest. The property includes a home that is currently partially livable and offers excellent potential for renovation, repair, or future improvement. With highway frontage, usable acreage, and a rural setting, this property presents opportunities for a residence, investment property, or future homesite. Buyers are encouraged to inspect and verify condition to their satisfaction. This property is being offered separately from the adjoining commercial tract as part of a larger property division. See MLS #1341866 , MLS #1341870 and MLS #1349277 for related listings. Additional adjoining property may be available. Acreage,
Key facts
- Highway frontage
- 6 acre tract
- Rural setting
Tags
Property features AI
Finance
- Other: Approximately 6 acres total (includes about 5 acres pasture and 1 acre wooded)
- Financial info: Annual tax amount reported
- HOA & community: Association fees billed monthly
Exterior
- Parking: Gravel driveway
- Utilities: Electricity available; Natural gas available
- Home design: 2-story; Block foundation
- Construction: Wood siding; Asphalt shingle roof; Built on block foundation
- Exterior features: Gravel driveway; Covered porch/patio; Guest house; Outbuilding; Partial fencing; Property located outside city limits; Highway road frontage
Interior
- Kitchen: Electric oven
- Flooring: Laminate
- Bathrooms: 2 full bathrooms
- Heating & cooling: Gas heating
- Interior features: Laminate flooring; No additional interior features listed
- Laundry & utility: Washer hookup; Dryer hookup; Electric water heater
Neighborhood map
What this means for you Summary
Snapshot
- This is a 3-bed/1.0-bath single-family listed at $165k.
Deal economics
- At list price, monthly cash flow is $-38 ($-453/yr) — negative.
- To cash-flow at today's rent, offer at most $158k (4.0% below list).
- To meet the 1% rule (rent ≥ 1% of price), the offer needs to be $120k (27.2% below list).
- Recommended offer: $120k (27.2% below list) — sets the bar for 1% rule.
Location & tenants
- Location reads 65/100 on livability (#143 in AR) — a middle-class / working-renter tenant base. Strengths: cost of living A+, housing A+, health & safety A+; Watch: crime D+, amenities F, commute F.
- Green Forest School District (town): math 31% / reading 32% proficiency, ranked #145 of 238 in AR (top 61%) — families likely to look elsewhere, expect single-tenant / working-renter base with shorter leases; 68% free/reduced lunch — lower-income household profile, screen leases tightly.
- Zoned schools: Green Forest Elementary School (math 67% / reading 47%, grade C+, #49 of 454 statewide, top 12%, 479 students, 83% FRL); Green Forest Intermed School (math 32% / reading 32%, grade F, #133 of 201 statewide, top 66%, 547 students, 71% FRL); Green Forest High School (math 15% / reading 27%, grade F, #228 of 292 statewide, top 79%, 441 students, 68% FRL).
- Market conditions: 57 active listings in the ZIP; 30 units permitted in Carroll County in 2024 (0 in 5+ unit buildings).
Forward outlook
- In year one you build about $10k of equity ($1k loan paydown + $8k appreciation (5.1% local appreciation)).
- Carroll County population projected at +4% by 2050 — modest demand growth; plan on rents tracking national, not racing it.
- At projected returns (5.1% appreciation + 3.0% rent growth), your $46k cash investment doubles in ~5 years — after that, you're playing with house money.
- By year 4, paydown + projected appreciation supports a ~$33k cash-out refi (75% LTV) — recoverable capital for the next deal without selling this one.
Negotiation context
- Only 5 days on market — expect competitive offers; lowballing is unlikely to land.
- Current owner paid $24k; list at $165k implies a 602% gain — meaningful room to come down on a strong offer.
Risks & watch-outs
- Watch-outs: built in 1900 — expect roof / HVAC / electrical / plumbing capex.
- Climate carrying-cost: moderate wildfire risk — expect insurance premiums to compound above CPI over the hold.
Questions for the listing agent
- What do current leases actually rent for vs. the listed asking? Can we see a recent rent roll and the last 12 months of T-12 income?
- Built in 1900 — when were the roof, HVAC, electrical panel, plumbing, and water heater last replaced?
- Is there a deadline driving the sale (1031 exchange, divorce, estate, relocation)? That informs how much negotiation room exists.
- Schools are F-rated, which usually means shorter tenancies and higher turnover. Who's the typical renter profile here, and what's been the actual vacancy rate?
- Crime grade is D in this area — have there been break-ins, vandalism, or insurance claims at this property in the last 3 years? What carrier currently insures it and at what premium?
- The area grade is low — what's the realistic commute time and amenity access for the typical tenant pool here? Any planned neighborhood developments (good or bad) we should know about?
- What's the average days-on-market for RENTAL listings here right now (not sales)? A rising rental-DOM trend means longer vacancies and softer asking-rent achievability than the comps imply.
- What's the recent tenant-quality profile in this submarket — average credit score on applications, eviction rate, late-payment / NSF rate, and stable-employment percentage? A property-management company in the area should have these aggregated.
- How much new for-sale + rental construction is in the pipeline within 1–3 miles? Heavy new supply typically softens prices + rents 12–24 months out; constrained supply supports both.
Investment metrics
- 1% rule
- 0.73% ✗
- Cap rate
- 6.02%
- Cash-on-cash
- -0.98%
- DSCR
- 0.96
- GRM
- 11.4
CMA / ARV
No comps found within radius.
Projected returns pro-forma
5.14% appreciation · 3.0% rent growth · sell at horizon
- IRR
- 12.4%
- Equity multiple
- 1.80×
- Total profit
- $36,866
- Equity at exit
- $94,902
- IRR
- 13.3%
- Equity multiple
- 3.44×
- Total profit
- $112,804
- Equity at exit
- $164,956
Cash invested: $46,200 (down + closing). Projections, not guarantees.
Landlord ↔ Tenant lean methodology
- Overall (STATE)
- 92 Strongly Landlord-Friendly
- State Arkansas
- 92 Strongly Landlord-Friendly · R+14
- County
- — inherits STATE
- City
- — inherits STATE
ZIP-level market 72638
- Home prices YoY
- 1.9%
- Active inventory
- 57
- Price-to-rent
- 11.4×
Monthly cashflow live
- Estimated rent
- $1,201 medium interval (Pro) →
- Mortgage (P&I)
- −$865
- Tax from tax record
- −$53 /mo · $635/yr
- Insurance
- −$69
- HOA
- −$0
- Vacancy / Maint / Mgmt
- −$252
- Net cashflow
- $-38
Break-even live
Sensitivity live
| Price | -10% $56 | -5% $9 | +0% $-38 | +5% $-84 | +10% $-131 |
|---|---|---|---|---|---|
| Rent | -10% $-133 | -5% $-85 | +0% $-38 | +5% $10 | +10% $57 |
| Rate | -1.0pp $45 | -0.5pp $4 | base $-38 | +0.5pp $-80 | +1.0pp $-124 |
UW: 25.0% down · 7.5% · 30yr · 1.5% tax · 5.0% vac · 8.0% maint · 8.0% mgmt
Financing live
Cash to close
- Down payment
- $41,250
- Closing costs
- $4,950
- Reserves months
- —
- Total cash needed
- —
Loan-product check · same deal, 3 products live
Conventional
25% down · 7.5% · 30yr
- Down + closing
- —
- Monthly P&I
- —
- Monthly cashflow
- —
- DSCR
- —
- Eligible?
- —
Personal DTI + credit; lowest rate.
DSCR
20% down · 8.5% · 30yr
- Down + closing
- —
- Monthly P&I
- —
- Monthly cashflow
- —
- DSCR
- —
- Eligible?
- —
No personal income docs; deal must DSCR.
Hard money
10% down · 12.0% · 12mo
- Down + closing
- —
- Monthly P&I
- —
- Monthly cashflow
- —
- DSCR
- —
- Eligible?
- —
Short-term bridge; refi at stabilization.
Listing history 6 events
-
2026-06-04statusdays on market $165,000 Pending 5 DOM
-
2026-06-02days on market $165,000 Active 4 DOM
-
2026-06-01days on market $165,000 Active 3 DOM
-
2026-05-31days on market $165,000 Active 2 DOM
-
2026-05-31remarks 699-char remark
-
2026-05-31$165,000 Active 1 DOM
ⓘ Source: listings_history table (triggers on properties + properties_extension) + one-shot
backfill from property_details.listing_events for pre-trigger history.
Tax reassessment forecast AR · Resets to sale price
- Current annual tax
- $635 · $53/mo
- Projected year-2 tax
- $1,056 · $88/mo
- Expected delta
- +$421/yr (+$35/mo · 66.4%)
ⓘ Screening estimate from a state-policy table — verify with the county assessor before closing.
Climate risk First Street
- Flood 1/10 Low FEMA zone X (unshaded) · 0% chance over 30 yrs
- Wildfire 5/10 Major
- Heat 4/10 Moderate 7 d/yr ≥104°F today · 21 d/yr by 30 yrs out
- Wind 2/10 Low 2% chance of damaging wind over 30 yrs
- Air quality 2/10 Low 0 unhealthy d/yr today · 1 by 30 yrs out
Nearby sold comps map
Loading sold comps map…
Walkable amenities ~0.75 mi
Loading nearby amenities…
Taxation est. · year 1
- Rental income
- $14,418
- − Mortgage interest
- −$9,243
- − Property taxes
- −$635
- − Insurance
- −$825
- − Repairs & maintenance
- −$1,153
- − Management
- −$1,153
- − Depreciation
- −$4,800
- Taxable loss
- −$3,391
- Est. tax savings @ 24.0%
- +$814
- After-tax cash flow
- $361/yr
For passive investors: Depreciation is non-cash, so a rental often shows a tax loss while cash-flowing — sheltering income. Rental losses are passive: they offset passive income freely, and up to $25,000/yr can offset ordinary (W-2) income if you actively participate and your MAGI is under $100k (phasing out to $0 by $150k); unused losses carry forward. On sale, claimed depreciation is recaptured at up to 25%, and gains may owe capital-gains tax (a 1031 exchange can defer both). Figures are a year-1 estimate at your 24.0% rate — not tax advice; consult a CPA.
Schools (NCES district)
- District
- Green Forest School District
- NCES district ID
- 0506870
- Math proficiency
- 31% ▼ -10.00%
- Reading proficiency
- 32% ▼ -5.00%
- Median HH income
- $39,211
- Composite
- 26.42/100
- National rank
- #7225
- State rank
- #145 of 238 in AR
Livability — Green Forest
- Score
- 65/100
- State rank
- #143
- US rank
- #12618
Category grades
Schools grade is shown separately in the Schools card above.
Census & demographics
- Population (ZIP)
- 7,068
Population outlook (Carroll County) Hauer SSP2
- Today (2025)
- 28,014 people
- By 2030
- 28,006 · +-0.0%
- By 2040
- 28,242 · +0.8%
- By 2050
- 29,169 · +4.1%
- By 2075
- 33,935 · +21.1%
- By 2100
- 39,497 · +41.0%
Race, ethnicity, and origin ACS 2023
- Neighborhood character
- Diverse neighborhood (Simpson 0.62)
- Race & ethnicity
- White 54% Hispanic / Latino 30% Two or more races 23% Pacific Islander 4% Asian 3% Native American 1%
- Hispanic origin (detail)
- Mexican 22%
- Common ancestry
- Portuguese 3% Iranian 1% Lithuanian 1%
- Foreign-born
- 17% · Canada
- Languages at home
- 77% English-only · Spanish 18% Other Asian/Pacific 4%
Political lean MEDSL · Carroll
- 2024 margin
- Solid R (+31.7) · D 33.0% · R 64.7% · Other 2.2%
- 2008→2024 swing
- -13.6pp toward R · 2008: -18.1pp · 2024: -31.7pp
- All cycles
- 2024: R+31.7 2020: R+28.8 2016: R+32.3 2012: R+23.9 2008: R+18.1
Not yet ingested
- Civics
- —
Market trends
- HPI YoY
- ▲ 5.14%
- Current HPI
- 283.1194
- Rent YoY
- —
- Metro
- —
- State GDP YoY
- ▲ 3.80%
- F500 in state
- 10
Industry mix (Fortune 500 HQ in AR)
| Industry | F500 HQs | Revenue |
|---|---|---|
| Retail | 1 | $681B |
|
||
| Food / Agriculture | 1 | $53B |
|
||
| Retail / Energy | 1 | $22B |
|
||
| Transportation / Logistics | 1 | $12B |
|
||
| Energy | 1 | $4B |
|
||
Price history
+1550.0% since first listed3 events — show timeline
- 2026-05-29 Listed $165,000 NWARMLS
- 1992-11-10 Sold (Public Records) $23,500 Public Records
- 1984-03-24 Sold (Public Records) $10,000 Public Records
Property tax history
+0.8%/yrLatest (2025): $635 · -33.4% YoY. Source: county tax records.
Cash-flow waterfall
monthlySold comps — $/sqft
last 12 mo · ≤1 miLoading sold comps…