 🌊 Lakefront
2056 Giant Cactus · San Antonio, TX
Flood risk 1/10 · Minimal
- FEMA flood zone
- A
- Chance of flooding over 30 yrs
- 0.0%
- Est. flood insurance / yr
- $1,009 – $1,996
Fire risk 1/10 · Minimal
- Est. fire insurance / yr
- $1,222 – $2,270
Heat risk 7/10 · Major
- Hot days now (above 109°F)
- 3 days/yr
- Hot days in 30 yrs
- 9 days/yr
Wind risk 8/10 · Major
- Chance of severe wind over 30 yrs
- 80.0%
Air-quality risk 2/10 · Minimal
- Unhealthy air days now
- 0 days/yr
- Unhealthy air days in 30 yrs
- 1 days/yr
Risk factors via First Street. Map © Google.
Why this score? — see what drove the D- grade
The composite is a weighted blend of 9 inputs, each scored 0–100. Each bar is that input's sub-score; the figure is the points it added to the 100-point composite (weight × sub-score).
- Cash flow +13.2/30.0
- Appreciation +6.0/10.0
- Condition / age +4.8/5.0
- DSCR +4.0/10.0
- Livability +4.0/5.0
- 1% rule +3.8/10.0
- Schools +1.8/10.0
- Rent growth +0.7/5.0
- ARV discount +0.0/15.0
$199,840
🖨 Deal sheet 📄 Offer letter ✓ Due diligence
Listing remarks
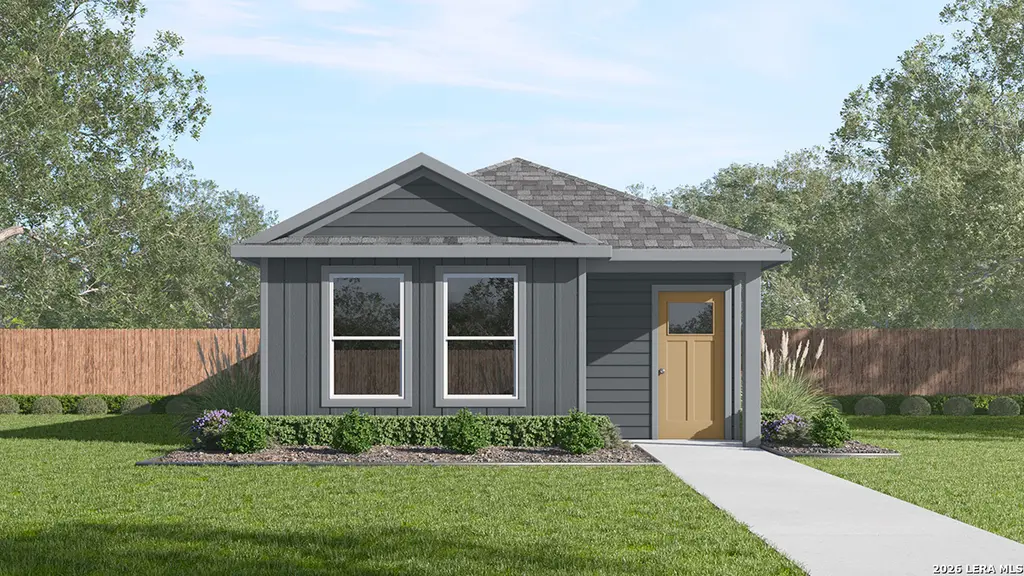
Introducing The Wyeth, a beautiful floor plan featured in the Sonora new construction home community in San Antonio, TX. This thoughtfully designed single-story home offers 1023 square feet of living space, with 3 bedrooms and 2 bathrooms, making it the perfect option for families or those looking. The home's exterior is available in two elevation options, both featuring durable James Hardie siding for long-lasting beauty, for a cozy, yet spacious home. The Wyeth replaces a traditional garage with a driveway, providing convenient parking and easy access. The open and blended layout combines the living room, dining area, and kitchen, creating a seamless space for both everyday living and ent
Key facts
- James hardie siding
- Open blended layout
- Driveway parking
Tags
Property features AI
Finance
- Financial info: Down payment resource not available
- HOA & community: Mandatory HOA with an annual fee of $180
Exterior
- Parking: Information not provided
- Security: Smoke alarm and carbon monoxide detector
- Utilities: City water and sewer (SAWS); Gas and electricity supplied by CPS; HERS rated with low-flow commode
- Home design: New construction by D.R. Horton; Siding and cement fiber exterior; Slab foundation; Composition roof; Subdivision: SONORA
- Construction: New build; Siding and cement fiber exterior; Composition roof; Slab foundation
- Exterior features: Patio slab; Privacy fence; Sprinkler system; Double-pane windows; Street paved with curbs and streetlights
Interior
- Kitchen: Island kitchen; Microwave; Stove/Range; Dishwasher; Disposal; Ice maker connection; Walk-in pantry; Solid countertops
- Bedrooms: Master bedroom with walk-in closet and full bath (12 x 10); Bedroom 2 (10 x 10); Bedroom 3 (10 x 9)
- Flooring: Carpeting; Vinyl flooring
- Bathrooms: 2 full bathrooms; Master bath with shower-only and single vanity (5 x 5)
- Heating & cooling: Central heating (electric); Central air conditioning
- Interior features: Open floor plan with living/dining room combination; Island kitchen; Walk-in pantry; Utility room inside / laundry room; Washer and dryer connections; Microwave, stove/range, dishwasher, disposal, ice maker connection; Solid countertops; Smoke alarm and carbon monoxide detector; Attic with pull-down stairs; High-speed internet available; Ground-level entry (no steps); 1 living area
- Laundry & utility: Washer connection; Dryer connection; Utility room inside; Laundry room
Neighborhood map
What this means for you Summary
Snapshot
- This is a 3-bed/2.0-bath single-family listed at $200k. Condition is rated excellent.
Deal economics
- At list price, monthly cash flow is $-128 ($-2k/yr) — negative.
- To cash-flow at today's rent, offer at most $181k (9.3% below list).
- To meet the 1% rule (rent ≥ 1% of price), the offer needs to be $176k (11.7% below list).
- Recommended offer: $176k (11.7% below list) — sets the bar for 1% rule.
- Cap rate 6.3% vs local median 3.8% in San Antonio — top-decile yield for the area; either an underpriced asset or a hidden risk that comps aren't pricing in. Stress-test before assuming the spread holds.
Location & tenants
- Location reads 80/100 on livability (#31 in TX, #1,616 nationally) — a professional / high-income tenant draw. Strengths: amenities A+, commute A+, cost of living A+; Watch: crime F.
- Southside ISD (rural): math 16% / reading 25% proficiency, ranked #771 of 826 in TX (top 93%) — low school quality limits family demand, transient renter base, plan for 1-2y turnover; 76% free/reduced lunch — lower-income household profile, screen leases tightly.
- Zoned schools: Julian C Gallardo El (math 13% / reading 22%, grade F, #3,805 of 4,322 statewide, top 89%, 544 students, 87% FRL); Southside H S (math 18% / reading 25%, grade F, #1,377 of 1,632 statewide, top 85%, 1,685 students, 85% FRL).
- Market conditions: Rents falling (-7.2%/yr); 369 active listings in the ZIP; 18 comparable units currently listed for rent nearby; rentals at typical pace (median 22d on market — plan ~3-4 weeks tenant-placement turnaround); 8,308 units permitted in Bexar County in 2024 (2,506 in 5+ unit buildings).
- This rent runs 33% of the median local income ($64k/yr) — at the standard rent-burdened threshold; future hikes will face affordability resistance.
Forward outlook
- In year one you build about $5k of equity ($1k loan paydown + $4k appreciation (2.0% local appreciation)).
- Bexar County population projected at +50% by 2050 — long-run rental-demand tailwind backs the buy-and-hold thesis.
- By year 7, paydown + projected appreciation supports a ~$35k cash-out refi (75% LTV) — recoverable capital for the next deal without selling this one.
Negotiation context
- It's been on market 28 days — a 2% lower offer ($197k) is reasonable based on typical stale-listing flexibility.
Risks & watch-outs
- Watch-outs: flood insurance adds $125/mo.
- Climate carrying-cost: in FEMA flood zone A (mandatory federal flood insurance); severe wind risk, 80% chance of damaging wind over 30y; extreme-heat days projected 3→9/yr by 2055 (HVAC capex compounding) — expect insurance premiums to compound above CPI over the hold.
Questions for the listing agent
- What do current leases actually rent for vs. the listed asking? Can we see a recent rent roll and the last 12 months of T-12 income?
- What's the actual annual flood-insurance premium (NFIP or private), and is the property in a SFHA with mandatory coverage?
- What does the HOA fee cover, when was the last increase, and are there any pending special assessments or reserve-fund shortfalls?
- Is there a deadline driving the sale (1031 exchange, divorce, estate, relocation)? That informs how much negotiation room exists.
- Crime grade is F in this area — have there been break-ins, vandalism, or insurance claims at this property in the last 3 years? What carrier currently insures it and at what premium?
- The area grade is low — what's the realistic commute time and amenity access for the typical tenant pool here? Any planned neighborhood developments (good or bad) we should know about?
- This sits on a lake — are riparian / water-frontage rights deeded with the parcel? Any dock permits, shoreline easements, or HOA water-use restrictions?
- What's the documented flood / surge / shoreline-erosion history here (FEMA AND non-FEMA — e.g., storm surge, creek backup, septic-field saturation)?
- Any water-quality or seasonal algae-bloom issues that affect tenant satisfaction or short-term-rental demand?
- What's the average days-on-market for RENTAL listings here right now (not sales)? A rising rental-DOM trend means longer vacancies and softer asking-rent achievability than the comps imply.
- What's the recent tenant-quality profile in this submarket — average credit score on applications, eviction rate, late-payment / NSF rate, and stable-employment percentage? A property-management company in the area should have these aggregated.
- How much new for-sale + rental construction is in the pipeline within 1–3 miles? Heavy new supply typically softens prices + rents 12–24 months out; constrained supply supports both.
Investment metrics
- 1% rule
- 0.88% ✗
- Cap rate
- 6.28%
- Cash-on-cash
- -0.05%
- DSCR
- 1.00
- GRM
- 9.4
CMA / ARV
- ARV (on-the-fly)
- $168,795
- Comps found
- 4
Show comp detail 4 sales within ~0.75 mi
| Address | Dist | Beds/Ba | Sqft | Sold | Price | $/sf | Match |
|---|---|---|---|---|---|---|---|
| 711 Vermilion | 0.53mi | 3/2.0 | 1,021 (-0%) | 3mo | $184,900 | $181 | 73 |
| — | 0.00mi | 2/1.5 (-1) | 896 (-12%) | 6mo | $79,000 | $88 | 68 |
| 822 Eight Iron | 0.60mi | 3/2.0 | 1,106 (+8%) | 11mo | $182,900 | $165 | 49 |
| 11231 Five Iron | 0.70mi | 3/2.0 | 1,106 (+8%) | 6mo | $150,000 | $136 | 49 |
Match score weights: distance 35% · size 25% · config 20% · recency 20%. Top-matched comps best support the ARV.
Projected returns pro-forma
2.03% appreciation · 0.0% rent growth · sell at horizon
- IRR
- 0.3%
- Equity multiple
- 1.01×
- Total profit
- $796
- Equity at exit
- $79,130
- IRR
- 2.9%
- Equity multiple
- 1.38×
- Total profit
- $21,407
- Equity at exit
- $114,185
Cash invested: $55,955 (down + closing). Projections, not guarantees.
Landlord ↔ Tenant lean methodology
- Overall (STATE)
- 87 Strongly Landlord-Friendly
- State Texas
- 87 Strongly Landlord-Friendly · R+5
- County
- — inherits STATE
- City
- — inherits STATE
ZIP-level market 78221
- Home prices YoY
- 0.8%
- Rents YoY
- -7.2%
- Active inventory
- 369
- Price-to-rent
- 9.4×
Monthly cashflow live
- Estimated rent
- $1,764 high interval (Pro) →
- Mortgage (P&I)
- −$1,048
- Tax est. 1.5%
- −$250 /mo · $2,998/yr
- Insurance
- −$83
- Flood insurance flood zone
- −$125 /mo · $1,502/yr
- HOA
- −$15
- Vacancy / Maint / Mgmt
- −$370
- Net cashflow
- $-128
Break-even live
UW: 25.0% down · 7.5% · 30yr · 1.5% tax · 5.0% vac · 8.0% maint · 8.0% mgmt
Financing live
Cash to close
- Down payment
- $49,960
- Closing costs
- $5,995
- Reserves months
- —
- Total cash needed
- —
Loan-product check · same deal, 3 products live
Conventional
25% down · 7.5% · 30yr
- Down + closing
- —
- Monthly P&I
- —
- Monthly cashflow
- —
- DSCR
- —
- Eligible?
- —
Personal DTI + credit; lowest rate.
DSCR
20% down · 8.5% · 30yr
- Down + closing
- —
- Monthly P&I
- —
- Monthly cashflow
- —
- DSCR
- —
- Eligible?
- —
No personal income docs; deal must DSCR.
Hard money
10% down · 12.0% · 12mo
- Down + closing
- —
- Monthly P&I
- —
- Monthly cashflow
- —
- DSCR
- —
- Eligible?
- —
Short-term bridge; refi at stabilization.
Rent comps 18 comps
| Address | Beds | Baths | Sqft | Rent | $/sqft | DOM | Units | Dist |
|---|---|---|---|---|---|---|---|---|
| 2203 Cielo Rio, Lot 102 San Antonio, TX | 2.0–4.0 | 2.0–2.5 | 1574 | $2,360 | $1.50 | 1d | 152 | 0.02mi |
| 11963 Sand Wedge Way San Antonio, TX | 3.0 | 3.5 | 1474 | $1,575 | $1.07 | 4d | 1 | 0.56mi |
| 718 Albatross Way San Antonio, TX | 3.0 | 2.0 | 1436 | $1,650 | $1.15 | 12d | 1 | 0.63mi |
| 12055 Links Pkwy San Antonio, TX | 3.0 | 2.0 | 1479 | $1,625 | $1.10 | 23d | 1 | 0.73mi |
| 12030 Picard Bnd San Antonio, TX | 3.0 | 2.0 | 1450 | $1,495 | $1.03 | 3d | 1 | 0.79mi |
| 907 Stricker Path San Antonio, TX | 3.0 | 2.0 | 1129 | $1,500 | $1.33 | 23d | 1 | 1.02mi |
| 13222 Dutra Rd San Antonio, TX | 3.0 | 2.0 | 1266 | $1,595 | $1.26 | 23d | 1 | 1.03mi |
| 1019 Snedeker Dr San Antonio, TX | 3.0 | 2.0 | 1200 | $1,449 | $1.21 | 23d | 1 | 1.06mi |
| 1343 Art Wall Way San Antonio, TX | 3.0 | 2.0 | 1440 | $1,395 | $0.97 | 43d | 1 | 1.09mi |
| 1019 Magrum Way San Antonio, TX | 3.0 | 2.0 | 1300 | $1,445 | $1.11 | 10d | 1 | 1.10mi |
| 1115 Janzen Rd San Antonio, TX | 3.0 | 2.0 | 1300 | $1,595 | $1.23 | 43d | 1 | 1.14mi |
| 1119 Jordan Xing San Antonio, TX | 3.0 | 2.0 | 1276 | $1,795 | $1.41 | 43d | 1 | 1.15mi |
| 1038 Janzen Rd San Antonio, TX | 3.0 | 2.0 | 1125 | $1,725 | $1.53 | 21d | 1 | 1.16mi |
| 1327 Mission Grande Unit 710 San Antonio, TX | 2.0 | 2.0 | 945 | $1,081 | $1.14 | 2d | 1 | 1.18mi |
| 12910 Clubhouse Blvd San Antonio, TX | 1.0–3.0 | 1.0–2.0 | 920 | $1,384 | $1.50 | 1d | 27 | 1.19mi |
| 1011 Catalonia Pass San Antonio, TX | 3.0 | 2.5 | 1470 | $1,700 | $1.16 | 23d | 1 | 1.33mi |
| 1015 Catalonia Pass San Antonio, TX | 3.0 | 2.0 | 1280 | $1,600 | $1.25 | 4d | 1 | 1.34mi |
| 102 Emerald Ash Unit 710 San Antonio, TX | 2.0 | 2.0 | 950 | $981 | $1.03 | 2d | 1 | 1.47mi |
HOA detail
- Monthly dues
- $15 · $180/yr
Listing history 15 events
-
2026-06-18days on market $199,840 Active 28 DOM
-
2026-06-17days on market $199,840 Active 27 DOM
-
2026-06-16days on market $199,840 Active 26 DOM
-
2026-06-15days on market $199,840 Active 25 DOM
-
2026-06-13days on market $199,840 Active 23 DOM
-
2026-06-13days on market $199,840 Active 22 DOM
-
2026-06-09days on market $199,840 Active 19 DOM
-
2026-06-08days on market $199,840 Active 18 DOM
-
2026-06-07days on market $199,840 Active 17 DOM
-
2026-06-04days on market $199,840 Active 14 DOM
-
2026-06-03days on market $199,840 Active 13 DOM
-
2026-06-02days on market $199,840 Active 12 DOM
-
2026-06-01statusdays on market $199,840 Active 11 DOM
-
2026-05-31days on market $199,840 New 10 DOM
-
2026-05-21$199,840 New
ⓘ Source: listings_history table (triggers on properties + properties_extension) + one-shot
backfill from property_details.listing_events for pre-trigger history.
Climate risk First Street
- Flood 1/10 Low FEMA zone A · 0% chance over 30 yrs
- Wildfire 1/10 Low
- Heat 7/10 Severe 3 d/yr ≥109°F today · 9 d/yr by 30 yrs out
- Wind 8/10 Severe 80% chance of damaging wind over 30 yrs
- Air quality 2/10 Low 0 unhealthy d/yr today · 1 by 30 yrs out
Nearby sold comps map
Loading sold comps map…
Walkable amenities ~0.75 mi
Loading nearby amenities…
Taxation est. · year 1
- Rental income
- $21,167
- − Mortgage interest
- −$11,194
- − Property taxes
- −$2,998
- − Insurance
- −$2,502
- − Repairs & maintenance
- −$1,693
- − Management
- −$1,693
- − HOA
- −$180
- − Depreciation
- −$5,814
- Taxable loss
- −$4,907
- Est. tax savings @ 24.0%
- +$1,178
- After-tax cash flow
- $-356/yr
For passive investors: Depreciation is non-cash, so a rental often shows a tax loss while cash-flowing — sheltering income. Rental losses are passive: they offset passive income freely, and up to $25,000/yr can offset ordinary (W-2) income if you actively participate and your MAGI is under $100k (phasing out to $0 by $150k); unused losses carry forward. On sale, claimed depreciation is recaptured at up to 25%, and gains may owe capital-gains tax (a 1031 exchange can defer both). Figures are a year-1 estimate at your 24.0% rate — not tax advice; consult a CPA.
Condition & rehab AI · 13 photos
This single-story home in San Antonio, TX, is in excellent condition with a modern design and well-maintained exterior. It offers a spacious floor plan with 3 bedrooms and 2 bathrooms, making it ideal for families or those looking for a move-in-ready home.
Value-add opportunities
- Both Landscaping and curb appeal — Enhances curb appeal and resale value
- Both Painting exterior and interior — Maintains and enhances curb appeal and resale value
- Both Landscaping and curb appeal — Enhances curb appeal and resale value
Renovation cost estimate screening
Value-add ROI direction
- Both Landscaping and curb appeal — Enhances curb appeal and resale value ↑
- Both Painting exterior and interior — Maintains and enhances curb appeal and resale value ↑
- Both Landscaping and curb appeal — Enhances curb appeal and resale value ↑
ⓘ Cost ranges are severity-bucket heuristics (US national rule-of-thumb). Get contractor quotes + a written scope before underwriting a rehab budget.
Schools (NCES district)
- District
- Southside ISD
- NCES district ID
- 4840920
- Math proficiency
- 16% ▼ -15.00%
- Reading proficiency
- 25% ▼ -2.00%
- Median HH income
- $43,526
- Composite
- 17.68/100
- National rank
- #9027
- State rank
- #771 of 826 in TX
Livability — San Antonio
- Score
- 80/100
- State rank
- #31
- US rank
- #1616
Category grades
Schools grade is shown separately in the Schools card above.
Census & demographics
- Census place
- San Antonio, TX
- County
- Bexar County · 1,990,555 people
- City population
- 1,806,925
- Metro
- San Antonio-New Braunfels, TX
- Population (ZIP)
- 42,178
- Household income
- $63,811
- Rent vs Own
- Severe rent burden
- 1180.0
Population outlook (Bexar County) Hauer SSP2
- Today (2025)
- 2,336,851 people
- By 2030
- 2,560,728 · +9.6%
- By 2040
- 3,020,569 · +29.3%
- By 2050
- 3,493,522 · +49.5%
- By 2075
- 4,668,459 · +99.8%
- By 2100
- 5,533,242 · +136.8%
Race, ethnicity, and origin ACS 2023
- Neighborhood character
- Predominantly Hispanic (89%)
- Race & ethnicity
- Hispanic / Latino 89% Two or more races 28% White 9% Native American 2%
- Hispanic origin (detail)
- Mexican 74%
- Common ancestry
- Lithuanian 1% Romanian 1%
- Foreign-born
- 16% · Canada
- Languages at home
- 45% English-only · Spanish 54%
Political lean MEDSL · Bexar
- 2024 margin
- Lean D (+9.8) · D 54.3% · R 44.6% · Other 1.1%
- 2008→2024 swing
- +4.2pp toward D · 2008: 5.6pp · 2024: 9.8pp
- All cycles
- 2024: D+9.8 2020: D+18.2 2016: D+13.5 2012: D+4.6 2008: D+5.6
Not yet ingested
- Civics
- —
Market trends
- HPI YoY
- ▲ 2.03%
- Current HPI
- 251.1635
- Rent YoY
- ▼ -7.21%
- Metro
- San Antonio-New Braunfels, TX
- State GDP YoY
- ▲ 3.95%
- F500 in state
- 110
Industry mix (Fortune 500 HQ in TX)
| Industry | F500 HQs | Revenue |
|---|---|---|
| Energy | 16 | $1,198B |
|
||
| Technology | 5 | $198B |
|
||
| Engineering / Construction | 4 | $72B |
|
||
| Energy Services | 3 | $60B |
|
||
| Utilities | 3 | $41B |
|
||
| Healthcare | 2 | $330B |
|
||
Price history
1 event — show timeline
- 2026-05-21 Listed $199,840 LERA
Cash-flow waterfall
monthlySold comps — $/sqft
last 12 mo · ≤1 miLoading sold comps…